- Select a language for the TTS:
- UK English Female
- UK English Male
- US English Female
- US English Male
- Australian Female
- Australian Male
- Language selected: (auto detect) - EN
Play all audios:
ABSTRACT Investigating the preferential flow path of a debris flow is crucial for quantifying the risk and developing mitigation strategies. Here, we examined 66 debris flows from the
Western Ghats in India employing Rapid Mass Movement Simulation (RAMMS)::Debris Flow software to understand the kinematics of run-out. Our analysis revealed that the debris flow run-out in
the study area follow two main routes: 60 along the existing stream channels (SC) and six following the steepest hill slope (SH). We further simulated these debris flows to identify their
drivers, and derived a threshold that distinguishes between SC and SH-type debris flows. Our results indicate that the debris flow volumes greater than 7072 cu. m is SH-type, whereas those
with smaller volumes are more likely to follow SC paths. The model’s accuracy was validated against field observations, achieving a success rate of 93% for SH-type flows and 85% for SC.
SIMILAR CONTENT BEING VIEWED BY OTHERS RESPECTIVE INFLUENCE OF VERTICAL MOUNTAIN DIFFERENTIATION ON DEBRIS FLOW OCCURRENCE IN THE UPPER MIN RIVER, CHINA Article Open access 16 July 2020
INTEGRATING EXPERIMENTAL AND NUMERICAL APPROACHES TO SIMULATE VISCOUS DEBRIS FLOWS USING AN HBP-SPH FRAMEWORK Article Open access 13 May 2025 EVALUATION OF HIGHWAY DEBRIS FLOW HAZARD BASED
ON GEOMORPHIC EVOLUTION THEORY COUPLED WITH MATERIAL RESPONSE RATE Article Open access 12 June 2024 INTRODUCTION Debris flow run-out and the associated risks to downstream population are
important topics of research1,2,3. Usually, debris flow has long run-out within which most of the damage is confined, as the immense kinetic energy of debris destroys almost everything in
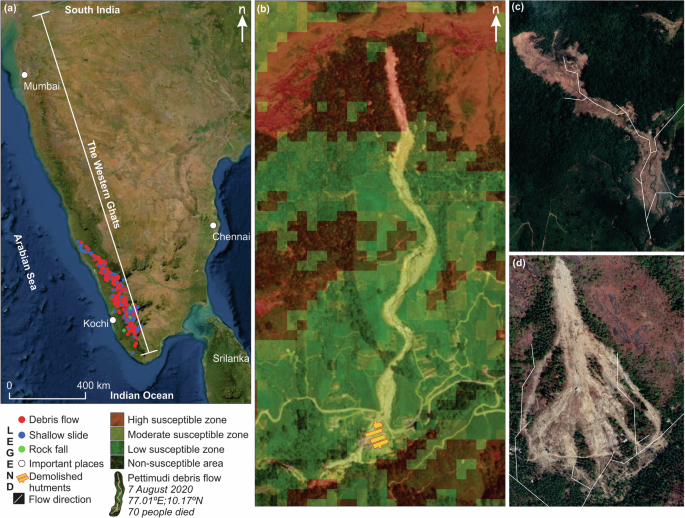
its path4,5. Long run-out debris flows are common in tropical areas with high relative relief, such as in the Western Ghats. This area at the passive continental margin bordering the western
coastal region of India is selected for this study (Fig. 1a). To our knowledge, the only physics-based susceptibility model for this region, developed by Sajinkumar and Oommen6, focuses
solely on the initiation area, leaving the run-out zone unaddressed7. Their analysis of debris flow run-outs shows that these flows often traverse different landslide susceptibility zones
(Fig. 1b). While debris flow initiation typically occurs in high-susceptibility areas, the run-out can extend into zones of moderate or low susceptibility, or even into areas considered
non-susceptible. This creates a significant challenge for planners, as residents may feel a false sense of security in low susceptibility zones, unaware of the unpredictable nature of debris
flow paths. Accurately predicting debris flow run-out, which is influenced by multiple factors, is therefore crucial. Landslide runout modelling helps in assessing the hazard and risk of
fast-moving debris flows, and it can predict the dynamics of flow1,8,9. This study investigates 66 debris flows in the Western Ghats using comprehensive evaluation and modeling techniques.
The goal is to understand the run-out dynamics of debris flows, which will aid in planning and developmental activities without the need for complex run-out modelling. STUDY AREA The western
flank of the Western Ghats is susceptible to landslides due to its steep topography and weather pattern10,11,12. The area is directly exposed to southwest (June-September) and northeast
(October–November) monsoons. High population density in landslide prone areas increases the vulnerability of the community to these natural disasters13, and parts of the Western Ghats within
Kerala have a high population density averaging 859 persons/sq. km14. The Western Ghats experiences numerous debris flows each year during the southwest monsoon season. One exceptionally
severe event of 2018, comprised of 2816 debris flows, 1760 shallow slides, and 152 rock falls15,16 (Fig. 1a). This event was the most devastating in recent memory17,18,19. The subsequent
years also have witnessed catastrophic debris flows that killed hundreds of people at Kavalappara (2019; 59 deaths), Puthumala (2019; 17), Pettimudy (2020; 70), Kokkayar (2021; 7), Plappally
(2021; 4), Kavali (2021; 6)10, and Wayanad (2024; ~250). For this study, we have selected 66 debris flows (Supplementary Fig. 1) across the state of Kerala with large area coverage i.e.,
more than 24,000 sq. m. These landslides demonstrate the unpredictable nature of landslide susceptibility zones, with significant casualties and destruction occurring even in low and
non-susceptible areas. The events underscore the urgent need for comprehensive risk mapping that includes predicted run-out paths to enhance disaster preparedness and mitigate future losses.
RESULTS AND DISCUSSION DEBRIS FLOW RUN-OUT PATH Debris flow will ultimately come to rest in one of two locations: either the nearest valley occupied by a body of water or a nearby plain.
Theoretical models indicate that debris flows may follow one of the two possible paths: along the flow direction (SC), which can be a lower-order stream or along the shortest distance (SH),
which corresponds to the steepest slope (Fig. 1c, d). Of the 66 debris flows, 60 followed SC, and six preferred SH (Supplementary Fig. 2). This was identified by comparing the run-out with
the interpreted drainage network. CALIBRATION OF RHEOLOGICAL PARAMETERS To match the volume with the areal extent for each of these 66 debris flows, a trial-and-error approach was employed.
Figure 2a, b presents the results for two representative debris flows, one following the SC path and the other following the SH path, and illustrates the increase in length and width that
accompanies increasing release volume. The dry-Coulomb type friction controls the final flow characteristics when the flow is slow20, with high values reducing the run-out length (Fig. 2c,
d). On the other hand, viscous-turbulent friction controls the flow when the materials flow at high velocities, as shown in Fig. 2e, f. The obtained best-fit values were used to get the
run-out parameters such as flow height, velocity, pressure, and deposition (Fig. 2g–n). During the initial stages of a debris flow, flow height, velocity, and pressure tend to be highest,
typically occurring in the areas characterized by higher susceptibility classes characterized by steep slopes. However, deposition tends to occur in areas where the slope is less pronounced
and susceptibility is low. ACCURACY OF SIMULATION The accuracy of matching debris flow run-out simulation to actual debris flow footprint shows that the debris flow following SH can be well
characterized. The simulation results cover more area than that of the actual debris flow due to constraints in the resolution of elevation data. An average of 93% area of SH-type was
covered by simulation, whereas for SC-type the coverage was 82%. The modelled debris flow and real debris flow footprint were intersected, and the average area matching was 53% for SH-type
and 32% for SC-type. The excess area simulated by the model over the real condition is 40% for SH-type and 62% for SC (Fig. 3a–d). The SC debris flows have lower release volume than SH-type,
but their narrow and long run-out path is due to the pre-existing channel morphology and pore-water pressure. This long narrow run-out simulated with a medium-resolution elevation data
tends to occupy wider paths than actual, which led to excess area. IDENTIFYING THE THRESHOLD The flow path characteristic of a debris flow is controlled by run-out material and release
volume, which is the initial energy source. The wider and shorter run-out paths for SH-type are due to high release volume, whereas longer and narrow run-out path for SC-type is due to
existing channel and water content. The distribution of release volume and friction coefficients such as dry-Coulomb, and viscous-turbulent are shown in Fig. 4. Release volume is determined
by estimating the release area and release depth from field observation, which, for this event, ranges between 901 and 93859 cu. m. To derive the threshold for differentiating SC and SH
debris flow types, an interquartile method was used. In this approach, the upper quartile (75th percentile, Q3) of SC and the lower quartile (25th percentile, Q1) of SH were analyzed to
identify a potential threshold. The threshold was estimated as the midpoint of the gap between Q3 of SC and Q1 of SH (Fig. 5a). To assess the variability of this threshold, bootstrapping was
applied by generating multiple resampled datasets with replacement. For each resampled dataset, the threshold (midpoint between Q3 of SC and Q1 of SH) was calculated, allowing a
non-parametric confidence interval to be determined, which reflects the natural variability within the data sample. The bootstrapping results yield a median threshold of 7072 cu. m with a
95% confidence interval ranging from 3800.35 to 32322 cu. m. This median threshold serves as the central estimate from 20000 bootstrapped thresholds and is robust against skew or outliers,
making it a reliable central measure. Figure 5b illustrates the probability density functions for SC and SH volumes, with the threshold and confidence interval visually displayed to
highlight the overlap and uncertainty in classification. This plot highlights the overlap between SC and SH distributions, and shows the range where classification is uncertain due to data
variability. Figure 5c shows the distribution of bootstrapped threshold values, providing insight into the natural variability and reliability of the estimated threshold. Practically, debris
flow volumes below this threshold are more likely to belong to the SC-type, while those above are likely to be SH. The wide confidence interval suggests that, while 7072 cu. m is the best
estimate, the true threshold may vary between 3800.35 to 32322 cu. m due to inherent variability in the data. This broad interval indicates substantial variability or potential overlap
between SC and SH distributions, which makes precise classification challenging. However, the 7072 cu. m threshold remains a practical and viable option, especially when used within a
probabilistic framework. Lastly, Fig. 5d demonstrates the utility of a probabilistic framework, showing how classification confidence varies near the threshold. This approach enables
flexible classification, with higher certainty for volumes significantly below or above the threshold and a probabilistic zone for volumes near it. With additional data, this method could be
refined further, potentially narrowing the confidence interval and improving classification accuracy, enhancing its practical value in distinguishing between SC and SH debris flow types. If
the initial release volume is less than 7072 cu. m, debris flow tends to follow SC; otherwise, it will be SH. In order to quantify the release volume of a given area, it is necessary to
determine the thickness of the soil present in different susceptible regions. Although measuring soil thickness can be challenging, techniques are available to estimate this quantity based
on slope measurements21,22. Meanwhile, the friction coefficients such as dry-Coulomb, and viscous-turbulent do not appear to exert significant control over the behavior of debris flow in
this area, since there is no boundary for defining the threshold (Fig. 4b, c). The effect of these debris flows on deposition, velocity, pressure, and flow height are shown in Fig. 6a–d.
Deposition of materials occurs in a gentle slope, which is normally non-susceptible. Deposition, velocity, pressure, and flow height are higher in SH-type. During rainstorm events, the
surface runoff will be mixed with SC debris flows. In SH-type there is much less effect of water, and one would expect that the run-out will be shorter. But as the slope is steeper, the
energy will be high, and thus, the velocity and pressure are high. These 66 debris flows cover an area of 7.93 sq. km. 76% of this area is occupied by 60 SC-type debris flow and 24% by six
SH-type debris flows (Fig. 7). This is due to the huge volume of material released by SH-type that makes wider run-outs than SC-type debris flows with less volume. The trend of debris flow
leading to catastrophic consequences on life and property is caused by deposition occurring outside the high susceptibility area than within it. The severity of this issue arises due to the
perception of these areas as safe for habitation. The results show that the release volume is crucial in determining the run-out path. The debris flow with a higher release volume than the
threshold value (7072 cu. m) tends to follow SH-type. The high energy associated with the material volume might have caused high velocity for SH-type in contrast to SC-type that follows a
flow direction path with low release volume. The high release volume makes SH debris flow more hazardous than SC. The threshold derived in this study to determine the path of debris flow can
be used to classify them and assess their potential impacts on communities residing in areas with different susceptibility levels. Hence, this threshold can be employed to create landslide
risk maps. The results of this study establish a threshold volume of 7072 cu. m to distinguish between SC and SH paths in debris flows. This threshold, based on RAMMS modeling of 66 debris
flows in the Western Ghats, allows for predicting flow paths using only terrain data, such as digital elevation models (DEMs), rather than running computationally intensive simulations for
each event. Although RAMMS simulations can predict flow paths accurately, our threshold provides a practical alternative, particularly valuable for local decision-makers who may lack
expertise in specialized modeling software. By using this volume threshold, practitioners can quickly determine the likely flow path based only on debris volume, supporting cost-effective
and timely risk assessment and planning. Thus, this threshold-based approach serves as a useful tool in hazard mitigation, enabling regions with limited resources to assess debris-flow
dynamics and plan accordingly without extensive computational demands. However, the creation of such maps is beyond the scope of this study, and therefore warrants further research. Attempts
to create susceptibility maps with run-out area were attempted earlier23, but its reliability in comparison with the existing susceptibility maps need to be validated in areas like the
Western Ghats. Based on the outcomes, it should be noted that the RAMMS model exclusively takes into account the volume and material properties of the landslides and neglects other
significant influencing factors. The simulation of the narrow run-out path for SC-type debris flow using 12.5 m elevation data is also challenging and caused over-prediction of debris flow
area. METHODS The run-out characteristics of catastrophic debris flows of the study area have been assessed using a computer program called Rapid Mass Movements Simulation (RAMMS)::Debris
Flow. Previously, RAMMS has been successfully used for modeling the run-out scenarios of a few independent slides in the Western Ghats24,25. This computer program predicts the flow path,
distance, and velocities based on slope, soil and depleting mass conditions26. The simulated output from the model predicts the slope-parallel velocities and flow heights using
depth-averaged equations26. The model requires basic input parameters such as initial release volume and a digital elevation model (DEM). Two types of release information are available for
use in the model: block release and hydrograph. We adopted the block release method in this study, as the data availability limits the use of the hydrograph model. The input DEM used is ALOS
PALSAR with 12.5 m spatial resolution, which can be freely downloaded (www.asf.alaska.edu/). RAMMS uses the Voellmy-fluid friction model, which is controlled by two friction parameters:
dry-Coulomb type friction (μ) that scales with normal stress, and a velocity-squared drag or viscous-turbulent friction (ξ)25,27. Dry-Coulomb type friction ranges between 0.01 and 0.2, and
viscous-turbulent friction between 200 and 1100 m/s2. These rheological parameters are estimated through a trial and error approach such that the simulation best fits the debris flow
footprint (observed best-fit was utilized) whereas the volume estimation is based on the soil thickness in the scarp area, given as input release depth (m) in RAMMS. This helps in
identifying the drivers of each long run-out debris flow. The parameters used are given in Supplementary Table 1. The drainage networks for the Western Ghats were derived from ALOS PALSAR
elevation data using the hydrology tools in ArcGIS (https://desktop.arcgis.com/en/arcmap/). Drainage was derived from flow accumulation raster. A threshold for flow accumulation was derived
by matching the drainages paths of the Survey of India topographic sheets on 1:25000 scale. Drainage pattern and debris flow run-out were compared to identify whether debris followed the
existing stream channels (SC) or the steepest hill slope (SH). Slope stability classes derived using the physics-based GIS TISSA model28 were used to quantify the different susceptibility
zones through which the run-out of these 66 debris flows navigated. The selected 66 debris flows range in length from 218 m to 5766 m with a mean length of 945 m and run-out area between
24,375 sq. m and 684,141 sq. m. Based on the ALOS PALSAR topographic data and by varying the parameters such as the release volume and both the friction coefficients, a simulation was
conducted. Initially, the simulation was setup with the default frictional parameters (μ = 0.2, ξ = 200 m/s2), and different release volumes. The results were checked for the degree of match
and mismatch. Simulation was performed repeatedly with varying volumes and friction coefficients until an optimal match was reached as compared to the real conditions. The release depth was
adjusted to cover the areal extent of the debris flow, whereas friction coefficients were adjusted to match the run-out. The release area was identified through field observations and then
cross-referenced with high-resolution imageries from Google Earth. It is worth noting that the increase in the release depth leads to corresponding increase in both volume and run-out. The
friction coefficients and the release volume information of the best matching simulation of 66 debris flows were analyzed to identify the threshold of these parameters that define the flow
type. The schematic diagram of the methodology described above is shown in Supplementary Fig. 3. DATA AVAILABILITY Data will be made available from the corresponding author through request.
REFERENCES * Pastor, M. et al. Application of a SPH depth-integrated model to landslide run-out analysis. _Landslides_ 11, 793–812 (2014). Article Google Scholar * Cascini, L., Cuomo, S.,
Pastor, M., Sorbino, G. & Piciullo, L. SPH run-out modelling of channelised landslides of the flow type. _Geomorphology_ 214, 502–513 (2014). Article Google Scholar * Zeng, P., Sun,
X., Xu, Q., Li, T. & Zhang, T. 3D probabilistic landslide run-out hazard evaluation for quantitative risk assessment purposes. _Eng. Geol._ 293, 106303 (2021). Article Google Scholar *
Legros, F. The mobility of long-runout landslides. _Eng. Geol._ _63_, 301–331 (2002). * Dade, B. W. & Huppert, H. E. (1998). Long-runout rockfalls. _Geology_ 26, 803–806 (2002). Article
Google Scholar * Sajinkumar, K. S., & Oommen, T. Landslide atlas of Kerala. GSI Publications, 7 (2021). * Pareek, T., Bhuyan, K., Cees van Weseten, Rajaneesh, A., Sajinkumar, K. S.,
Lombardo, L. _Analysing the posterior predictive capability and usability of landslide susceptibility maps: a case of Kerala, India. Landslides_ https://doi.org/10.1007/s10346-024-02389-4
(2024). * Crosta, G. B., Imposimato, S. & Roddeman, D. G. Numerical modelling of large landslides stability and runout. _Nat. Hazards Earth Syst. Sci._ 36, 523–538 (2003). Article
Google Scholar * McDougall, S. 2014 Canadian Geotechnical Colloquium: Landslide runout analysis—current practice and challenges. _Can. Geotech. J._ 54, 605–620 (2017). Article Google
Scholar * Ajin, R. S. et al. The tale of three landslides in the Western Ghats, India: lessons to be learnt. _Geoenviron. Disasters_ 9, 16 (2022). Article Google Scholar * Kuriakose, S.
L., Van Beek, L. P. H. & Van Westen, C. J. Parameterizing a physically based shallow landslide model in a data poor region. _Earth Surf. Process. Landf._ 34, 867–881 (2009). Article
Google Scholar * Martha, T. R., Roy, P., Khanna, K., Mrinalni, K. & Kumar, K. V. Landslides mapped using satellite data in the Western Ghats of India after excess rainfall during August
2018. _Curr. Sci._ 117, 804–812 (2019). Article Google Scholar * Fatmawati, D., Nurdin, E. A., Pangastuti, E. I., Kurnianto, F. A. & Yushardi, Y. Analysis of landslide disaster at the
Quaternary Volcanic Landform. _IOP Conf. Ser.: Earth Environ. Sci._ 975, 012012 (2022). Article Google Scholar * Jose, M. & Padmanabhan, M. Dynamics of agricultural land use change in
Kerala: a policy and social-ecological perspective. _Int. J. Agric. Sustainability_ 14, 307–324 (2016). Article Google Scholar * Hao, L, et al. Constructing a complete landslide inventory
dataset for the 2018 monsoon disaster in Kerala, India, for land use change analysis. _Earth Syst. Sci. Data_ 12, 2899–2918 (2020). Article Google Scholar * Hao, L. et al. Evaluating the
relation between land use changes and the 2018 landslide disaster in Kerala, India. _Catena_ 216, 106363 (2022). Article Google Scholar * Sajinkumar, K. S. et al. Migrating rivers,
consequent paleochannels: The unlikely partners and hotspots of flooding. _Sci. Total Environ._ 807, 150842 (2022). Article CAS Google Scholar * Vishnu, C. L. et al. Satellite-based
assessment of the August 2018 flood in parts of Kerala, India. _Geomat., Nat. Hazards Risk_ 10, 758–767 (2019). Article Google Scholar * Vishnu, C. L. et al. Catastrophic flood of August
2018, Kerala, India: Study of partitioning role of lineaments in modulating flood level using remote sensing data. _Remote Sens. Appl.: Soc. Environ._ 20, 100426 (2020). Google Scholar * de
Haas, T. et al. Initiation and flow conditions of contemporary flows in Martian gullies. _J. Geophys. Res.: Planets_ 124, 2246–2271 (2019). Article Google Scholar * Patton, N. R., Lohse,
K. A., Godsey, S. E., Crosby, B. T. & Seyfried, M. S. Predicting soil thickness on soil mantled hillslopes. _Nat. Commun._ 9, 3329 (2018). Article Google Scholar * Weidner, L., Oommen,
T., Escobar-Wolf, R., Sajinkumar, K. S. & Samuel, R. A. Regional-scale back-analysis using TRIGRS: an approach to advance landslide hazard modeling and prediction in sparse data
regions. _Landslides_ 15, 2343–2356 (2018). Article Google Scholar * Horton, P., Jaboyedoff, M., Rudaz, B. E. A. & Zimmermann, M. Flow-R, a model for susceptibility mapping of debris
flows and other gravitational hazards at a regional scale. _Nat. hazards earth Syst. Sci._ 13, 869–885 (2013). Article Google Scholar * Abraham, M. T., Satyam, N., Reddy, S. K. P. &
Pradhan, B. Runout modeling and calibration of friction parameters of Kurichermala debris flow, India. _Landslides_ 18, 737–754 (2021). Article Google Scholar * Jain, N., Martha, T. R.,
Khanna, K., Roy, P. & Kumar, K. V. Major landslides in Kerala, India, during 2018–2020 period: an analysis using rainfall data and debris flow model. _Landslides_ 18, 3629–3645 (2021).
Article Google Scholar * Christen, M., Kowalski, J. & Bartelt, P. RAMMS: Numerical simulation of dense snow avalanches in three-dimensional terrain. _Cold Reg. Sci. Technol._ 63, 1–14
(2010). Article Google Scholar * Kumar, V., Gupta, V., Jamir, I. & Chattoraj, S. L. Evaluation of potential landslide damming: Case study of Urni landslide, Kinnaur, Satluj valley,
India. _Geosci. Front._ 10, 753–767 (2019). Article Google Scholar * Escobar-Wolf, R., Sanders, J. D., Vishnu, C. L., Oommen, T. & Sajinkumar, K. S. A GIS tool for infinite slope
stability analysis (GIS-TISSA). _Geosci. Front._ 12, 756–768 (2021). Article Google Scholar Download references ACKNOWLEDGEMENTS AR acknowledges the University of Kerala for funding his
Ph.D. VKK acknowledges the National Fellowship for Scheduled Caste Students (NFSC) of the Department of Social Justice and Empowerment, Government of India, for providing the Ph.D.
fellowship. The research was also a part of the BGS International NC programme ‘Geoscience to tackle Global Environmental Challenges’ (NERC reference NE/X006255/1). KSS and YPA acknowledges
ISRO-DMSP grant (Grant no. ASCB/AS/2023/06). AUTHOR INFORMATION AUTHORS AND AFFILIATIONS * Department of Geology, University of Kerala, Thiruvananthapuram, 695581, Kerala, India A.
Rajaneesh, V. K. Krishnapriya, K. S. Sajinkumar & A. P. Pradeepkumar * British Geological Survey, Environmental Science Centre, Nicker Hill, Keyworth, Nottingham, NG12 5GG, UK Nikhil
Nedumpallile Vasu & Vanessa J. Banks * Faculty of Geoinformation Science and Earth Observation (ITC), University of Twente, Enschede, 7500AA, the Netherlands Cees van Westen * Department
of Geology and Geological Engineering, University of Mississippi, University, MS, 38677, USA Thomas Oommen * Indian Institute of Science Education and Research, Mohali, 140306, Punjab,
India Ali P. Yunus Authors * A. Rajaneesh View author publications You can also search for this author inPubMed Google Scholar * V. K. Krishnapriya View author publications You can also
search for this author inPubMed Google Scholar * K. S. Sajinkumar View author publications You can also search for this author inPubMed Google Scholar * Nikhil Nedumpallile Vasu View author
publications You can also search for this author inPubMed Google Scholar * Cees van Westen View author publications You can also search for this author inPubMed Google Scholar * Thomas
Oommen View author publications You can also search for this author inPubMed Google Scholar * Ali P. Yunus View author publications You can also search for this author inPubMed Google
Scholar * Vanessa J. Banks View author publications You can also search for this author inPubMed Google Scholar * A. P. Pradeepkumar View author publications You can also search for this
author inPubMed Google Scholar CONTRIBUTIONS AR: Methodology, software, resources, validation. VKK: Writing—original draft, methodology, software, formal analysis, investigation. KSS:
Conceptualization, supervision, validation, visualization, writing—review and editing. NNV: Software, resources, validation, writing—review and editing. CvW: Validation, writing—review and
editing. TO: Investigation, supervision, writing-review and editing, visualization. YPA: Visualization, validation, writing—review and editing VJB: Visualization, validation, writing—review
and editing. APP: Visualization, validation, writing—review and editing. CORRESPONDING AUTHOR Correspondence to K. S. Sajinkumar. ETHICS DECLARATIONS COMPETING INTERESTS The authors declare
no competing interests. ADDITIONAL INFORMATION PUBLISHER’S NOTE Springer Nature remains neutral with regard to jurisdictional claims in published maps and institutional affiliations.
SUPPLEMENTARY INFORMATION SUPPLEMENTARY INFORMATION RIGHTS AND PERMISSIONS OPEN ACCESS This article is licensed under a Creative Commons Attribution-NonCommercial-NoDerivatives 4.0
International License, which permits any non-commercial use, sharing, distribution and reproduction in any medium or format, as long as you give appropriate credit to the original author(s)
and the source, provide a link to the Creative Commons licence, and indicate if you modified the licensed material. You do not have permission under this licence to share adapted material
derived from this article or parts of it. The images or other third party material in this article are included in the article’s Creative Commons licence, unless indicated otherwise in a
credit line to the material. If material is not included in the article’s Creative Commons licence and your intended use is not permitted by statutory regulation or exceeds the permitted
use, you will need to obtain permission directly from the copyright holder. To view a copy of this licence, visit http://creativecommons.org/licenses/by-nc-nd/4.0/. Reprints and permissions
ABOUT THIS ARTICLE CITE THIS ARTICLE Rajaneesh, A., Krishnapriya, V.K., Sajinkumar, K.S. _et al._ Predicting debris flow pathways using volume-based thresholds for effective risk assessment.
_npj Nat. Hazards_ 2, 1 (2025). https://doi.org/10.1038/s44304-024-00055-2 Download citation * Received: 19 September 2024 * Accepted: 19 December 2024 * Published: 10 January 2025 * DOI:
https://doi.org/10.1038/s44304-024-00055-2 SHARE THIS ARTICLE Anyone you share the following link with will be able to read this content: Get shareable link Sorry, a shareable link is not
currently available for this article. Copy to clipboard Provided by the Springer Nature SharedIt content-sharing initiative