- Select a language for the TTS:
- UK English Female
- UK English Male
- US English Female
- US English Male
- Australian Female
- Australian Male
- Language selected: (auto detect) - EN
Play all audios:
ABSTRACT The objective of this work was to adapt and evaluate the performance of a Bayesian hybrid model to characterize objective temporal medication ingestion parameters from two clinical
studies in patients with serious mental illness (SMI) receiving treatment with a digital medicine system. This system provides a signal from an ingested sensor contained in the dosage form
to a patient-worn patch and transmits this signal via the patient’s mobile device. A previously developed hybrid Markov-von Mises model was used to obtain maximum-likelihood estimates for
medication ingestion behavior parameters for individual patients. The individual parameter estimates were modeled to obtain distribution parameters of priors implemented in a Markov
chain-Monte Carlo framework. Clinical and demographic covariates associated with model ingestion parameters were also assessed. We obtained individual estimates of overall observed ingestion
percent (median:75.9%, range:18.2–98.3%, IQR:32.9%), rate of excess dosing events (median:0%, range:0–14.3%, IQR:3.0%) and observed ingestion duration. The modeling also provided estimates
of the Markov-dependence probabilities of dosing success following a dosing success or failure. The ingestion-timing deviations were modeled with the von Mises distribution. A subset of 17
patients (22.1%) were identified as prompt correctors based on Markov-dependence probability of a dosing failure followed by a dosing success of unity. The prompt corrector sub-group had a
better overall digital medicine ingestion parameter profile compared to those who were not prompt correctors. Our results demonstrate the potential utility of a Bayesian Hybrid Markov-von
Mises model for characterizing digital medicine ingestion patterns in patients with SMI. SIMILAR CONTENT BEING VIEWED BY OTHERS DEVELOPMENT OF A DIGITAL INTERVENTION FOR PSYCHEDELIC
PREPARATION (DIPP) Article Open access 19 February 2024 DIGITIZING CLINICAL TRIALS Article Open access 31 July 2020 WHAT PATIENTS AND CAREGIVERS WANT TO KNOW WHEN CONSENTING TO THE USE OF
DIGITAL BEHAVIORAL MARKERS Article Open access 06 December 2024 INTRODUCTION Lack of adherence to medication is an important factor that contributes to increased healthcare utilization1,2:
Among patients with serious mental illness (SMI)—which includes schizophrenia, bipolar disorder, and major depression—this is of particular concern, with some reports estimating rates of
nonadherence as high as 60%.1,3 Within the SMI population, effective pharmacotherapy is critical for managing the risk of serious potential adverse events such as relapse of psychosis,
recurrence of symptoms, poor social functioning, hospitalizations, and suicide attempts.4,5 Conventional methods of inferring medication ingestion adherence to pharmacotherapy are limited in
their utility as they acquire data on surrogate measures associated with medication ingestion events and involve subjectivity. Examples of older methods with high subjectivity are patient
self-reports, medication possession ratio,6 and percentage of days covered.7 Newer approaches such as electronic blister packs and medication event monitoring systems have lower
subjectivity; however, these methods assume that the interaction with the packaging implies successful ingestions. Pharmacokinetic sampling is sometimes leveraged as an objective measure of
general adherence, but is sub-optimal in routine clinical practice because it is invasive and provides only a single snapshot in what may have been many weeks of ingestion opportunities.
Given the limitations of conventional medication ingestion monitoring systems, there is a clearly recognized but yet unmet clinical need that digital medicine systems are ideally suited to
address. Digital medicine, in this context, refers to the combination of an active pharmaceutical and an ingestible sensor component that communicates to a mobile or web-based application to
capture that a patient has taken their medication at a specific time.8 A core objective of digital medicine systems is to improve patient adherence9,10; however, one of their primary
advantages over competing alternatives is that they provide a signal corresponding to successful medication ingestion events, which can directly enable timely and impactful interventions by
the care team.10 These systems have the potential for a transformative impact on understanding medication ingestion behaviors, which could lead to better public health outcomes over time.
Given the importance of medication ingestion data for informing clinical decision making (particularly in SMI) and the rising prevalence of risk stratification and predictive models in both
the clinical and population health settings, the successful application of statistical frameworks for describing objective patient medication ingestion patterns is of value. This research
applies a novel Bayesian model to characterize digital medicine data from two clinical studies in SMI: The model,11,12,13 which has not been extensively investigated in digital medicine, or
in SMI patients, provides informative metrics on medication ingestion patterns including observed medication ingestion percent, excess dosing, duration of observed treatment, probability of
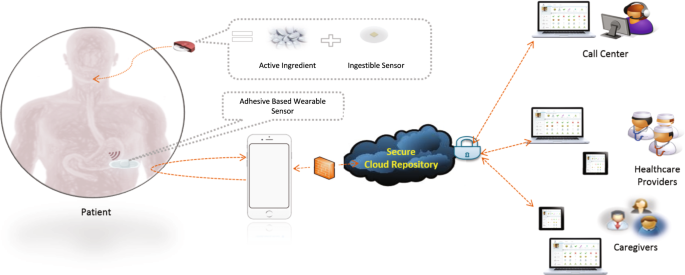
dosing succeses following dosing successes or failures, and medication ingestion-timing deviations. RESULTS DESCRIPTION OF THE DIGITAL MEDICINE SYSTEM The digital medicine system leveraged
in this work is composed of a wearable sensor (patch), a mobile application, and an ingestible sensor embedded in an active pharmaceutical, which has been developed to capture medication
ingestions in patients with SMI14 (Fig. 1). DEMOGRAPHIC, CLINICAL, AND DOSING CHARACTERISTICS The overall demographic and clinical characteristics of the study sample are summarized in Table
1. Demographic, clinical and prescribed dosing data from 79 subjects from two clinical studies, with 49 and 30 subjects, respectively were pooled. Two subjects (one from each study) were
excluded from the modeling because they took only one dose. The study sample contained representative numbers of the White–American and Black or African–American subjects. However, the
numbers of Asian and Other racial groups were small as were the number of subjects of Hispanic or Latino ethnicity. There were no American Indian or Alaska Natives and Native Hawaiian or
Other Pacific Islanders. Table 2 summarizes the prescribed drug dosing regimen and observed digital medicine ingestion-related characteristics in the study sample. The median aripiprazole
dose was 15 mg (Interquartile range = 10, Range: 2–30 mg). The median number of concomitant medications was 4 (Interquartile range = 3, Range: 1–12). The median duration (days) elapsed
between first and last ingestion was 53 days, with a median of 75.9% of the expected ingestions being observed (observed ingestion percent). Finally, The frequency of excess dosing events
ranged from 0–14.3% across patients. BAYESIAN MODELING OF DIGITAL MEDICINE INGESTION PARAMETERS Figure 2 compares the observed probability density histograms for overall observed ingestion
percent (OIP), the Poisson _λ_ parameter describing the observed excess dosing events, as well as mean and concentration parameters for the von Mises distribution describing the observed
ingestion-timing deviations. The Bayesian model satisfactorily characterized the OIP density function and the monotonically decreasing nature of the Poisson _λ_ parameter density function.
The fit of the von Mises concentration parameter was satisfactory but there was modest lack of fit for the sharp peak of the von Mises mean density function. We hypothesized that this
deviation was potentially related to the excess density at _p_FS = 1, which we address in the next section. The two main Markov parameters, _p_SS and _p_FS, captured the probability of an
ingestion success following an ingestion success, and the probability of an ingestion success following an ingestion failure, respectively. With the exception of the aforementioned excess
point density at _p_FS = 1, both _p_SS(_i_) and _p__FS_(_i_) were adequately captured as functions of the parameters _s_(_i_) and _σ_(_i_) from helix-coil theory in polymer physics15,16,17
(see Methods). Figure 3 compares the observed probability density histograms for _s_(_i_) and _σ_(_i_), as well as _p_SS(_i_) and _p_FS(_i_), to the corresponding Bayesian probability
density estimates. The observed probability density histograms of all four parameters had asymmetric non-Gaussian characteristics. The long-tailed density of _s_(_i_) and _σ_(_i_), as well
as the right skewed, domain-limited density of _p_SS(_i_) and _p_FS(_i_) were satisfactorily characterized by our Bayesian model priors—again, with the exception of the excess density at
_p_FS = 1. DIGITAL MEDICINE INGESTION PARAMETER PROFILES OF THE PROMPT CORRECTOR SUB-GROUP We investigated the lack of fit at _p_FS = 1 further. For purposes of these additional analyses, we
defined a patient to be a Prompt Corrector (PC) if they exhibited _p_FS = 1 and as a Non-Prompt Corrector (NPC) otherwise. The proportion of PC patients was 22.1% (_N_ = 17): This sub-group
was comprised of 13.6% (6 of 44) of the schizophrenia sample, 36.4% (8 of 22) of the bipolar type 1 sample, and 27.3% (3 of 11) of the major depressive disorder sample. These differences
did not reach statistical significance (_p_ = 0.11, _χ_2 test, df = 5). We did not find evidence for differences in aripiprazole dose (_p_ = 0.20, Mann–Whitney test), number of concomitant
medications (_p_ = 0.65, Mann–Whitney test), baseline Clinical Global Impression Severity scale (CGI-S, a 7-point clinician-based scale measure of disease severity, higher scores are worse)
values (_p_ = 0.063, Mann–Whitney test) or baseline Personal and Social Performance Scale (PSP) Score of functioning and social performance (_p_ = 0.91, Mann-Whitney test). We did not obtain
evidence for differences in gender (_p_ _=_ 0.10, Fisher Exact Test) or race (_p_ = 0.42, Fisher Exact Test, for Black or African-American relative to White) distributions in the PC vs. NPC
groups. Ethnicity differences were not evaluated in statistical testing because there were only 2 Hispanic or Latino subjects. The mean age of the PC (median: 52 years, IQR: 18 years,
range: 19–64 years) and NPC (median: 49 years, IQR: 20 years, range: 20–62 years) groups was similar (_p_ = 0.34, Mann-Whitney test). However, the PC group had a lower (_p_ < 0.001,
Mann–Whitney test) disease duration (median: 5.00 years, IQR: 8.00 years, range: 1–26 years) compared to the NPC group (median: 14.0 years, IQR: 16.0 years, range: 1–38 years). Figure 4
summarizes the mean digital medicine ingestion parameter profiles for the PC and NPC groups. The _p_FS in the PC group was 1 by definition whereas the median _p_FS in the NPC group was 0.5
(IQR = 0.296). The PC sub-group had higher _p_SS, overall OIP (median: 0.927 for PC vs. 0.700 for NPC), and von Mises concentration, as well as lower values of excess dosing event Poisson
_λ_ compared to the NPC group (for _p_-values see Fig. 4). The OIP, _p_FS, von Mises concentration and excess dosing event Poisson _λ_ parameters are consistent with the PC group having a
better overall digital medicine ingestion profile compared to the NPC group. The survival functions of the observed ingestion duration were similar between the two groups (Fig. 4g),
suggesting that the PC group did not arise as a fragment of shorter durations on the system. DISCUSSION Digital medicine systems are providing near real-time access to objective medication
ingestion information,14 enabling physicians and care teams to make more informed treatment decisions: Is medication being taken as prescribed? If there is a lack of clinical improvement, is
medication adherence a factor? Objective digital medicine ingestion data will reduce the reliance on patient and caregiver reports that (psychiatric) care teams consider when addressing
such treatment-related issues. The benefits of this data extend directly to the patient as well by eliminating subjectivity and perceptions of mistrust, both of which have previously
demonstrated correlations with medication adherence in SMI.18 Digital medicine systems have begun to show benefit in clinical outcomes in patients with uncontrolled hypertension and type 2
diabetes.10 Improved patient engagement, effective monitoring, and the ability to make timely interventions were among the key drivers reported associated with the benefit derived from the
digital medicine system. However, clinical efficacy is more challenging to measure in SMI where many of the available medications require weeks to months to elicit meaningful change, and
there are no direct laboratory observations that can be associated with efficacy. In this context, objective data on dosing history may be the best direct measurement to inform clinical
response, as it will enable distinction between patient- and drug-related treatement success factors on a more immediate timescale: Further, the ability to investigate variability in
dose-timing, as well as patterns within periods of successful and unsuccessful dosing intervals will enable more personalized treatment recommendations. In addition to leveraging digital
medicine data within the context of a particular clinical visit or discussion with a patient, the scientific community must now also adopt new statistical frameworks—or re-evaluate and
enhance existing ones—within the context of digital medicine to fully realize the benefits of this data, especially in the SMI patient population. With this in mind, we aimed to adapt and
evaluate the performance of a Bayesian hybrid model to characterize digital medicine ingestion patterns in patients with SMI. Our results suggest that the hybrid Bayesian framework is a
promising approach for characterizing medication ingestion behaviors obtained with a digital medicine system in SMI patients. An observation of particular interest was the presence of a
sub-group of Prompt Corrector (PC) patients who always successfully registered an ingestion following a failed ingestion event: This group comprised 22.1% of our sample. The presence of a
subset with these desirable system characteristics was surprising. Part of our working hypothesis is that PC patients may be individuals who are well organized, follow a well-established
routine for drug administration, and possibly other activities of daily living; however, we also found that more recently diagnosed patients were significantly more likely to be in the PC
group, so there may also be a motivational component. It should be noted that within the current PC definition it is theoretically possible for a patient to take every alternate dose (50%
expected ingestions observed) and still maintain the PC (_p_FS = 1) criteria; however, systematically taking every alternate dose in such a fashion is likely a pre-planned and patterned
choice that requires the patient to be highly conscientious about correcting missed doses and is not inconsistent with the notion of a prompt corrector. In long term dosing, beyond the
currently explored 8-week digital medicine use-case, we acknowledge that the _p_FS = 1 definition of prompt correctors may be too stringent; although as longer-term data sets become
available, there may still be an appropriate _p_FS threshold to classify PC patients with similar characteristics, and the ability to promptly correct missed ingestions. These promising
results in integrative modeling of ingestion patterns from a digital medicine system (DMS) represent a useful first step. However, additional high-resolution temporal data on other biometric
markers such as actimetry and ECG that provide information on rest and activity patterns are also available with this DMS—these data streams could add additional contextual information for
conditioning the priors in the Bayesian modeling framework. The framework is also versatile enough to accommodate distinctive sub-groups (such as the PC patients) by incorporating mixture
models as priors in the Bayesian framework for the parameters. Further, the utility of contextual data outside the current digital medicine system should be evaluated, e.g., wearables and
mobile passive sensing, potentially in conjunction with self-report ecological momentary assessments or brief clinical questionnaires.19,20,21 In conclusion, this work has demonstrated that
a hybrid Bayesian modeling framework is capable of characterizing temporal patterns of successful and unsuccessful ingestion events from a digital medicine system in patients with serious
mental illness. We have also identified immediate next steps and additional opportunities for research in the space. To our knowledge, this modeling framework is among the first to be
applied to digitally acquired medication ingestion data—especially in the SMI population—and opens the door to new research possibilities in the area of medication adherence. METHODS DIGITAL
MEDICINE SYSTEM (DMS) The DMS consists of six primary components: (i) an ingestible event marker (IEM) embedded inside an active pharmaceutical; (ii) a patient-worn patch (on the torso);
(iii) a mobile application; (iv) a secure cloud infrastructure for housing and making data available; (v) a care team portal that is accessible via a web browser; and (vi) a call-center to
provide support to patients and their care teams. The patient-worn patch is designed for 7-days of wear and contains software to detect the IEM after ingestion, as well as a three-axis
accelerometer, electrocardiogram and other sensors. All of the data that is collected from the patch is transmitted to the mobile application and then to the secure cloud infrastructure
where it may be made available to appropriate members of the care team. Figure 1 provides a high-level overview of the DMS system. This digital medicine system requires a patient-worn device
to detect ingestions; however, we do not address the complexity of patch compliance in this work. We define a successful ingestion event as an observed ingestion, and an unsuccessful
ingestion event as an unobserved ingestion. The “observed ingestion duration” is then defined as the elapsed duration between the first and last observed ingestion. As an analogue to overall
adherence, we use the “observed ingestion percent” (OIP), defined as the fraction of ingestions observed within the observed ingestion duration. CLINICAL STUDY DESCRIPTIONS Both of these
studies provided smartphones with the appropriate DMS software pre-loaded and required male and female patients to be on stable, once-daily, doses of oral aripiprazole: It was required that
patients were deemed “capable” of using a DMS. During these studies patients received only the digital versions of their stable oral aripiprazole dose. Further, both studies received human
subject approvals from the appropriate institutional review boards and subjects provided informed consent. Study 1 was a multicenter, 8-week, open-label study with a primary objective of
capturing the usability of the DMS by adult subjects with a diagnosis of schizophrenia with regard to their ability to independently (and successfully) replace their patch by the end of week
8 (NCT02219009). Patients were expected to perform five site visits following the screening period: baseline, and weeks 1, 2, 3, and 8. Study 2 was a multicenter, 8-week, open-label,
single-arm, exploratory trial with a primary objective of assessing the functionality of an integrated call center for the DMS by adult subjects with primary diagnoses of schizophrenia,
major depressive disorder, or bipolar 1 disorder (NCT02722967). This study consisted of two phases: A 2-week prospective phase, and a 6-week observational phase. In order to progress to the
6-week observational phase, patients were required to have at least 50% patch data capture for the 7 days prior to the week 2 visit. Subjects who met this criterion were eligible to continue
into the 6-week observational phase and would be expected to complete four total site visits (baseline and weeks 2, 4, and 8). MODELING DIGITAL MEDICINE INGESTION PROFILES The hybrid Markov
chain-von Mises model has been described in detail elsewhere.12 We recapitulate its key features here for completeness. The individual model consists of four inter-dependent components: *
1. A two-state Markov chain was used to model the occurrence of unobserved ingestions (failures) and observed ingestions (successes). * 2. The ingestion-timing deviations were modeled with a
von Mises distribution. * 3. Observed ingestion duration was modeled with a Weibull distribution. * 4. The frequency of observed excess dosing events was modeled with a Poisson
distribution. MODELING THE TWO-STATE MARKOV CHAIN The short-range dependence of ingestion observations was modeled using a two-state time-homogeneous Markov chain with transition matrix _A_:
$${\boldsymbol{A}} = \begin{array}{*{20}{c}} S \\ F \end{array}\left[ {\begin{array}{*{20}{c}} {p_{SS}} & {p_{SF}} \\ {p_{FS}} & {p_{FF}} \end{array}} \right] =
\begin{array}{*{20}{c}} S \\ F \end{array}\left[ {\begin{array}{*{20}{c}} {p_{SS}} & {1 - p_{SS}} \\ {p_{FS}} & {1 - p_{FS}} \end{array}} \right]$$ The probability of a success
(observed ingestion) following a success at the preceding dosing event was denoted by _p_SS, and the probability of a success following a failure (unobserved ingestion) at the preceding
event was denoted by _p_FS. Maximum-likelihood estimates22 of _p_SS and _p_FS were obtained from _N_SS, _N_FS, _N_FF, and _N_SF, the frequencies of success followed by success, failure
followed by success, failure followed by failure and success followed by failure events, respectively, using: $$\begin{array}{l}\hat p_{SS} = \frac{{N_{SS}}}{{N_{SS} + N_{SF}}}\\ \hat p_{FS}
= \frac{{N_{FS}}}{{N_{FS} + N_{FF}}}\end{array}$$ The transition matrix _A__i_ used for defining the Markov chain normalizes each row of _N__i_ in subject _i_: $${\boldsymbol{A}}_i =
\begin{array}{*{20}{c}} S \\ F \end{array}\left[ {\begin{array}{*{20}{c}} {p_{SS}(i)} & {p_{SF}(i)} \\ {p_{FS}(i)} & {p_{FF}(i)} \end{array}} \right] = \begin{array}{*{20}{c}} S \\ F
\end{array}\left[ {\begin{array}{*{20}{c}} {p_{SS}(i)} & {1 - p_{SS}(i)} \\ {p_{FS}(i)} & {1 - p_{FS}(i)} \end{array}} \right]$$ The parameterization of this model consisted of
hyperbolic functions of two parameters, _s_(_i_) and _σ_(_i_), that underlie the helix-coil transition model in polymer physics,15,16,17 which has been previously explored as a viable model
for adherence modeling.13 $${\boldsymbol{A}}_i = \left[ {\begin{array}{*{20}{c}} {\frac{{s\left( i \right)}}{{1 + s\left( i \right)}}} & {\frac{1}{{1 + s\left( i \right)}}} \\
{\frac{{\sigma (i)s\left( i \right)}}{{1 + \sigma (i)s\left( i \right)}}} & {\frac{1}{{1 + \sigma (i)s\left( i \right)}}} \end{array}} \right]$$ The priors for _s_(_i_) and _σ_(_i_)
were: $$\begin{array}{l}s\left( i \right) = e^{{\mathrm{z}}(i)}\\ z\left( i \right)\sim Normal(a_s,b_s)\\ \sigma (i)\sim Gamma(a_\sigma ,b_\sigma )\end{array}$$ Where z(_i_) is an
intermediate dummy variable. _a__s_ and _b__s_ represent the mean and precision of the normal distribution, respectively, while _a__σ_ and _b__σ_ represent the shape and scale parameters of
the Gamma distribution. MODELING OBSERVED INGESTION-TIMING DEVIATIONS The ingestion-timing deviation of the _i_th ingestion, _δ__i_, was defined as the difference between the actual
ingestion time and the closest expected ingestion time. The probability density function (PDF) of the ingestion-timing deviations _δ_ relative to _τ_ (the dosing interval) after
transformations to angular coordinates, _θ_, are assumed to be distributed according to the von Mises (VM) PDF function VM (_ψ_,_ω_): $$\theta = 2\pi \frac{\delta }{\tau } \sim VM\left(
{\psi ,\omega } \right)$$ The VM distribution describes angular random variables, and its PDF _p_(_θ_) at angular position _θ_ radians is: $$p\left( \theta \right) = \frac{{e^{\omega \ast
cos\left( {\theta - {\mathrm{\psi }}} \right)}}}{{2\pi I_0\left( \omega \right)}}for\,\psi - \pi \le \theta \le \psi + \pi$$ The _ψ_(_i_) is the mean and _ω_(_i_) is a measure of how
concentrated the ingestion-timing deviation angles are around the mean in subject _i_; _I__o_ is the Bessel function of order zero. The R circular statistics package23 was used to obtain
maximum likelihood estimates for _ψ_ and _ω_ for each subject. The prior for the von Mises location parameter _ψ_(_i_) was a von Mises distribution. The prior for the von Mises concentration
parameter _ω_(_i_) was assumed to follow a log-normal distribution. $$\begin{array}{l}\psi (i)\sim vonMises(a_\psi ,b_\psi )\\ \omega (i)\sim LogNormal(a_\omega ,b_\omega )\end{array}$$
Where _a__ψ_ and _b__ψ_ are the same VM parameters as above, and the _a__ω_ and _b__ω_ represent the mean and precision of the log-normal prior, respectively. MODELING OBSERVED EXCESS DOSING
EVENTS In this analysis, an excess dosing event was defined as more than one ingestion observed in a given day for a given patient. The distribution of observed excess dosing events was
modeled with a Poisson distribution. Maximum-likelihood estimation was used to calculate Poisson rate parameter _λ_(_i_) for subject _i_, whose prior in the population was assumed to follow
an exponential distribution with rate parameter _a__λ_: $$\lambda (i)\sim Exponential(a_\lambda )$$ MODELING OBSERVED INGESTION DURATION Observed ingestion duration was defined as the number
of dosing intervals between the first observed ingestion and the last observed ingestion. For once-daily expected dosing, _N_Total[_i_], the total number of prescribed dosing events for the
ingestion duration, would be numerically equivalent to the familiar time-on-treatment for subject _i_. The total number of prescribed dosing events for the observed ingestion duration
_N_Total[_i_] was modeled using a Weibull distribution with shape parameter _υ_ and scale parameter _κ_: $$N_{Total}[i]\sim Weibull\left( {\upsilon ,\kappa } \right)$$ The Weibull density,
_Weibull_(_υ_,_κ_), with shape parameter _υ_ and scale parameter _κ_, is defined with proportional hazards parameterization for a random variable _x_ as: $$Weibull\left( {\upsilon ,\kappa }
\right) = x^{\upsilon - 1}e^{ - (x/\kappa )^\upsilon }$$ The Weibull parameters were estimated using the maximum-likelihood method in Mathematica (Wolfram Research, Champaign, IL). MCMC
modeling was not used because _υ_, the Weibull shape parameter, shows poor mixing.24 MARKOV CHAIN MONTE CARLO IMPLEMENTATION Mathematica (Wolfram Research, Champaign, IL) was used for
estimating individual level parameters. Both SPSS (IBM, Armonk, NY) and the R statistics program were used for exploratory statistical analyses.23,25 Bayesian analysis was conducted using
the well-established Markov Chain Monte Carlo (MCMC) method in the RJAGS software (Martyn Plummer). To allow the MCMC chains to converge we employed a conservative burn-in phase of 50,000
runs before evaluating any statistics. The MCMC algorithm was implemented for 3 chains each with 200,000 runs and thinning interval of 2. The MCMC runs were analyzed with the CODA package.26
Add-on code for analyzing the von Mises distribution in RJAGS was developed by Colin Stoneking and Klaus Oberauer (Department of Cognitive Psychology, University of Zurich, Switzerland).
Convergence and mixing were assessed using multiple approaches. First, visual inspection of parameter trace plots was conducted for evidence of poor mixing. The Gelman-Rubin-Brooks plot,
which shows the evolution of Gelman and Rubin’s shrink factor as the number of iterations increases,27 and the Gelman and Rubin multiple sequence convergence diagnostic were also
examined.27,28,29 The Gelman-Rubin statistic was less than 1.05. For visual predictive checks, the empirical density functions were computed from the histogram data. The density plots from
RJAG simulations were compared to the empirical density functions. Histogram densities were visually overlaid on the estimated density function to obtain a visual reference. The Bayesian
analyses were conducted on a MacBook Pro laptop computer running the OS X Yosemite operating system version 10.10.3. ANALYSES OF THE PROMPT CORRECTOR SUB-GROUP Following the identification
of this sub-group of patients, we defined a patient to be a PC if they exhibited a _p_FS = 1 and as a NPC otherwise. Mann-Whitney tests were used to compare model ingestion-related
parameters of the PC group to those of the NPC group. The frequencies of PC patients in the schizophrenia, bipolar type 1, and major depressive disorder populations of SMI were compared
using the _χ_2 test. The survival functions of the observed ingestion duration were compared using the Kaplan-Meier log-rank test. These analyses were conducted using IBM SPSS Statistics
software (version 24, IBM Corp., Armonk, NY). CODE AVAILABILITY Based on the proprietary nature of modifications made to the code to accommodate the digital medicine data, it may not be made
available in all cases for a period of at least five years from publication. Requests for access to source code must be made on an individual basis to the corresponding author and would
require evaluation on an individual basis. The authors made the appropriate materials available to the editorial staff during the review process for verification of results. DATA
AVAILABILITY Based on the proprietary nature of the data, it may not be made available for a period of at least 5 years from publication. Requests would require evaluation on an individual
basis. The authors made the appropriate materials available to the editorial staff during the review process for verification of results. REFERENCES * Kane, J. M., Kishimoto, T. &
Correll, C. U. Non-adherence to medication in patients with psychotic disorders: epidemiology, contributing factors and management strategies. _World Psychiatry_ 12, 216–226 (2013). Article
Google Scholar * Cutler, D. M. & Everett, W. Thinking outside the pillbox—medication adherence as a priority for health care reform. _N. Engl. J. Med._ 362, 1553–1555 (2010). Article
CAS Google Scholar * Valenstein, M. et al. Antipsychotic adherence over time among patients receiving treatment for schizophrenia: a retrospective review. _J. Clin. Psychiatry_ 67,
1542–1550 (2006). Article Google Scholar * Velligan, D. I., Sajatovic, M., Hatch, A., Kramata, P. & Docherty, J. P. Why do psychiatric patients stop antipsychotic medication? A
systematic review of reasons for nonadherence to medication in patients with serious mental illness. _Patient Prefer. Adherence_ 11, 449–468 (2017). Article Google Scholar * El-Mallakh, P.
& Findlay, J. Strategies to improve medication adherence in patients with schizophrenia: the role of support services. _Neuropsychiatr. Dis. Treat._ 11, 1077–1090 (2015). Article CAS
Google Scholar * Andrade, S. E., Kahler, K. H., Frech, F. & Chan, K. A. Methods for evaluation of medication adherence and persistence using automated databases. _Pharmacoepidemiol.
Drug Saf._ 15, 565–574 (2006). Article Google Scholar * Nau, D. P. _Proportion of Days Covered (PDC) as a Preferred Method of Measuring Medication Adherence_. (Pharmacy Quality Alliance,
Springfield, VA, 2012). * European Medicines Agency. Committee for Medicinal Products for Human Use (CHMP). _Qualification Opinion on Ingestible Sensor System For Medication Adherence as
Biomarker For Measuring Patient Adherence To Medication In Clinical Trials. Background Information as Submitted by the Applicant_. (2016). * Torjensen, I. Devising ways to improve medicines
adherence. _Pharm. J_. 295, 7883 (2015). Google Scholar * Frias, J. et al. Effectiveness of digital medicines to improve clinical outcomes in patients with uncontrolled hypertension and
type 2 diabetes: prospective, open-label, cluster-randomized pilot clinical trial. _J. Med. Internet Res._ 19, e246 (2017). Article Google Scholar * Fellows, K., Stoneking, C. J. &
Ramanathan, M. Bayesian population modeling of drug dosing adherence. _J. Pharmacokinet. Pharmacodyn._ 42, 515–525 (2015). Article CAS Google Scholar * Fellows, K. et al. A hybrid Markov
chain-von Mises density model for the drug-dosing interval and drug holiday distributions. _AAPS J._ 17, 427–437 (2015). Article CAS Google Scholar * Wong, D., Modi, R. & Ramanathan,
M. Assessment of Markov-dependent stochastic models for drug administration compliance. _Clin. Pharmacokinet._ 42, 193–204 (2003). Article Google Scholar * FDA. FDA approves pill with
sensor that digitally tracks if patients have ingested their medication. 2018 (2017). https://www.fda.gov/NewsEvents/Newsroom/PressAnnouncements/ucm584933.htm. Accessed 13 Feb 2019. *
Cantor, C. R., Wollenzien, P. L. & Hearst, J. E. Structure and topology of 16S ribosomal RNA. An analysis of the pattern of psoralen crosslinking. _Nucleic Acids Res._ 8, 1855–1872
(1980). Article CAS Google Scholar * Cantor, C. R. & Schimmel, P. R. _The Behavior of Biological Macromolecules_. (W.H. Freeman, San Francisco, California, USA, 1980). * Zimm, B. H.
& Bragg, J. K. Theory of the phase transition between helix and random coil in polypeptide chains. _J. Chem. Phys._ 31, 526–535 (1959). Article CAS Google Scholar * De Las Cuevas, C.,
de Leon, J., Peñate, W. & Betancort, M. Factors influencing adherence to psychopharmacological medications in psychiatric patients: a structural equation modeling approach. _Patient
Prefer. Adherence_ 11, 681–690 (2017). Article Google Scholar * Barnett, I. et al. Relapse prediction in schizophrenia through digital phenotyping: a pilot study. _Neuropsychopharmacology_
43, 1660–1666 (2018). Article Google Scholar * Onnela, J.-P. & Rauch, S. L. Harnessing smartphone-based digital phenotyping to enhance behavioral and mental health.
_Neuropsychopharmacology_ 41, 1691–1696 (2016). Article Google Scholar * Ghandeharioun, A. et al. Objective assessment of depressive symptoms with machine learning and wearable sensors
data. in _2017 Seventh International Conference on Affective Computing and Intelligent Interaction (ACII)_ 325–332 (IEEE, San Antonio, Texas, USA, 2017). * Rajarshi, M. B. Markov chains and
their extensions. in _Statistical Inference for Discrete Time Stochastic Processes_ 19–38 (Springer, India, 2012). https://doi.org/10.1007/978-81-322-0763-4. * Agostinelli, A. & Lund, U.
_Circular Statistics_ (version 0.4-7) (2013). * Plummer, M. & Eacker, D. _Weibull Model: Problem With Slow Mixing and Effective Sample_. (2015).
http://sourceforge.net/p/mcmc-jags/discussion/610036/thread/d5249e71/. Accessed 13 Feb 2019. * R Core Team. R: _A Language and Environment for Statistical Computing_. R Foundation for
Statistical Computing. (2014). * Plummer, M., Best, N., Cowles, K. & Vines, K. CODA: convergence diagnosis and output analysis for MCMC. _R. News_ 6, 7–11 (2006). Google Scholar *
Brooks, S. P. & Gelman, A. General methods for monitoring convergence of iterative simulations. _J. Comput. Graph. Stat._ 7, 434–455 (1998). Google Scholar * Gelman, A., Carlin, J. B.,
Stern, H. S. & Rubin, D. B. _Bayesian Data Analysis_. _Texts in Statistical Science_. (CRC Press, Boca Raton, Florida, USA, 2004). * Gelman, A. & Rubin, D. B. Inference from
iterative simulation using multiple sequences. _Stat. Sci._ 7, 457–511 (1992). Article Google Scholar * Morosini, P. L., Magliano, L., Brambilla, L., Ugolini, S. & Pioli, R.
Development, reliability and acceptability of a new version of the DSM‐IV Social and Occupational Functioning Assessment Scale (SOFAS) to assess routine social funtioning. _Acta Psychiatr.
Scand._ 101, 323–329 (2000). CAS PubMed Google Scholar Download references ACKNOWLEDGEMENTS The authors would like to acknowledge the support and insight of the Otsuka digital medicine
team. This work was funded by Otsuka Pharmaceutical Development and Commercialization. AUTHOR INFORMATION AUTHORS AND AFFILIATIONS * Otsuka Pharmaceutical Development &
Commercialization, Inc.: 508 Carnegie Center, Princeton, NJ, USA Jonathan Knights, Zahra Heidary & Timothy Peters-Strickland * State University of Buffalo at New York, School of Pharmacy
and Pharmaceutical Sciences, 355 Kapoor Hall, Buffalo, NY, 14214, USA Murali Ramanathan Authors * Jonathan Knights View author publications You can also search for this author inPubMed
Google Scholar * Zahra Heidary View author publications You can also search for this author inPubMed Google Scholar * Timothy Peters-Strickland View author publications You can also search
for this author inPubMed Google Scholar * Murali Ramanathan View author publications You can also search for this author inPubMed Google Scholar CONTRIBUTIONS J.K. drafted the article and
all authors provided comments and revisions. J.K. and T.P.S. were involved in the collection of the clinical data. All authors were involved in the overall design of the project. M.R.
implemented the base Bayesian methodology and executed the analysis. CORRESPONDING AUTHOR Correspondence to Jonathan Knights. ETHICS DECLARATIONS COMPETING INTERESTS J.K, Z.H, and T.P.S. are
all employees of Otsuka Pharmaceutical Development and Commercialization. The remaining author declares no competing interests. ADDITIONAL INFORMATION PUBLISHER’S NOTE: Springer Nature
remains neutral with regard to jurisdictional claims in published maps and institutional affiliations. RIGHTS AND PERMISSIONS OPEN ACCESS This article is licensed under a Creative Commons
Attribution 4.0 International License, which permits use, sharing, adaptation, distribution and reproduction in any medium or format, as long as you give appropriate credit to the original
author(s) and the source, provide a link to the Creative Commons license, and indicate if changes were made. The images or other third party material in this article are included in the
article’s Creative Commons license, unless indicated otherwise in a credit line to the material. If material is not included in the article’s Creative Commons license and your intended use
is not permitted by statutory regulation or exceeds the permitted use, you will need to obtain permission directly from the copyright holder. To view a copy of this license, visit
http://creativecommons.org/licenses/by/4.0/. Reprints and permissions ABOUT THIS ARTICLE CITE THIS ARTICLE Knights, J., Heidary, Z., Peters-Strickland, T. _et al._ Evaluating digital
medicine ingestion data from seriously mentally ill patients with a Bayesian Hybrid Model. _npj Digit. Med._ 2, 20 (2019). https://doi.org/10.1038/s41746-019-0095-z Download citation *
Received: 05 October 2018 * Accepted: 27 February 2019 * Published: 22 March 2019 * DOI: https://doi.org/10.1038/s41746-019-0095-z SHARE THIS ARTICLE Anyone you share the following link with
will be able to read this content: Get shareable link Sorry, a shareable link is not currently available for this article. Copy to clipboard Provided by the Springer Nature SharedIt
content-sharing initiative