- Select a language for the TTS:
- UK English Female
- UK English Male
- US English Female
- US English Male
- Australian Female
- Australian Male
- Language selected: (auto detect) - EN
Play all audios:
ABSTRACT China’s manufacturing industry needs to change from a high-emission model to one that is more environmentally friendly to reduce air pollution and achieve sustainable growth.
Therefore, it is important to decrease manufacturing waste gas emissions by improving green productivity. This paper expands on the theories of green economic growth and sustainable
development to present a framework for analysis of manufacturing green productivity at various levels of air pollution. It applies the Metafrontier Malmquist Luenberger index and SBM model
to data from 30 Chinese manufacturing sectors from 2012 to 2022 to identify the obstacles to developing green productivity in the manufacturing sectors. The results show that: (1) From 2012
to 2022, the overall waste gas emission efficiency and GTFP of China’s manufacturing industry showed an increasing trend. (2) The manufacturing industry with light air pollution had the
fastest growth in GTFP, followed by manufacturing with heavy air pollution, and manufacturing with moderate air pollution had the lowest. (3) The primary driver of GTFP growth is
technological progress, while technical inefficiency has severely hindered GTFP growth. (4) There is a “Matthew effect” in the green productivity of China’s manufacturing industry. High
waste gas emission efficiency often accompanies high levels of GTFP, and vice versa. Finally, this paper proposes policy suggestions to improve the green productivity of the manufacturing
industry and reduce air pollution. SIMILAR CONTENT BEING VIEWED BY OTHERS SMARTER IS GREENER: CAN INTELLIGENT MANUFACTURING IMPROVE ENTERPRISES’ ESG PERFORMANCE? Article Open access 14 April
2025 THE IMPACT OF DIGITAL ECONOMY ON GREEN TOTAL FACTOR PRODUCTIVITY CONSIDERING THE LABOR-TECHNOLOGY-POLLUTION FACTORS Article Open access 21 December 2023 HOW DOES THE DIGITAL ECONOMY
IMPACT GREEN MANUFACTURING: A NEW PERSPECTIVE FROM THE CONSTRUCTION OF A UNIFIED LARGE MARKET IN CHINA Article Open access 21 December 2024 INTRODUCTION As one of the developing countries,
China has experienced frequent air pollution issues with the rapid development of its manufacturing industry1,2,3. Since 2016, China has emphasized the strengthening of air pollution control
in the manufacturing industry, with strict controls on air pollutants such as SO2, NOX, and particulate matter4. However, according to China’s ambient air quality standards, out of 339
cities at and above the prefecture level, 136 failed to meet the standards, accounting for 40.1%5. China has become the largest manufacturing and energy-consuming country in the world,
resulting in increasing waste gas emissions6. In 2023, China’s manufacturing industry contributed 26.2% to GDP and about 30% to global manufacturing output, and added value has accounted for
about 30% of the global total for 14 consecutive years, ranking first in the world7. However, China’s manufacturing industry development has been characterized by heavy air pollution.
Therefore, reducing air pollution and transforming China’s manufacturing development model is crucial. Endogenous growth theory utilizes changes in the level of technological endogenization
to explain productivity changes and their role in promoting economic growth8. Green productivity involves optimizing input factors over time to increase output while reducing waste gas
emissions. It also represents a new economic growth model, stimulating new growth points by leveraging the driving forces of green manufacturing and technologies to promote economic growth
without compromising the environment. In addition, the manufacturing sectors need to improve resource use efficiency during production and reduce emissions at the end of the production
process. Measures such as increased investment in environmental governance aid in shifting production methods towards more environmentally friendly approaches. Essentially, it reflects the
coordinated relationship between economic growth and environmental protection, focusing on increasing manufacturing output and reducing emissions without relying solely on traditional
inputs. Therefore, this paper will be an extension of green economic growth and green development theory to study the green productivity of China’s manufacturing industry under different air
pollution levels. China has concentrated its efforts on reducing air pollution since the 11th Five-Year Plan by focusing on the high-polluting and energy-intensive industries and by
expediting the removal of obsolete industrial capacity. In 2011, the total emissions of SO2 and NOX were included in the restrictive indicator system of the national 12th Five-Year Plan9.
Due to the severe imbalance in the development of various manufacturing sectors in China, there are differences in production technology and emissions in different manufacturing sectors,
leading to heterogeneity in emissions and green production efficiency. Therefore, to enhance the green productivity of China’s manufacturing sectors and reduce air pollution, this paper will
measure the waste gas emission efficiency and the green total factor productivity (GTFP) of China’s manufacturing sectors based on the Metafrontier Malmquist Luenberger index (MML index)
and SBM model. This paper aims to elucidate the trends and disparities in green efficiency across different manufacturing sectors, providing a scientific basis for devising targeted air
pollution control measures. The rest of this paper is organized as follows: It reviews pertinent studies in the section under “Literature Review”. The SBM model and the Metafrontier model
are described in the “Methodology” section. The variables and data sources utilized in the paper are described under “Variables and Data”. Our research on the effectiveness of green
productivity in manufacturing is presented and the findings are analyzed in the “Results” section. The “Discussions” presents an in-depth analysis of the results. The “Conclusion and
Suggestions” section concludes with recommendations for policies aimed at reducing air pollution. LITERATURE REVIEW China’s economic development can no longer rely on the growth of
high-emission, high-pollution industries10. Reducing air pollution is one of the key goals for the green development of China’s manufacturing sectors11. Considering only traditional
production function elements such as capital, labor, and industrial output12,13,14,15 can easily overlook resource inputs and environmental impacts. Incorporating environmental factors into
productivity evaluation is fundamental to assessing the quality of green economic development16,17. Since resource conservation and emission reduction are two major components of sustainable
and green development, neglecting them may mislead the true sustainability of the economy18. As a result, an increasing number of scholars are attempting to integrate resource inputs and
environmental impacts into studies on China’s green productivity19,20,21. Given the emphasis on CO2 emissions in sustainable development research22, many scholars have used CO2 emissions as
undesirable outputs affecting green productivity23,24. However, some studies indicate that SO2 has a greater impact on the ecosystem and people’s lives25. SO2 and NOX are important
industrial waste gases26. With growing attention to the greenhouse effect, scholars have also investigated the comprehensive emission efficiency of both SO2 and CO227. In addition, the
emissions of dust and smoke also represent undesirable outputs that researchers need to focus on28,29. However, studies specifically measuring manufacturing industrial waste gas emission
efficiency in manufacturing are still limited. Research on regional total factor productivity has long been a critical field in analyzing the level of green development in China’s economy30.
However, they often overlook differences in green productivity among various manufacturing industries. Evaluating and comparing green productivity across different manufacturing industries
is more conducive to analyzing gaps in green productivity, reducing air pollution emissions, and promoting the overall green productivity of manufacturing industries31,32. Although many
researchers study green productivity in the manufacturing industry, their focus is mainly on regional or single-industry perspectives. Few consider comparative analyses among similar
manufacturing sectors and their industrial waste gas emissions, which are the main contributors to air pollution. Methods for measuring green productivity mainly focus on parametric and
non-parametric approaches. The most commonly used parametric method is SFA33. Parametric models rely on predetermined functional forms, which can lead to model specification errors34.
Nonparametric methods, do not require assumptions about the functional form of the production function35,36,37,38. The DEA model is based on the calculation of static efficiency and does not
take into account the dynamic changes in efficiency. The ML index, based on DDF, can measure the impact of undesirable outputs on TFP39. However, the radial approach is limited because it
only considers proportional reduction improvements and not slack, which does not correspond to production reality and may overestimate the efficiency of production units. The MML index
effectively addresses the infeasibility of linear programming in the ML index40. Therefore, researchers have applied the meta frontier approach to the traditional Malmquist model to
construct the MML index, which envelops the set of production possibilities for all periods to construct the meta frontier41. To summarize, many researchers who study green productivity are
primarily based on regional and single-industry perspectives, lacking comparative analyses among similar manufacturing sectors. Among the few studies focusing on the green productivity of
different manufacturing sectors, most of them focus on CO2 or SO2 and lack a focus on industrial waste gas emissions, which are major contributors to air pollution. As China’s manufacturing
industry faces serious environmental challenges, improving green productivity is imperative. Therefore, this paper uses the SBM model to measure the green production efficiency of China’s
manufacturing industry. The manufacturing sectors are categorized into three groups according to their levels of air pollution, and their differences are analyzed to identify ways to narrow
the efficiency gap. Finally, through static and dynamic analysis, different manufacturing sectors are classified into different green production types, which provides a basis for the
government to formulate more targeted air pollution prevention and control measures. METHODOLOGY UNDESIRABLE OUTPUT SBM MODEL First, construct a production possibility set that includes
inputs, desirable outputs, and undesirable outputs. Consider a production system with k decision-making units, 𝑛 types of input factors, 𝑞 types of desirable outputs, and b types of
undesirable outputs. The corresponding vectors are defined as follows: \(\:x\in\:{R}_{n}\), \(\:y\in\:{R}_{m}\), \(\:z\in\:{R}_{b}\), defining matrices
\(\:X=\left({x}_{ij}\right)\in\:{R}_{n\bullet\:k}\), \(\:Y=\left({y}_{ij}\right)\in\:{R}_{q\bullet\:k}\), \(\:Z=\left({z}_{ij}\right)\in\:{R}_{b\bullet\:k}\). Assuming X > 0, Y > 0, Z
> 0, that the set of production possibilities satisfies the bounded and closed sets, that desirable outputs and inputs are freely disposable and assuming zero combination of desirable and
undesirable outputs and joint weak disposability of outputs, the model is expressed as:
$$P=\{(x,y,z)\left|\text{x}\right.\geq\text{X}\gamma,\text{y}\leq\text{Y}\gamma,\text{z}=\text{Z}\gamma,\underset{i=1}{\sum^k}\gamma,\gamma\geq0\}$$ (1) In Eq.(1), when
\(\displaystyle\sum_{i=1}^k\gamma=1\), it indicates variable returns to scale. When \(\displaystyle\sum_{i=1}^k\gamma\neq1\), it indicates constant returns to scale. Furthermore, based on
the SBM model proposed by Tone42, the slack variables for inputs and outputs are directly incorporated into the objective function. This approach addresses the issue of slackness in
traditional DEA models for inputs and outputs, as well as the problem of productivity evaluation under undesirable outputs. To measure the production technology efficiency measurement of the
k-th DMU\(x_{ik},\;y_{ik},\;z_{ik}\), the following equation is constructed:
$$min\rho=\frac{1-{\displaystyle\frac1n}{\displaystyle\sum_{i=1}^n}{\displaystyle\frac{s_{{}_i}^-}{x_{ik}}}}{1+{\displaystyle\frac1{q+b}}\left({\displaystyle\sum_{r=1}^q}{\displaystyle\frac{s_r^y}{y_{rk}}}+{\displaystyle\sum_{r=1}^b}{\displaystyle\frac{s_r^z}{z_{rk}}}\right)}$$
(2) $$s.t.\;\left\{\begin{array}{l}x_k=X_\gamma+s^-\\y_k=Y_\gamma+s^y\\z_k=Z_\gamma+s^z\\s^-,\;s^y,\;s^z,\;\gamma\;\geq0\end{array}\right.$$ In Eq.(2), \(\gamma\) is the weight vector,
_s_− represents excessive inputs, sy represents insufficient desirable outputs, and sz represents excessive undesirable outputs. The value of ρ ranges between 0 and 1. If ρ = 1, it
indicates that the DMU does not have excess inputs or undesirable outputs, nor does it have insufficient expected outputs. If ρ < 1 , it indicates that the DMU is inefficient, meaning
that there is a loss of efficiency in the production unit that can be optimized and improved to become efficient by adjusting input and output levels. Let 1- _β__m_ and 1- _β__g_ denote the
efficiency values of the meta frontier and the group frontier, respectively. According to Meng et al.43 and Tugcu et al.44, _β__m_ and _β__g_ can be calculated using the following model:
$$\overrightarrow{D_0}\left(x^t,\;y^t,\;z^t;\;y^t,\;-\;z^t\right)=max\beta^m$$ $$s.t.=\left\{\begin{array}{l}\sum\limits_{t=i}^T\sum\limits_{k=1}^{K_m}\varphi_k^tx_{kn}^t\leq
x_n^t,\;n=1,..,\;N\\\sum\limits_{t=i}^T\sum\limits_{k=1}^{K_m}\varphi_k^ty_{kq}^t\geq\left(1+\beta^m\right)y_q^t,q=1,..,Q\\\sum\limits_{t=i}^T\sum\limits_{k=1}^{K_m}\varphi_k^tz_{kb}^t=\left(1-\beta^m\right)z_b^t,b=1,..,B\\\varphi_k^t\geq0;k=1,...,k_m;t=1,\;...\;,T\end{array}\right.$$
(3) $$\overrightarrow{{D}_{0}}\left({x}^{t},{y}^{t},{z}^{t};{y}^{t},{-z}^{t}\right)=max{\beta }^{g}$$
$$s.t.=\left\{\begin{array}{l}\sum\limits_{t=i}^T\sum\limits_{k=1}^{K_g}\theta_k^tx_{kn}^t\leq
x_n^t,\;n=1,..,\;N\\\sum\limits_{t=i}^T\sum\limits_{k=1}^{K_g}\theta_k^ty_{kq}^t\geq\left(1+\beta^g\right)y_q^t,q=1,..,Q\\\sum\limits_{t=i}^T\sum\limits_{k=1}^{K_g}\theta_k^tz_{kb}^t=\left(1-\beta
g\right)z_b^t,b=1,..,B\\\theta_k^t\geq0;k=1,...,k_m;t=1,\;...\;,T\end{array}\right.$$ (4) In Eq. (3) and Eq. (4), \(\:{K}_{m}\) and \(\:{K}_{g}\)represent the number of DMUs under the meta
frontier and group frontier, respectively. Meanwhile _φ_ and _θ_ represent the intensity variables for DMUs under the meta frontier and the group frontier, respectively. The TGR is defined
as the ratio of the meta frontier efficiency to the group frontier efficiency, \(\:\text{T}\text{G}\text{R}=\frac{1-{{\upbeta\:}}^{\text{m}}}{1-{{\upbeta\:}}^{\text{g}}}\). This value ranges
between [0,1]. The smaller the TGR value, the greater the disparity between them. TGR can only be improved by improving the method of technological progress. Improvements in technical
efficiency do not lead to improvements in TGR. Utilizing the MML index, the production possibility sets across all periods are aggregated to construct the global frontier, as represented by
the following formula: $$P^G\left(x\right)=P^1\left(x^1\right)\cup P^2\left(x^2\right)\dots\cup P^T\left(x^T\right)$$ (5) $$P^t\left(x^t\right)=\left\{{(y}^t,z^t)\vert
x^t\;can\;produce(y^t,z^t)\right\}$$ (6) The model is constructed using the distances between production points in adjacent periods and the meta frontier, thereby mitigating issues related
to arbitrary selections and ensuring the model’s transitivity. The formula is as follows: $${MetaGTFP}_{t-1}^t=\sqrt{\frac{1-\overrightarrow
D_{t-1}^m\left(x^t,y^t,z^t;y^t,{-z}^t\right)}{1-\overrightarrow D_{t-1}^m\left(x^{t-1},y^{t-1},z^{t-1};y^{t-1},{-z}^{t-1}\right)}\times\frac{1-\overrightarrow
D_t^m\left(x^t,y^t,z^t;y^t,{-z}^t\right)}{1-\overrightarrow D_t^m\left(x^{t-1},y^{t-1},z^{t-1};y^{t-1},{-z}^{t-1}\right)}}$$ (7)
$${GroupGTFP}_{t-1}^{t}=\sqrt{\frac{1-{\overrightarrow{D}}_{t-1}^{g}\left({x}^{t},{y}^{t},{z}^{t};{y}^{t},{-z}^{t}\right)}{1-{\overrightarrow{D}}_{t-1}^{g}\left({x}^{t-1},{y}^{t-1},{z}^{t-1};{y}^{t-1},{-z}^{t-1}\right)}\times
\frac{1-{\overrightarrow{D}}_{t}^{g}\left({x}^{t},{y}^{t},{z}^{t};{y}^{t},{-z}^{t}\right)}{1-{\overrightarrow{D}}_{t}^{g}\left({x}^{t-1},{y}^{t-1},{z}^{t-1};{y}^{t-1},{-z}^{t-1}\right)}}$$
(8) \({MetaGTFP}_{t-1}^{t}\) and \({GroupGTFP}_{t-1}^{t}\) denote the levels of GTFP under the meta frontier and the group frontier, respectively. A value greater than 1 indicates an
increase in GTFP, while a value less than 1 indicates a decrease in GTFP. According to Wang et al.45, GTFP can be decomposed as follows:
$$\:{GTFP}_{t-1}^{t}={GEC}_{t-1}^{t}\times\:{GTC}_{t-1}^{t}$$ (9) These indices reflect the state of green production efficiency level (GEC) and green technological change (GTC) in areas
such as management, institutional practices, and economies of scale within the industry. The GTFP index and its decomposition components can be used to analyze trends in different
manufacturing sectors and to provide policy suggestions for improving GTFP based on industry heterogeneity. DATA AND VARIABLES This paper uses panel data from China’s manufacturing sectors
to measure waste gas emission efficiency and GTFP. The analysis covers the period from 2012 to 2022 and uses input-output data from 30 manufacturing sectors. Inputs include labor, capital,
and energy consumption. Labor is measured by the annual average number of employees in large-scale manufacturing enterprises in China, and the unit is ten thousand persons. Capital is
represented by the annual average net value of fixed assets in large-scale manufacturing enterprises, adjusted to 2011 prices using the fixed asset investment price index, and the unit is
billions of yuan. Energy consumption is measured using the coal consumption method for electricity generation in large-scale manufacturing enterprises, and the unit is ten thousand tons of
standard coal. Outputs comprise desirable and undesirable outputs. Desirable output is represented by the value of finished products, adjusted to 2011 prices using the industrial producer
price index, and the unit is billions of yuan. Undesirable outputs include SO2, NOX, and particulate matter emissions, and the unit is tons. The data sources include the China Industrial
Statistical Yearbook, China Energy Statistical Yearbook, China Environmental Statistical Yearbook, and the National Bureau of Statistics of China. Due to the variability of air pollution
levels among different sectors, this study ranks the emission levels of SO2, NOX, and particulate matter from low to high for each industry. The rankings for these three types of waste gas
emissions are then summed to obtain a comprehensive ranking. Based on this ranking, the 30 manufacturing sectors in China are divided into light pollution, moderate pollution, and heavy
pollution groups, as shown in Table 1 Descriptive statistics of variables are shown in Table 2. RESULTS META FRONTIER MANUFACTURING WASTE GAS EMISSIONS EFFICIENCY The meta frontier
efficiency in this paper refers to how far the different sectors in each period are from the frontier surface constructed for all sectors in all periods. Table 3 shows that between 2012 and
2022, the waste gas emission efficiency of the manufacturing industry increased from 0.25 to 0.47, with an overall growth rate of 88.00%. Furthermore, this growth was more rapid between 2018
and 2022, with emission efficiency rising from 0.28 to 0.47, marking an overall growth rate of 67.85%. This is mainly due to the government’s strict limits on SO2, NOX, and particulate
matter emissions from the manufacturing sector after 2018. Meanwhile, in 2022, sectors such as Tobacco, Culture, Electrical Equipment, Measuring Instruments, Fibers, Special Machinery, and
Medicines had a waste gas emission efficiency of 1, indicating that these sectors reached the efficiency frontier with an optimal combination of inputs and outputs. On average, from 2012 to
2022, Tobacco had the highest emission efficiency at 0.73, followed by Culture at 0.50 and Medicines at 0.50. Tobacco and Culture sectors have lower emissions, while the pharmaceutical
industry has high technological input and stringent requirements for waste gas emission control, resulting in higher emission efficiency. Although most of the sectors showed growth, Repair,
Nonmetal Ma. and Printing are far from the meta frontier and require the attention of the government. GROUP FRONTIER MANUFACTURING WASTE GAS EMISSIONS EFFICIENCY Table 4 shows that the
grouping results narrow the differences in input-output structures across various sectors, indicating a relatively reasonable grouping. In the light pollution group, emission efficiency
increased from 0.27 to 0.55, representing an overall growth rate of 103.70%. In the moderate pollution group, emission efficiency grew from 0.35 to 0.74, with an overall growth rate of
111.43%. In the heavy pollution group, emission efficiency increased from 0.36 to 0.60, showing an overall growth rate of 66.67%. Under the group frontiers, emission efficiency improved to
varying degrees in all three groups. The gap between group frontiers and meta frontier highlights the significant advantages of sectors in terms of input-output structures and emission
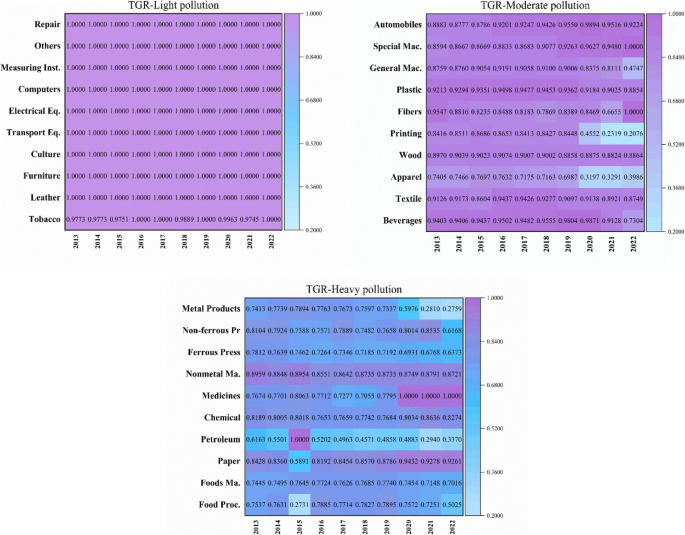
control. There is a greater need to strengthen the investment in industrial emission treatment technologies. TGR Figure 1 shows that the TGR for light air pollution sectors approaches 1,
indicating that these sectors are closer to the optimal technology frontier. Moderate air pollution sectors have the next highest TGR, while heavy air pollution sectors are farthest from the
optimal technology frontier. Therefore, technological advancement and improvement in technical efficiency are crucial for moderate and heavy air pollution sectors. This gap is inherent in
the technology itself and cannot be fully bridged through efficiency alone. In practice, it is necessary to stimulate technological innovation through talent recruitment, resource
allocation, and policy support, to fundamentally reduce the technical gap in these sectors. GTFP Table 5 shows that the annual average GTFP (Wmean) grew from 0.7433 to 1.2045. The annual
geometric mean GTFP (Gmean) from 2012 to 2022 is 1.0675, which means that the annual average growth rate is 6.75%. The GTFP of the light air pollution manufacturing sectors grew the fastest
with an average annual growth rate of 7.12%, followed by the heavy air pollution manufacturing sectors with an average annual growth rate of 6.82%, and the moderate air pollution
manufacturing sectors with an average annual growth rate of 5.88%. The GTFP growth of the light air pollution manufacturing industry contributes the most to the GTFP growth of the whole
manufacturing industry. The rapid growth of GTFP in the heavy pollution industry stems from the Government’s restriction and control of emissions from heavy air pollution sectors. As shown
in Table 6 and Fig. 2, the GTFP is greater than 1 in all years except 2013 (0.7433) and 2016 (0.9693). From 2012 to 2022, the decomposition terms of GTFP in China’s manufacturing industry
show positive impacts, with the annual average value of GTC being 1.0915 and that of GEC being 1.0548. The GEC of China’s manufacturing industry is greater than 1 in every year except for
2014 (0.8611), 2017 (0.9097), and 2020 (0.9638). GTC is greater than 1 in all years except 2013 (0.8042), 2015 (0.9821) and 2019 (0.9898). Both contribute to GTFP and fluctuate around GTFP
in the time-varying trend. Therefore, the Chinese government should continuously promote technological progress and improve technical efficiency. The results in Fig. 3 show the differences
in GTFP and its decomposition terms for manufacturing sectors between the meta frontier and group frontier. In the light air pollution sectors, the results of both frontiers calculations
largely converge and mGTFP is the highest among the three groups. This proves that the level of manufacturing GTFP under the meta frontier mainly originates from the light pollution
industry. The fluctuations of mGTFP, mGEC, and mGTC under the meta frontier are larger than those calculated under the group frontier in the heavy pollution industry and the moderate
pollution industry, which illustrates the necessity of considering heterogeneity. Meanwhile, mGTFP under the group frontier is higher than that calculated under the meta frontier, a
difference that is more due to the difference in GEC. The difference in technical efficiency of different sectors leads to the gap in GTFP between moderate and heavy pollution sectors.
China’s air pollution control policies are often targeted at some heavy pollution sectors, resulting in insufficient attention to some moderate pollution sectors. As shown in Figs. 4 and 5,
the geometric means of GTFP (g-GTFP) in the manufacturing sectors are mostly greater than 1, indicating that green productivity is growing in most sectors. There are differences in GTFP and
its decomposition terms across sectors between the meta frontier and group frontier. Under the meta frontier, Measuring Instruments (1.1417) exhibit the fastest GTFP growth, followed by
Medicines (1.1357) and Beverages (1.1157). Under the group frontiers, Printing (1.1893) shows the highest GTFP growth, followed by Beverages (1.1473) and Measuring Instruments (1.1417). The
increase in industry GTFP is primarily driven by technological progress. Therefore, the government should target to strengthen the development of green technology in those manufacturing
sectors. STATIC AND DYNAMIC EFFICIENCY Combining static and dynamic efficiency analyses can reveal the strengths and weaknesses of each industry in air pollution control, providing more
targeted evidence for government policy-making. Using the waste gas emission efficiency as the X-axis and their group-specific GTFP dynamic efficiency as the Y-axis, the mean values (0.3439,
1.0608) are used as the intersection point. This approach divides the static and dynamic efficiency levels of each industry into four quadrants, with each industry’s performance represented
by a scatter point. In Fig. 6, manufacturing sectors in Quadrant I are classified as “Best Performers”. These sectors exhibit both static and dynamic efficiencies above the manufacturing
average, serving as models for promoting green development in manufacturing. Quadrant II sectors are classified as “Potential Performers”. These manufacturing sectors have static
efficiencies below the manufacturing average but dynamic efficiencies above them, indicating relatively low efficiency but rapid growth and significant potential for future improvement.
Quadrant III manufacturing sectors are classified as “Lagging Performers”. These manufacturing sectors have both static and dynamic efficiencies below the manufacturing average, putting them
in a relatively disadvantageous position. Without effective measures to stimulate their potential for improvement and promote green transformation, the gap between these sectors and more
advanced ones will likely widen. Quadrant IV sectors are classified as “Advanced Performers”. These sectors have static efficiencies above the manufacturing average but dynamic efficiencies
below them, indicating high efficiency but relatively slow growth. There is a need for enhanced air pollution control efforts for these sectors. From the classification results, the majority
of manufacturing industries fall into the “Best Performers” and “Lagging Performers” categories, showing a polarization trend to some extent. The “Matthew Effect” is gradually emerging,
suggesting that the gap between these two types of sectors may further widen. DISCUSSIONS * (1) The waste gas emission efficiency in the manufacturing industry showed a growth trend during
the study period, especially a rapid increase after 2018. This growth is closely related to the strict regulation of SO₂, NOx, and particulate matter emissions after 2018. TGR results show
the light air pollution group achieves technical leadership, reflecting the optimal combination of inputs and outputs under strict emission control, leading to efficient resource
utilization. This result provides evidence for the environmental governance effects driven by policies in recent years. The mandatory government regulations on pollution emissions have
improved waste gas emission efficiency. * (2) Moderate air pollution manufacturing sectors have the lowest growth rate in GTFP. In contrast, light air pollution manufacturing sectors show
faster GTFP growth, mainly benefiting from relatively lower pollution levels and higher technological capabilities. These tend to have high resource efficiency and a strong technological
foundation, enabling GTFP improvements through market mechanisms or innovation with minimal policy pressure. On the other hand, heavy air pollution sectors have been subject to long-term
stringent environmental policies, especially concerning the emission of SO₂, NOx, and particulates. These policies have forced manufacturing sectors to innovate and improve production
processes. The implementation of these policies has driven significant investment in green technologies, allowing the GTFP growth of heavy air pollution manufacturing sectors to remain at a
relatively high level. However, moderate air pollution manufacturing sectors have neither the technological advantages nor the policy attention. This “policy gap” has resulted in
insufficient motivation for moderate air pollution manufacturing sectors to improve their technology and reduce emissions, leading to a lack of external drivers for accelerating GTFP growth.
* (3) The primary driver of GTFP growth is technological progress. And technical inefficiency has severely hindered GTFP growth. Under government regulation, China’s manufacturing sectors
have gradually adopted more environmentally friendly production processes and increased investments in green technology. The dual drivers of policy guidance and market demand have led to
significant progress in technological advancement. This is particularly evident in manufacturing sectors with strict regulatory controls where technological advancements have played a
crucial role in reducing emissions. Technical inefficiency may result from many manufacturing sectors failing to fully utilize existing technological resources and production factors,
leading to resource waste and increased environmental burdens. * (4) Green manufacturing productivity development relies not only on government regulation but also on internal technological
innovation capabilities and resource allocation efficiency. The “Matthew Effect” of green productivity in China’s manufacturing industry shows that the stronger the resource and
technological advantages of a manufacturing industry, the higher its initial efficiency level will be. And it will be further consolidated through the advancement of technology. Outstanding
manufacturing sectors benefit from a strong technological foundation, low pollution levels, and government support for funding. These sectors have continuously optimized their input-output
structures, excelling in both static and dynamic efficiency, becoming models for the green productivity development of manufacturing. Lagging manufacturing industries suffer from low
technological efficiency, insufficient innovation capacity, and a lack of investment, preventing them from effectively improving green productivity. These sectors often face resource
constraints and lack sufficient capital and technical support, causing them to fall behind in both static and dynamic efficiency, and thus require special government attention. CONCLUSIONS
AND POLICY SUGGESTIONS Based on the SBM model and MML index, this paper examines the static waste gas emission efficiency and dynamic GTFP growth rate of 30 manufacturing sectors in China
under the constraint of undesirable outputs. (1) There was an improving trend from 2012 to 2022 in China’s manufacturing industry’s GTFP and waste gas emission efficiency. (2) The
manufacturing industry with light air pollution had the fastest growth in GTFP, followed by manufacturing with heavy air pollution, and manufacturing with moderate pollution had the lowest.
(3) Technical advancement is the main factor driving GTFP growth in China’s manufacturing sectors. Meanwhile, technical inefficiency has significantly impeded GTFP growth. (4) China’s
manufacturing industry’s green productivity exhibits a “Matthew effect.” High GTFP levels are frequently correlated with high waste gas emission efficiency, and vice versa. Based on the
above conclusions, this paper proposes the following policy suggestions: * (1) The government should pay attention to the “policy gaps” in moderate pollution manufacturing sectors by
enhancing innovation capacity through subsidies, policy incentives, and technological cooperation. A targeted technological renovation plan should be developed for these sectors, with
financial support to encourage the adoption of advanced environmentally friendly production processes, improve resource utilization efficiency, and reduce waste gas emissions. * (2) There
remains significant potential to mitigate air pollution by enhancing the GTFP of China’s manufacturing industry. Currently, the growth of GTFP in China’s manufacturing industry has a solid
foundation of technological progress. In the future, while maintaining progress driven by technological advancements, emphasis should be placed on improving technological efficiency to
ensure that sectors effectively utilize existing technological resources, reduce waste and pollution, and optimize resource allocation. * (3) To address the “Matthew effect”, the government
should promote the establishment of cross-industry collaboration mechanisms led by technologically advanced industries. By encouraging technology transfer and providing technical consulting
services, leading manufacturing sectors can offer support to lagging sectors. This can be achieved by setting up cross-sector technology cooperation funds and awarding prizes for technology
transfer, incentivizing high-tech sectors to share environmentally friendly processes and management experience with lower-tech sectors. Although this paper provides an analysis of waste gas
emission efficiency and GTFP in China’s manufacturing industry, it still has certain limitations. On the one hand, this paper does not account for the impact of significant events such as
the COVID-19 pandemic during the study period on green productivity in manufacturing. The long-term effects of the pandemic may have varied impacts on manufacturing sectors, which warrants
further exploration and validation in future research. On the other hand, this paper does not consider potential external factors such as geopolitical shifts and international trade, which
could have a considerable influence on the green productivity of manufacturing in the long run. Therefore, while the conclusions and policy suggestions in this paper are instructive, they
require further verification and expansion within a broader context and over a longer time frame in future research. DATA AVAILABILITY The data used in this study are publicly available and
can be obtained by contacting the corresponding author. REFERENCES * Landrigan, P. J. Air pollution and health. _Lancet Public. Health_. 2, e4–e5 (2017). Article PubMed Google Scholar *
Sun, C., Yuan, X. & Yao, X. Social acceptance towards the air pollution in China: evidence from public’s willingness to pay for smog mitigation. _Energy Policy_. 92, 313–324 (2016).
Article Google Scholar * Song, M., Wang, S. & Zhang, H. Could environmental regulation and R&D tax incentives affect green product innovation? _J. Clean. Prod. _258, 120849 (2020).
* Law of the People’s Republic of China on the Prevention and Control of Atmospheric Pollution. (2018). https://www.mee.gov.cn/ywgz/fgbz/fl/201811/t20181113_673567.shtml Accessed 22 July
2024. * China Ecological Environment Status Bulletin. (2023). https://www.mee.gov.cn/hjzl/sthjzk/zghjzkgb/index.shtml. Accessed 22 July 2024. * Qu, Y., Li, J. & Wang, S. Green total
factor productivity measurement of industrial enterprises in Zhejiang Province, China: a DEA model with undesirable output approach. _Energy Rep. _8, 307–317 (2022). Article Google Scholar
* Ministry of Industry and Information Technology of the People’s Republic of China. (2024). https://www.miit.gov.cn/xwdt/gxdt/ldhd/art/2024/art_f4030a7c8a354c12abf9d30565265a6c.html
Accessed 22 July 2024. * Romer, P. M. Increasing returns and Long-Run Growth. _J. Polit Econ. _94, 1002–1037 (1986). Article Google Scholar * Energy Conservation and Emission Reduction
during the 12th Five Year Plan Period. (2011). https://www.mee.gov.cn/ywdt/hjnews/201109/t20110928_217816.shtml Accessed 22 July 2024. * Xu, Y. & Deng, H. Green total factor productivity
in Chinese cities: measurement and causal analysis within a new structural economics framework. _J. Innov. Knowl. _7, 100235 (2022). Article Google Scholar * Guo, B., Feng, W. & Lin,
J. The effect of industrial upgrading on energy consumption. _Energy Strategy Rev. _54, 101451 (2024). Article Google Scholar * Färe, R., Grosskopf, S., Norris, M., Zhang, Z. P. &
Growth Technical Progress, and Efficiency Change in Industrialized Countries. _Am. Econ. Rev. _84, 66–83 (1994). Google Scholar * Wu, Y. Has Productivity contributed to China’s growth?
_Pac. Econ. Rev. _8, 15–30 (2003). Article Google Scholar * Coelli, T. J. & Rao, D. S. P. Total factor productivity growth in agriculture: a Malmquist index analysis of 93 countries,
1980–2000. _Agric. Econ. _32, 115–134 (2005). Article Google Scholar * Chen, P. C., Yu, M. M., Chang, C. C. & Hsu, S. H. Total factor productivity growth in China’s agricultural
sector. _China Econ. Rev. _19, 580–593 (2008). Article Google Scholar * Sheng, J. & Gao, Y. Combining the financial development and stock market return for green economic recovery in
selected developing economies. _Econ. Change Restruct. _56, 3885–3908 (2023). Article Google Scholar * Wang, J., Ma, M., Dong, T. & Zhang, Z. Do ESG ratings promote corporate green
innovation? A quasi-natural experiment based on SynTao Green Finance’s ESG ratings. _Int. Rev. Financ Anal. _87, 102623 (2023). Article Google Scholar * Chen, S. & Golley, J. Green’
productivity growth in China’s industrial economy. _Energy Econ. _44, 89–98 (2014). Article Google Scholar * Emrouznejad, A. & Yang, G. A survey and analysis of the first 40 years of
scholarly literature in DEA: 1978–2016._ Socioecon. Plann. Sci. _61, 4–8 (2018). * Yang, W., Shi, J., Qiao, H., Shao, Y. & Wang, S. Regional technical efficiency of Chinese Iron and
steel industry based on bootstrap network data envelopment analysis. _Socioecon Plann. Sci. _57, 14–24 (2017). Article Google Scholar * Yang, Z., Fan, M., Shao, S. & Yang, L. Does
carbon intensity constraint policy improve industrial green production performance in China? A quasi-DID analysis. _Energy Econ. _68, 271–282 (2017). Article Google Scholar * Guo, B.,
Feng, Y., Lin, J. & Wang, X. New energy demonstration city and urban pollutant emissions: an analysis based on a spatial difference-in-differences model. _Int. Rev. Econ. Finance_. 91,
287–298 (2024). Article Google Scholar * Zhang, N., Zhou, P. & Kung, C. C. Total-factor carbon emission performance of the Chinese transportation industry: a bootstrapped non-radial
Malmquist index analysis. _Renew. Sustain. Energy Rev. _41, 584–593 (2015). Article CAS Google Scholar * Emrouznejad, A. & Yang, G. A framework for measuring global
malmquist–luenberger productivity index with CO2 emissions on Chinese manufacturing industries. _Energy_. 115, 840–856 (2016). Article CAS Google Scholar * Xia, X. et al. The Association
between Air Pollution and Population Health risk for respiratory infection: a case study of Shenzhen, China. _Int. J. Environ. Res. Public. Health_. 14, 950 (2017). Article PubMed PubMed
Central Google Scholar * Miao, Z., Baležentis, T., Shao, S. & Chang, D. Energy use, industrial soot and vehicle exhaust pollution—China’s regional air pollution recognition,
performance decomposition and governance. _Energy Econ. _83, 501–514 (2019). Article Google Scholar * Xie, R., Fu, W., Yao, S. & Zhang, Q. Effects of financial agglomeration on green
total factor productivity in Chinese cities: insights from an empirical spatial Durbin model. _Energy Econ. _101, 105449 (2021). Article Google Scholar * Tao, F., Zhang, H., Hu, J. &
Xia, X. H. Dynamics of green productivity growth for major Chinese urban agglomerations. _Appl. Energy_. 196, 170–179 (2017). Article ADS Google Scholar * Wang, K. L., Pang, S. Q., Ding,
L. L. & Miao, Z. Combining the biennial malmquist–luenberger index and panel quantile regression to analyze the green total factor productivity of the industrial sector in China. _Sci.
Total Environ. _739, 140280 (2020). Article PubMed CAS Google Scholar * Wang, M. & Feng, C. Regional total-factor productivity and environmental governance efficiency of China’s
industrial sectors: a two-stage network-based super DEA approach. _J. Clean. Prod. _273, 123110 (2020). Article Google Scholar * Pérez, K., González-Araya, M. C., & Iriarte, A. Energy
and GHG emission efficiency in the Chilean manufacturing industry: Sectoral and regional analysis by DEA and Malmquist indexes. _Energy Econ. _66, 290–302 (2017). * Zhu, X., Li, H., Chen, J.
& Jiang, F. Pollution control efficiency of China’s iron and steel industry: evidence from different manufacturing processes. _J. Clean. Prod. _240, 118184 (2019). Article Google
Scholar * Wang, H., Cui, H. & Zhao, Q. Effect of green technology innovation on green total factor productivity in China: evidence from spatial durbin model analysis. _J. Clean. Prod.
_288, 125624 (2021). Article Google Scholar * Gong, B. H. & Sickles, R. C. Finite sample evidence on the performance of stochastic frontiers and data envelopment analysis using panel
data. _J. Econom_. 51, 259–284 (1992). Article Google Scholar * Shi, X. & Li, L. Green total factor productivity and its decomposition of Chinese manufacturing based on the MML
index:2003–2015. _J. Clean. Prod. _222, 998–1008 (2019). Article Google Scholar * Wen, J., Wang, H., Chen, F. & Yu, R. Research on environmental efficiency and TFP of Beijing areas
under the constraint of energy-saving and emission reduction. _Ecol. Indic. _84, 235–243 (2018). Article Google Scholar * Baležentis, T. & Sun, K. Measurement of technical inefficiency
and total factor productivity growth: a semiparametric stochastic input distance frontier approach and the case of Lithuanian dairy farms. _Eur. J. Oper. Res. _285, 1174–1188 (2020).
Article MathSciNet Google Scholar * Gao, Y., Zhang, M. & Zheng, J. Accounting and determinants analysis of China’s provincial total factor productivity considering carbon emissions.
_China Econ. Rev. _65, 101576 (2021). Article Google Scholar * Chung, Y. H., Färe, R. & Grosskopf, S. Productivity and undesirable outputs: a directional Distance function Approach.
_J. Environ. Manage. _51, 229–240 (1997). Article Google Scholar * Pastor, J. T. & Lovell, C. A. K. A global Malmquist productivity index. _Econ. Lett. _88, 266–271 (2005). Article
MathSciNet Google Scholar * Oh, D. A global Malmquist-Luenberger productivity index. _J. Prod. Anal. _34, 183–197 (2010). Article Google Scholar * Tone, K. A slacks-based measure of
efficiency in data envelopment analysis. _Eur. J. Oper. Res. _130(3), 498–509 (2001). * Meng, F., Su, B. & Wang, Q. Meta-frontier-based assessment on carbon emission performance
considering different mitigation strategies: evidence from China’s manufacturing sectors. _J. Clean. Prod. _289, 125662 (2021). Article CAS Google Scholar * Tugcu, C. T. & Tiwari, A.
K. Does renewable and/or non-renewable energy consumption matter for total factor productivity (TFP) growth? Evidence from the BRICS. _Renew. Sustain. Energy Rev. _65, 610–616 (2016).
Article Google Scholar * Wang, Q., Zhang, H., Zhang, W. A. & Malmquist CO 2 emission performance index based on a metafrontier approach. _Math. Comput. Model. _58, 1068–1073 (2013).
Article Google Scholar Download references AUTHOR INFORMATION AUTHORS AND AFFILIATIONS * School of Law, Humanities and Sociology, Wuhan University of Technology, Wuhan, 430070, Hubei,
China Jieming Liu * School of Economics, Wuhan University of Technology, Wuhan, 430070, Hubei, China Man Yu Authors * Jieming Liu View author publications You can also search for this author
inPubMed Google Scholar * Man Yu View author publications You can also search for this author inPubMed Google Scholar CONTRIBUTIONS Conceptualization, J. L. and M. Y.; methodology and data,
M. Y.; analysis, M. Y.; writing, J. L. and M. Y.; review and editing, J. L. CORRESPONDING AUTHOR Correspondence to Man Yu. ETHICS DECLARATIONS COMPETING INTERESTS The authors declare no
competing interests. ADDITIONAL INFORMATION PUBLISHER’S NOTE Springer Nature remains neutral with regard to jurisdictional claims in published maps and institutional affiliations. RIGHTS AND
PERMISSIONS OPEN ACCESS This article is licensed under a Creative Commons Attribution-NonCommercial-NoDerivatives 4.0 International License, which permits any non-commercial use, sharing,
distribution and reproduction in any medium or format, as long as you give appropriate credit to the original author(s) and the source, provide a link to the Creative Commons licence, and
indicate if you modified the licensed material. You do not have permission under this licence to share adapted material derived from this article or parts of it. The images or other third
party material in this article are included in the article’s Creative Commons licence, unless indicated otherwise in a credit line to the material. If material is not included in the
article’s Creative Commons licence and your intended use is not permitted by statutory regulation or exceeds the permitted use, you will need to obtain permission directly from the copyright
holder. To view a copy of this licence, visit http://creativecommons.org/licenses/by-nc-nd/4.0/. Reprints and permissions ABOUT THIS ARTICLE CITE THIS ARTICLE Liu, J., Yu, M. Analysis of
green productivity in manufacturing based on different air pollution levels. _Sci Rep_ 14, 23817 (2024). https://doi.org/10.1038/s41598-024-74845-z Download citation * Received: 07 August
2024 * Accepted: 30 September 2024 * Published: 11 October 2024 * DOI: https://doi.org/10.1038/s41598-024-74845-z SHARE THIS ARTICLE Anyone you share the following link with will be able to
read this content: Get shareable link Sorry, a shareable link is not currently available for this article. Copy to clipboard Provided by the Springer Nature SharedIt content-sharing
initiative KEYWORDS * Manufacturing * Air pollution * Waste gas emission * Green total factor productivity (GTFP) * SBM model * Metafrontier Malmquist Luenberger index