- Select a language for the TTS:
- UK English Female
- UK English Male
- US English Female
- US English Male
- Australian Female
- Australian Male
- Language selected: (auto detect) - EN
Play all audios:
ABSTRACT Diabetic peripheral neuropathy (DPN) is characterized by spontaneous pain in the extremities. Incidence of DPN continues to rise with the global diabetes epidemic. However, there
remains a lack of safe, effective analgesics to control this chronic painful condition. Dorsal root ganglia (DRG) contain soma of sensory neurons and modulate sensory signal transduction
into the central nervous system. In this study, we aimed to gain a deeper understanding of changes in molecular pathways in the DRG of DPN patients with chronic pain. We recently reported
transcriptomic changes in the DRG with DPN. Here, we expand upon those results with integrated metabolomic, proteomic, and phospho-proteomic analyses to compare the molecular profiles of DRG
from DPN donors and DRG from control donors without diabetes or chronic pain. Our analyses identified decreases of select amino acids and phospholipid metabolites in the DRG from DPN
donors, which are important for cellular maintenance. Additionally, our analyses revealed changes suggestive of extracellular matrix (ECM) remodeling and altered mRNA processing. These
results reveal new insights into changes in the molecular profiles associated with DPN. SIMILAR CONTENT BEING VIEWED BY OTHERS TRANSCRIPTOMIC ANALYSIS OF HUMAN SENSORY NEURONS IN PAINFUL
DIABETIC NEUROPATHY REVEALS INFLAMMATION AND NEURONAL LOSS Article Open access 18 March 2022 ELEVEN NEUROLOGY-RELATED PROTEINS MEASURED IN SERUM ARE POSITIVELY CORRELATED TO THE SEVERITY OF
DIABETIC NEUROPATHY Article Open access 24 July 2024 SCRNA-SEQ GENERATES A MOLECULAR MAP OF EMERGING CELL SUBTYPES AFTER SCIATIC NERVE INJURY IN RATS Article Open access 19 October 2022
INTRODUCTION Chronic pain is a growing health burden, impacting an estimated 20% of adults in the United States1. Among chronic pain cases, an estimated 25% can be attributed to neuropathic
pain2. A common painful neuropathic condition is Diabetic Peripheral Neuropathy (DPN), which is caused by Diabetes Mellitus (DM). Type II Diabetes Mellitus (T2D) is an epidemic that affects
462 million people globally, a number expected to grow markedly, with 50% of patients developing DPN3,4,5. DPN is defined as a length-dependent sensorimotor polyneuropathy. DPN is associated
with hyperglycemic pathology as well as hyperlipidemia; however, a mechanism of DPN development remains unclear5,6,7. DPN typically manifests in a ‘stocking and glove’ pattern in which
patients’ lower limbs are most affected, consistent with disease of long sensory neurons. Additionally, DPN is associated with axonal demyelination and degeneration leading to nerve
dysfunction and possible cell death8. Exponential growth in the diabetes epidemic and a lack of an effective curative treatment for DPN make it increasingly imperative to gain insights into
the mechanisms of disease progression2,9,10. Dorsal root ganglia (DRG) contain the cell bodies of peripheral sensory neurons that relay pain from the periphery to the central nervous
system11. It is well established that transcriptomic changes occur in DRG in response to injury and in association with neuropathic pain development11. Our previously published mRNA
sequencing (RNA-seq) study suggested an association between DPN, increased expression of immune-related genes, and decreased expression of neuronal genes in the human DRG12. However, due to
translational and post-translational regulation, expression of a specific mRNA is not a perfect indicator of the abundance of the corresponding protein, especially in the context of
neurological dysfunction13,14,15,16,17,18. Despite this, to the best of our knowledge, no study to date has explored translational and post-translational regulation in human DRG. Protein
abundance and post-translational modifications (PTM) are central to cellular function, but easily deregulated in response to physiological changes19. Phosphorylation is an important PTM upon
which many cellular processes are reliant. Additionally, metabolites can be influenced directly by endogenous and exogenous factors and are direct players in biochemical processes, thus
offering a strong descriptor of molecular phenotype. A few studies have identified metabolomic and proteomic trends suggestive of disrupted energy metabolism and mitochondrial function in
DRG of diabetic rodents20,21,22,23. Better understanding of molecular regulation with painful conditions in human systems is vital for development of novel therapeutics24. Therefore, we
aimed to integrate previous transcriptomic findings12 with metabolomic, proteomic, and phospho-proteomic data to offer a comprehensive understanding of the biochemical changes associated
with DPN in human DRG. Presently, we profiled small molecular weight metabolites and lipids, as well as proteins and phospho-peptides in human DRG samples from DPN donors and non-diabetic
controls. We identified decreased amino acids and phospholipid metabolites, as well as alterations in abundance of extracellular matrix (ECM) proteins and phosphorylation of RNA binding
proteins. From this, we suggest a role of disrupted amino acid and protein metabolism in the development of DPN. RESULTS TISSUE DONOR COHORT CHARACTERISTICS For metabolomic analysis, DRG
were obtained from 7 DPN donors and 10 non-diabetic control donors. For proteomic and phospho-proteomic analyses, DRG were obtained from 5 DPN donors and 5 non-diabetic control donors.
Within both cohorts of donors, no significant differences were observed between donor groups in age, sex, or BMI (Table 1). A significant difference was observed in donors on ACE inhibitors
in the metabolomic cohort, but no ACE inhibitor metabolites were detected in our analysis25. A non-significant trend was observed in differences in age in our metabolomic cohort, this was
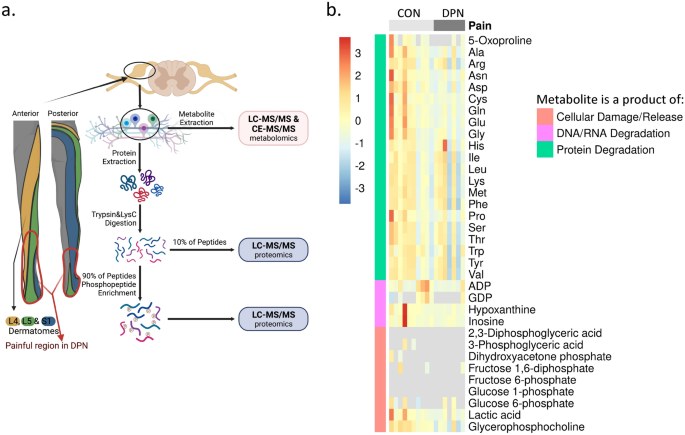
addressed in our statistical analysis of metabolite data. Post-mortem tissue donation networks offer the best opportunity for analyses of human DRGs. L4, L5, and S1 DRGs were obtained as
these ganglia contain the primary afferent neurons that innervate the distal extremities of the foot where patients with DPN often experience pain (Fig. 1a). Donor medical history confirms
neuropathy for 10 years or more in the DPN cohort as observed from the available timeline. However, with current limitations in obtaining human DRG26, we were unable to obtain detailed
clinical measures of pain hypersensitivity in DRG donors. We have earlier reported pathological evaluation of DRG tissues from the DPN and control donors showing variation in pathology in
both donor groups12. As reported earlier12, within the non-diabetic control group, pathology ranges from apparently normal tissue to moderate ganglionic cell loss, whereas within the DPN
group, pathology ranges from apparently normal tissue to moderate to severe ganglionic cell loss. For our present study, profiles of protein, DNA, and RNA degradation products as well as
indicators of cellular damage were evaluated to characterize tissue quality (Fig. 1b). Abundance of these degradation products would be abnormally high if tissues were poorly handled or
stored. We do note that one sample has exceptionally high levels of hypoxanthine, inosine, and certain amino acids (Fig. 1b). A second sample is noted to have high levels of certain amino
acids as well (Fig. 1b). However, for both samples, these increases were not consistent across all amino acids. Additionally, diphosphates ADP and GDP were particularly low in these two
samples. As such, we determined no DRG samples with abnormal degradation were included in our analysis. METABOLOMIC PROFILING SUGGESTS DISRUPTED AMINO ACID AND PHOSPHOLIPID METABOLISM
Metabolomic profiling was performed with 7 DRG from donors with DPN and 10 DRG from non-diabetic controls (Table 1). Capillary electrophoresis mass spectrometry (CE-MS) and liquid
chromatography mass spectrometry (LC–MS) collectively identified 327 metabolites in donor DRG tissues. 165 metabolites were detected in more than 80% of samples and included in further
analysis (Fig. 2a). Dimensionality reduction with principal component analysis (PCA) suggested the influence of donor pain condition on metabolite profiles to be confounded by variables such
as sample storage condition (Supplementary Fig. S1). Linear regression models were applied to candidate metabolites to account for variation due to sample storage condition, donor age, and
donor sex. 21 metabolites were identified as significantly altered as a result of neuropathic pain (p-value adjusted for covariates < 0.05) after this covariate adjustment (Fig. 2b;
Supplementary Table S1). All differentially regulated metabolites were decreased in the DRG from donors with DPN. Of the 21 identified metabolites, 8 are classified as carboxylic acids and
derivatives (_N_-acetylaspartic acid (NAA), creatine (Cr), glycine (Gly), aspartic acid (Asp), glutamine (Gln), glutamate (Glu), guanidoacetic acid, and cysteine glutathione disulfide) (Fig.
2b). We noted additional non-significant decreases in carboxylic acids and derivatives including asparagine (ratio (DPN/control) = 0.46, p-value adjusted for covariates = 0.057) and
ornithine (ratio (DPN/control) = 0.38, p-value adjusted for covariates = 0.058) (Supplementary Table S1). Similarly, our enrichment analysis revealed significantly enriched metabolite sets
related to arginine and proline metabolism, aspartate metabolism, glycine and serine metabolism, and glutamate metabolism (Fig. 2c). Because these observations suggest alterations in amino
acids, the concentrations of proteinogenic amino acids were then examined with quantitative panels (Supplementary Fig. S2). Three differentially regulated amino acids (Gln, Gly, and Glu)
were observed to be among the highest abundance proteinogenic amino acids in the DRG (Supplementary Fig. S2). Of note, non-proteogenic amino acid NAA, was the most significantly decreased
metabolite (ratio (DPN/control) = 0.37, p-value adjusted for covariates = 0.00995). Given that NAA is highly abundant in the nervous system and neuronally important27, regulation of NAA was
confirmed with a quantitative panel (Supplementary Table S1). Among our significantly enriched metabolite sets, we also observed an enrichment for biosynthetic pathways of two phospholipids,
phosphatidylcholine (PC) and phosphatidylethanolamine (PE) (Fig. 2c). Organonitrogen compounds choline (Cho, ratio (DPN/control) = 0.71, p-value adjusted for covariates = 0.049, Fig. 2b)
and ethanolamine (Etn, ratio (DPN/control) = 0.48, p-value adjusted for covariates = 0.0068, Fig. 2b) are involved in both pathways (Fig. 2d). Ethanolamine phosphate (Etn-P, ratio
(DPN/control) = 0.56, p-value adjusted for covariates = 0.027, Fig. 2b) is also involved in both pathways (Fig. 2d), whereas S-adenoylmethionine (SAM) (ratio (DPN/control) = 0.52, p-value
adjusted for covariates = 0.0164, Fig. 2b) is involved in PC synthesis (Fig. 2d). To further support altered phospholipid dynamics, we observed trending losses in two _N_-acylethanolamines,
oleoyl-ethanolamide (OEA, ratio (DPN/control) = 0.69, p-value adjusted for covariates = 0.082, Fig. 2e) and stearoyl-ethanolamide (SEA, ratio (DPN/control) = 0.66, p-value adjusted for
covariates = 0.052, Fig. 2e). Given that PE is the sole endogenous source of OEA and SEA, these metabolites were selected for validation. Quantitative panels confirmed the identity and trend
in differential abundance of OEA and SEA (Fig. 2e; Supplementary Table S1), as well as differential regulation of Cho and SAM (Supplementary Table S1). PROTEOMIC PROFILE SHOWS EXTRACELLULAR
MATRIX REMODELING Proteomic profiling was performed with 5 DRG derived from donors with DPN and 5 DRG derived from control donors without diabetes or chronic pain (Table 1). After sample
prep, total peptide abundance in 1 non-diabetic control sample was abnormally low, this sample was excluded from further analysis. 6186 proteins were identified in human DRG samples. 247
proteins were identified as significantly differentially regulated (Benjamini–Hochberg adjusted p-value < 0.05, Fig. 3a). Dimensionality reduction analyses with PCA and t-distributed
Stochastic Neighbor Embedding (t-SNE) did not show clear sample grouping by neuropathic pain (Supplementary Fig. S3). We believe this was due to some influence of covariate variables and as
such used linear modeling to adjust for age and sex. 41 proteins were identified as significantly altered after covariate control (p-value adjusted for covariates < 0.05, Supplementary
Table S2), of these 5 are regulated by fold change greater than 1.5 (|log2(DPN/control)|> 0.58, Fig. 3b). From statistical overrepresentation test using Panther, differentially regulated
proteins (p-value adjusted for covariates < 0.05) showed enrichment in gene ontology annotations including ECM and biological adhesion (Fig. 3c). Changes to the ECM and cellular adhesion
is highlighted by upregulation of the neural ECM protein, tenascin R (TNR, ratio (DPN/control) = 1.59, p-value adjusted for covariates = 0.048). Using an alternative method, we sought to
further explore regulation of ECM proteins as identified by mass spec. TNR is 150 kDa protein and subject to PTMs such as glycosylation which increase its molecular weight. Western blot
analysis of TNR revealed truncated TNR protein products (< 150 kDa) in all DRG samples (Fig. 3d). These truncated TNR products (< 150 kDa) were excluded from our analysis. Clear
evidence of full-length TNR (150 kDa) and heavy TNR protein products (> 150 kDa) was exclusive to a subset of DPN samples (Fig. 3d). However, upon quantification of TNR (150 kDa) and
heavy TNR protein products (> 150 kDa), this difference was not statistically significant (ratio (DPN/control) = 2.40, p-value = 0.1, Fig. 3d). Regardless, this reveals a TNR regulation
pattern unique to samples within the DPN group. Considering TNR is an ECM protein, we aimed to further explore regulation of this protein with visualization of its localization in the DRG.
To do so, we performed immunohistochemistry with DRG tissue sections. NeuN was used to label neurons in the DRG. TNR fluorescence was observed surrounding select neurons in the DRG (Fig.
3e). We quantified the proportion of neurons in the DRG that are surround by TNR. In control DRG sections, of 453 neurons evaluated, 53 were surrounded by TNR. In DPN DRG sections, of 433
neurons evaluated, 128 neurons were surrounded by TNR. In total, 11.7% of neurons in DRG derived from control donors were surrounded by TNR, whereas 29.6% of neurons in DRG derived from the
DPN donors were surrounded by TNR (p-value = 7.6e−11, Fig. 3e). PHOSPHO-PROTEOMIC RESULTS SHOW CHANGES TO MRNA PROCESSING Using the same samples as in proteomic profiling, samples were
enriched for phospho-peptides and subjected to profiling by mass spectrometry. 7842 phosphorylated peptides mapping to 2533 master proteins were identified. Of these, 153 phospho-peptides
were identified as differentially regulated between DPN and non-diabetic control groups (Benjamini–Hochberg adjusted p-value < 0.05, Fig. 4a). Dimensionality reduction analyses with PCA
and t-SNE again did not show clear separation of samples by neuropathic pain (Supplementary Fig. S4). We again assumed an influence of covariates and we used linear regression to adjust for
age and sex. 27 phospho-peptides were identified after covariate control (p-value adjusted for covariates < 0.05, Supplementary Table S3), 20 of these were regulated by a fold change
greater than 1.5 (|log2(DPN/control)|> 0.58, Fig. 4b). Differential regulation of phospho-peptides could be explained by either differential phosphorylation or differential regulation of
master proteins abundance. To explore this, we looked for overlap in proteomic and phospho-proteomic data. We found that not only are SPP1 phospho-peptides increased, but SPP1 protein is
also slightly increased (ratio (DPN/control) = 1.32, p-value after covariate control = 0.012, Supplementary Table S3). However, abundance ratios of SPP1 phospho-peptides show larger fold
changes, demonstrating phosphorylation differences. All other identified phospho-proteins were either not detected, or not significantly regulated in background proteome data (Supplementary
Table S3). This confirms that identified differentially regulated phospho-proteins are in fact differentially phosphorylated. 3 phospho-peptides derived from SPP1 were upregulated by
abundance ratio greater than 1.5 (pS219, ratio (DPN/control) = 1.6, p-value after covariate control = 0.017; pS263 and pS270, ratio (DPN/control) = 2.0, p-value after covariate control =
0.012; pS254 and pS263 and pS270, ratio (DPN/control) = 1.7, p-value after covariate control = 0.036, Fig. 4b). Additional phospho-peptides derived from SPP1 were also increased, however
with a smaller fold change (pS375 and pS280, ratio (DPN/control) = 1.5, p-value after covariate control = 0.012; pS303, ratio (DPN/control) = 1.4, p-value after covariate control = 0.0218;
pS254, ratio (DPN/control) = 1.478, p-value after covariate control = 0.02, Supplementary Table S3). Due to phosphorylation changes at multiple sites, we hypothesized that overall
phosphorylation state and therefore isoelectric point of SPP1 is altered with DPN. As expected, 2D gel electrophoresis confirmed differential migration patterns of SPP1 in DPN and control
groups, with more acidic migration of SPP1 in DPN samples (Fig. 4c). As phosphorylation is an acidic PTM, this supports increased phosphorylation of SPP1 in the DRG with DPN. Using a
statistical overrepresentation test in Panther, enrichment analysis of differentially regulated phospho-peptides revealed enrichment in annotations involving post-transcriptional regulation
of gene expression and regulation of mRNA stability (Fig. 4d). Central to this is eukaryotic translation elongation factor (eEF2), which shows increased phosphorylation at the T57 residue
(ratio (DPN/control) = 1.77, p-value adjusted for covariates = 0.046, Fig. 4b). Because this phospho-site is well studied and known to inhibit translation activity of eEF228,29, we selected
this phospho-protein for further study. We used western blot to validate mass spectrometry findings. Western blot analysis confirmed increased phosphorylation of eEF2 at the T57 residue in
DRGs from DPN donors (ratio (DPN/control) = 1.78, p-value = 0.0016, Fig. 4e). MULTI-OMICS INTEGRATION SUGGESTS CONTRIBUTION OF DISRUPTED AMINO ACID AND PROTEIN METABOLISM IN NEURONAL
DYSFUNCTION Using an IPA, we looked for commonalities in disease and function annotations among our omics datasets. Synthesis of protein, metabolism of protein, and synthesis of amino acids
were suggested to be decreased, while uptake of amino acids was possibly identified as increased (Table 2). As expected, these annotations are drawn from decreases in amino acids (Table 2).
Phospho-proteins eEF2 and SPP1 are also related to decreased synthesis and metabolism of protein (Table 2). Additionally, SPP1, eEF2, TNR, certain amino acids (NAA, Glu), and certain
phospholipid metabolites (SAM, Cho) are annotated as contributing to increased progressive neurological disorder (Table 2). Altogether, this links amino acid and protein metabolism with
neurological dysfunction in DPN (Fig. 5a, b). This also links changes to ECM proteins and phospholipid metabolism to neurological dysfunction in DPN (Fig. 5b). DISCUSSION DPN is a common
form of chronic pain for which there is no effective curative treatment. Demyelination, axonal degeneration, and neuronal dysfunction and death are linked to progression of pain in DPN8.
Here, we used a multi-omics approach to gain a comprehensive understanding of molecular alterations associated with this pathology. Given the difficulties in obtaining human DRG samples,
this descriptive omics-based study reveals unique information necessary for further elucidating the etiology and progression of DPN. Our metabolomic study revealed depletion of select amino
acids in the DRG in our DPN cohort (Fig. 2b, c) as well as decreased phospholipid-related metabolites (Fig. 2c, d). In proteomic and phospho-proteomic data we find changes to structural ECM
proteins (Fig. 3b, c) and differential phosphorylation of RNA binding proteins (Fig. 4b, d) in the DRG with DPN. A TNR regulation pattern unique to DPN samples was also observed in western
blot analysis (Fig. 3d) and IHC (Fig. 3e). Hyperphosphorylation of eEF2 (Fig. 4e) and SPP1 (Fig. 4c) in DPN were confirmed using western blot. Integration of this data using IPA suggests
decreased amino acids and altered phosphorylation of RNA binding proteins contribute to altered protein synthesis and neurological disorder in the DRG in DPN (Table 2; Fig. 5a, b). In our
metabolomics analysis, we record decreases in 8 carboxylic acid and derivatives, including proteogenic amino acids Glu, Gln, Gly, and Asp (Fig. 2b). Of note, IPA reveals a link between amino
acids Glu and NAA, and progressive neurological disorders (Table 2; Fig. 5a, b). Although homeostasis for most amino acids is maintained by transport processes, intracellular Glu and Asp
levels are influenced most by energy metabolism30 (Fig. 5b). Observations of decreased Gly and Gln are consistent with alterations in plasma levels of diabetic patients31,32. Such states of
amino acid depletion have been linked to cell death and neurodegeneration33,34,35. However, whether amino acid depletion in the DRG is sufficient to produce degeneration observed in DPN is
unclear. Additionally, Gly can function as an inhibitory neurotransmitter; however, a causal relation between decreased Gly in diabetes and neuronal hyperexcitability in DPN has not been
studied31. Moreover, the non-proteinogenic amino acid NAA is decreased in our data (Fig. 2b). NAA is synthesized in neuronal mitochondria by the enzyme NAT8L36 (Fig. 5a). Interestingly, the
gene transcript for the enzyme was decreased in RNA-seq data12; however, this same change was not detected in our proteomic data. This discrepancy could be related to post-transcriptional
regulation or sampling effects. Nonetheless, decreased NAA is important in the peripheral nervous system as it is utilized by Schwann cells to synthesize myelin37 (Fig. 5a). Neuronal injury
and degeneration decrease NAA, suggesting the differential regulation of NAA in DRG is specific to the neuropathic phenotype in DPN27,38. NAA’s role in myelin synthesis also provides a
possible mechanism for demyelination in DPN (Fig. 5a, b). We also report decreases in metabolites linked to phospholipid biosynthesis (Fig. 2c–e). Specifically, differentially regulated
metabolites are metabolically related to PC and PE (Fig. 2c). We also see a trend with DPN towards decreased SEA, a PE derived compound that has been reported to have an analgesic effect39.
Phospholipids are also important in mitochondrial function and myelin maintenance40,41 (Fig. 5b). PC is a high abundance phospholipid in peripheral myelin41. The short half-life of this
molecule41 suggests a link between PC biosynthesis and demyelination in DPN (Fig. 5b). Among significantly altered proteins, we observe enrichment of proteins in the ECM (Fig. 3c). The ECM
has been implicated in painful conditions by regulating the neuronal microenvironment, influencing synaptic plasticity, and modulating cell signaling42,43,44. We observe a unique TNR
regulation pattern with DPN, especially a greater proportion of DRG neurons surrounded by TNR with DPN (Fig. 3d, e). Western blot results show heavy TNR products (> 150 kDa) in the DRG
with DPN, suggestive of glycosylation (Fig. 3d). Glycosylation of TNR is reported to vary with development, possibly impacting TNR’s adhesive properties and interactions in the ECM45. TNR is
also noted to be related to amino acid uptake and progressive neurological disorder in IPA (Table 2; Fig. 5b). Specifically, TNR has been reported to indirectly regulate Glu uptake46. A
direct relation between amino acid depletion and TNR upregulation in the DRG is not clear. However, increased TNR does inhibit axonal regeneration47, thus, implicating this protein in
neuronal degeneration observed in the DRG with DPN. Among differentially regulated phospho-proteins, we report enrichment in annotations relating to RNA binding and translation (Fig. 4c).
Changes in phosphorylation of RNA binding proteins is highlighted by hyperphosphorylation of eEF2 at the T57 residue (Fig. 4b, e; Supplementary Table S3). Phosphorylation at this site is
well known to inhibit protein translation29 (Fig. 5b). Interestingly, eEF2 hyperphosphorylation can occur in response to ER stress48, a phenomenon suggested by our previous transcriptomic
analysis12. Further evidence of ER stress can be noted by the ER’s role in phospholipid biosynthesis49 and the evidence of decreased phospholipid biosynthesis in our data (Figs. 2c, d; 5b).
ER stress is well known to contribute to chronic pain and neurodegeneration50,51,52. With the ER being a single continuous organelle, spanning the entity of the axon, long sensory neurons
are particularly vulnerable to ER stress53. However, the myelinating activities of glial cells also make them susceptible to ER stress54. Further work is needed to explore cell-type specific
ER-stress in DPN. We also report hyperphosphorylation of SPP1 (Fig. 4b, c). We note a slight increase in total SPP1; however, this result was not validated, and the fold change was minimal
(ratio (DPN/control) = 1.32); Supplementary Table S2). SPP1 is marker for proprioceptors in the DRG and is linked to nerve injury and mechanical pain55,56. SPP1 has also been reported to be
linked to ER stress57,58, inflammation in diabetes and neurodegeneration59,60, and adhesion in the extracellular matrix61 (Fig. 5b). However, these reports looked at total SPP1, less is
known about the function of phosphorylated SPP1. We previously reported a pro-inflammatory signature in the DRG with DPN12. TNR, of which we observe a unique regulation pattern with DPN
(Fig. 3b, d, e), is tightly linked to neuroinflammation62. SPP1 is involved in inflammatory processes as well59,60,61,63 although the role of SPP1 phosphorylation in these mechanisms is not
known. We also find minor changes in interferon induced protein with tetratricopeptide repeats 3 (IFIT3, ratio = 1.25, p-value after covariate control = 0.024; Supplementary Table S2) and
interferon stimulated gene 15 (ISG15, ratio = 1.44, p-value after covariate control = 0.017; Supplementary Table S2), both of which play a role in immune signaling. Inflammation is known to
contribute to progression of both T2D and DPN64,65. Lack of an identification of a stronger inflammatory signature in proteomic data is likely a result of detection limits of our methods.
This study is limited by a small sample size brought on by the lack of available human DRG tissue in both disease and healthy conditions. Additionally, a lack of available clinical pain
assessment of DRG donors limits the power of this study. A study with the resources to overcome these limitations has yet to be powered and would allow valuable information to build off
these preliminary results26. Out of an abundance of caution, we used strict covariate controls, however this may have added to limitations in our statistical power. Although determined to be
minimal, postmortem changes likely limited the power of this study, as did detection limits of mass spectrometry. Despite this, our study offers an important preliminary look into
metabolite and protein dynamics in a disease state in the human DRG. Further work is needed to explore this regulation in larger cohort of donors. Additionally, future studies are needed to
explore mechanistic contributions of identified molecules in the development of pain in DPN. In this pilot study, we explored for the first time, metabolite, protein, and phospho-protein
regulation in the human DRG. Furthermore, comparison of non-diabetic and DPN derived DRG suggests a role of disrupted amino acid and protein metabolism in neuronal dysfunction in DPN. We
propose use of findings here to advise further studies with DPN. In depth understanding of molecular regulation identified here could offer novel insights into the etiology and development
of DPN. METHODS SAMPLE ACQUISITION DRG used in this study were acquired from the cadaveric donors with informed consent of the next of kin (Anabios, San Diego, CA). We obtained approval for
carrying out these studies from the National Institutes of Health (NIH) Office of Human Subjects Research Protection (OHSRP) and Biosafety Committee, Bethesda, MD, USA. All methods were
performed in accordance with the guidelines and regulations approved by NIH Biosafety Committee, Bethesda, MD, USA. L4, L5 and S1 DRGs were collected under cold ischemic conditions, within 3
h of aorta cross-clamp. Donor medical history was obtained by trained interviewers from donor family members to the best of their knowledge. Despite lack of clinical data, organ donation
offers unique and valuable insight molecular regulation in the soma of sensory neurons impacted in DPN. METABOLOMIC ANALYSIS DATA ACQUISITION S1 DRG samples (30–50 mg) were used for
metabolite analysis (Human Metabolome Technologies-America, Boston, MA). For polar metabolites, frozen tissues were homogenized in acetonitrile in water (50%) with internal standards (20
μM). The supernatant was filtered through a 5 kDa filter, centrifugally concentrated, and resuspended in ultrapure water (50 μl). CE-TOFMS was carried out using Agilent CE-TOFMS system
(Agilent Technologies Inc, Waldbronn, Germany) and fused silica capillary (50 μm × 80 cm) with HMT electrophoresis buffer and HMT sheath liquid. Capillary electrophoresis was run at 30 kV.
The spectrometer scanned from mass/charge (m/z) 50–1000. For non-polar metabolites, frozen tissue was homogenized by vortexing with zirconium beads in 1% formic acid in acetonitrile
containing internal standards (10 μM) and centrifuged (2300×_g_, 4 °C, 5 min). The supernatant was collected. The pellet was homogenized in 1% formic acid in acetonitrile and MilliQ-water
(167 ul) followed by centrifugation (2300×_g_, 4 °C, 5 min). Supernatants were combined and filtered through a 3 kDa filter and a far filtered through phospholipid affinity column (Hybrid
SPE phospholipid 55261-U, Supelco, Bellefonte, PA, USA). Filtrate was desiccated and resuspended in isopropanol (50%) in Mili-Q water. LC-TOFMS was carried out with Agilent 1200 series RRLC
system SL (Agilent Technologies Inc, Wadbronn, Germany) with ODS column (2 × 50 mm, 2 μm) coupled to Agilent LC/MSD TOF MS system (Agilent Technologies Inc, Wadbronn, Germany). For
chromatographic separation, mobile phase A was 0.1% HCOOH In H2O. Mobile Phase B was 0.1% HCOOH and 2 mM HCOONH4 in 65:30:5 isopropanol: acetonitrile: H2O. The gradient condition was 1%
mobile phase B for 0.5 min, followed by a 13-min ramp from 1% mobile phase B to 100% mobile phase B, followed by 100% mobile phase B for 6.5 min. Flow rate was 0.3 mL/min, column temperature
was 40 °C, injection volume was 1 μL, MS capillary voltage was 4 kV and 3.5 kV in ESI positive and ESI negative mode respectively, nebulizer pressure was 40 psi, gas flow was 10 L/min, and
gas temperature was 350 °C. The spectrometer scanned from mass/charge (m/z) 100 to 1700. CE-TOFMS and LC-TOFMS data was processed with MasterHands (v2.17.1.11) for identification of peaks
and quantification based on internal standards. Metabolites detected in fewer than 80% of samples were excluded from downstream analysis. Remaining missing values were imputed using half
minimum method66. Identity and concentration of select metabolites was validated using external unlabeled standards. Human Metabolome Database was used to identify metabolite class and
directly related enzymes. PROTEOMICS SAMPLE PREP Tissues were prepared for proteomic analysis using EasyPep Mini MS Sample Prep Kit according to manufacturer’s instructions (Thermo Fisher
Scientific). Protein concentration was measured using Pierce BCA Protein Assay (Thermo Fisher Scientific). 100 μg aliquots of protein from each sample were reduced, alkylated, and digested.
Remaining protein extracts were saved for electrophoresis and western blot. Samples were labeled with TMTpro 16-plex (Thermo Fisher Scientific) according to the manufacturer’s instructions.
10 μg of each sample was combined, fractionated using high pH fractionation kit (Thermo Fisher Scientific), and used for full proteome analysis. The remaining 90 μg of each sample was pooled
for phospho-peptide enrichment with PTMScan Phospho-Enrichment IMAC FE-NTA Magnetic Beads (Cell Signaling Technology) according to the manufacturer’s instructions. The flow through was then
enriched according to the High-Select SMOAC protocol (Thermo Scientific Scientific). In the SMOAC protocol, samples were sequentially enriched with High-Select TiO2 Phosphopeptide
Enrichment Kit (Thermo Fisher Scientific) and High-Select Fe-NTA Phosphopeptide Enrichment Kit (Thermo Fisher Scientific). DATA ACQUISITION All fractions were analyzed with nano LC–MS/MS
with Thermo Scientific Fusion Lumos Tribrid mass spectrometer interfaced to a UltiMate3000 RSLCnano HPLC system (Thermo Fisher Scientific, San Jose, CA). For each analysis, 1 micro of
corresponding fraction was loaded and desalted in an Acclaim PepMap 100 trap column (75 µm × 2 cm) at 4 μl/min for 5 min. Peptides were then eluted into a 75 μm × 250 mm Accalaim PepMap 100
column (3 μm, 100 Å) and chromatographically separated using a binary solvent system consisting of A: 0.1% formic acid and B: 0.1% formic acid and 80% acetonitrile, at a flow rate of 300
nl/min. A gradient was run from 1% B to 42% B over 150 min, followed by a 5-min wash step with 80% B and a 10-min equilibration at 1% B before the next sample was injected. Precursor masses
were detected in the Orbitrap at R = 120,000 (m/z 200). HCD fragment masses were detected in the orbitrap at R = 50,000 (m/z 200). Data-dependent MS/MS was carried out with top of speed
setting, cycle time 2 s with dynamic exclusion of 20 s. Proteome Discoverer Software (v2.5, Thermo Fisher Scientific, San Jose, CA) processed mass spectrometry data. MS spectra were searched
against Homo sapiens and contaminant databases using the SEQUEST HT with PhosphoRS node for verification of phosphorylation sites. The following search parameters were used: enzyme:
trypsin; maximum missed cleavage sites: 2; precursor mass tolerance: 10 ppm; fragment mass tolerance: 0.02 Da; dynamic modifications: oxidation (M), phosphorylation (S, T, Y), acetylation
(protein N-terminus); static modifications: TMTpro (peptide N-terminus), carbamidomethyl (C), TMTpro (K); percolator strict FDR: < 0.01, percolator relaxed FDR < 0.05. For
quantification, samples were normalized by total peptide abundance. Spectra with > 50% isolation interference were excluded. Protein quantification was performed using unique and razor
peptides, protein ratio calculation was protein abundance based, missing data was imputed using low abundance resampling. Proteome Discoverer reported background-based t-tests, with the
Benjamini Hochberg correction. 2-D GEL ELECTROPHORESIS Two-dimensional electrophoresis was performed with 500 ug of protein by Kendrick Labs, Inc. (Madison, WI) according to the carrier
ampholine method of isoelectric focusing67. Isoelectric focusing was carried out in a glass tube of inner diameter 3.3 mm using 2.0% pH 3–10 isodalt Servalytes (Serva, Heidelberg, Germany)
for 20,000 V-h. Tube gels were then sealed to the top of a stacking gel that overlaid a 10% acrylamide slab gel (1.0 mm) and SDS slab gel electrophoresis was carried out. The gel was then
transblotted onto PVDF membrane. WESTERN BLOTTING Proteins were separated with 4 to 12% bis–tris gels for eEF2 or 7% tris–acetate gel for TNR and transferred to a PVDF membrane. Membranes
were blocked and incubated overnight with primary antibodies against pT57-eEF2 (1/1000, 2331, Cell Signaling Technologies), eEF2 (1/1000, 2332, Cell Signaling Technologies), TNR (1/2000,
AF3865, R&D systems), alpha-tubulin (1/10,000, ab7291, Abcam), or SPP1 (1/1000, ab8448, Abcam). Membranes were washed and incubated with HRP conjugated secondary antibodies against
rabbit IgG (1/10,000, 711-035-152, Jackson Immunoresearch), goat IgG (1/10,000, 705-035-003, Jackson Immunoresearch), or mouse IgG (1/10,000, ab6789, Abcam). Chemiluminescence was detected
using ECL substrate and imaged with FlourChem M (Biotechne) or Amersham Imager 600 (GE Healthcare Life Sciences) for membranes from 2D gel. For detection of total eEF2 after detection of
p-eEF2, the membrane was stripped with Restore PLUS Western Blot Stripping Buffer (Thermo Fisher Scientific). Quantification was performed using ImageJ software. Contrast was adjusted using
adobe illustrator to improve visualization. IMMUNOHISTOCHEMISTRY Formalin fixed paraffin embedded DRG tissue sections were deparaffinized and subject to citrate buffered antigen retrieval.
Sections were stained using a primary antibody raised against TNR (1/50, AF3865, R&D systems) and secondary antibody conjugated to Rhodamine Red-X raised against goat IgG (1/100,
705-296-147, Jackson Immunoresearch). Sections were also stained with antibody raised against NeuN and conjugated to Alexa Flour488 (1/100, MAB377X, Sigma Aldrich). Sections were mounted
using DAPI fluoromount-G (17984-24, Electron Microscopy Sciences). Fluorescence was imaged using a Nikon A1R HD25 Spectral microscope. Representative images at 10× magnification were used
for analysis, images for figures were acquired at 20× magnification. The proportion of NeuN expressing cells which are also surrounded by TNR was compared between groups. STATISTICAL
ANALYSIS Statistical analyses were performed in R, unless otherwise specified. A T-test was used to assess statistical differences in metabolomic and western blot data, a z-test was used to
assess statistical differences in immunohistochemistry data. For omics datasets, the R package stats (v3.6.2) was used to apply linear regression models to candidate molecules for covariate
control. Enrichment analyses were performed with molecules with p-value after covariate control < 0.05. Metabolite enrichment was performed using metaboanalyst with Small Molecule Pathway
Database (SMPDB). Proteome and phospho-proteome enrichment analysis was performed separately with Panther with p-values resulting from fisher’s exact test. Ingenuity Pathway Analysis (IPA)
software (Ingenuity Systems, Mountain View, CA) was used for integrated enrichment of candidate metabolites proteins, and phospho-proteins. DATA AVAILABILITY Data is available upon
reasonable request to the communicating author: Dr. Ashok Kulkarni at [email protected]. REFERENCES * Yong, R. J., Mullins, P. M. & Bhattacharyya, N. Prevalence of chronic pain
among adults in the United States. _Pain_ 163(2), e328–e332 (2022). Article PubMed Google Scholar * Bouhassira, D. _et al._ Prevalence of chronic pain with neuropathic characteristics in
the general population. _Pain_ 136(3), 380–387 (2008). Article PubMed Google Scholar * Khan, M. A. B. _et al._ Epidemiology of type 2 diabetes—Global burden of disease and forecasted
trends. _J. Epidemiol. Glob. Health_ 10(1), 107–111 (2020). Article PubMed PubMed Central Google Scholar * Saeedi, P. _et al._ Global and regional diabetes prevalence estimates for 2019
and projections for 2030 and 2045: Results from the International Diabetes Federation Diabetes Atlas, 9(th) edition. _Diabetes Res. Clin. Pract._ 157, 107843 (2019). Article PubMed Google
Scholar * Tesfaye, S. _et al._ Diabetic neuropathies: Update on definitions, diagnostic criteria, estimation of severity, and treatments. _Diabetes Care_ 33(10), 2285–2293 (2010). Article
PubMed PubMed Central Google Scholar * O’Brien, P. D. _et al._ Integrated lipidomic and transcriptomic analyses identify altered nerve triglycerides in mouse models of prediabetes and
type 2 diabetes. _Dis. Model. Mech._ 13(2), 66 (2020). Google Scholar * Smith, A. G. & Singleton, J. R. Obesity and hyperlipidemia are risk factors for early diabetic neuropathy. _J.
Diabetes Complic._ 27(5), 436–442 (2013). Article Google Scholar * Feldman, E. L. _et al._ New horizons in diabetic neuropathy: Mechanisms, bioenergetics, and pain. _Neuron_ 93(6),
1296–1313 (2017). Article CAS PubMed PubMed Central Google Scholar * Gregg, E. W. _et al._ Prevalence of lower-extremity disease in the US adult population >=40 years of age with and
without diabetes: 1999–2000 National Health and Nutrition Examination Survey. _Diabetes Care_ 27(7), 1591–1597 (2004). Article PubMed Google Scholar * Pop-Busui, R. _et al._ Diabetic
neuropathy: A position statement by the American Diabetes Association. _Diabetes Care_ 40(1), 136–154 (2017). Article CAS PubMed Google Scholar * Krames, E. S. The dorsal root ganglion
in chronic pain and as a target for neuromodulation: A review. _Neuromodulation_ 18(1), 24–32 (2015) (DISCUSSION 32). Article PubMed Google Scholar * Hall, B. E. _et al._ Transcriptomic
analysis of human sensory neurons in painful diabetic neuropathy reveals inflammation and neuronal loss. _Sci. Rep._ 12(1), 4729 (2022). Article ADS CAS PubMed PubMed Central Google
Scholar * Anderson, L. & Seilhamer, J. A comparison of selected mRNA and protein abundances in human liver. _Electrophoresis_ 18(3–4), 533–537 (1997). Article CAS PubMed Google
Scholar * Schwanhäusser, B. _et al._ Corrigendum: Global quantification of mammalian gene expression control. _Nature_ 495(7439), 126–127 (2013). Article ADS PubMed Google Scholar * de
Sousa Abreu, R. _et al._ Global signatures of protein and mRNA expression levels. _Mol. Biosyst._ 5(12), 1512–1526 (2009). PubMed Google Scholar * Schwaid, A. G. _et al._ Comparison of the
rat and human dorsal root ganglion proteome. _Sci. Rep._ 8(1), 13469 (2018). Article ADS PubMed PubMed Central Google Scholar * Vogel, C. & Marcotte, E. M. Insights into the
regulation of protein abundance from proteomic and transcriptomic analyses. _Nat. Rev. Genet._ 13(4), 227–232 (2012). Article CAS PubMed PubMed Central Google Scholar * Zhang, S. _et
al._ Insights into translatomics in the nervous system. _Front. Genet._ 11, 599548 (2020). Article CAS PubMed PubMed Central Google Scholar * Weston, A. D. & Hood, L. Systems
biology, proteomics, and the future of health care: Toward predictive, preventative, and personalized medicine. _J. Proteome Res._ 3(2), 179–196 (2004). Article CAS PubMed Google Scholar
* Freeman, O. J. _et al._ Metabolic dysfunction is restricted to the sciatic nerve in experimental diabetic neuropathy. _Diabetes_ 65(1), 228–238 (2016). Article CAS PubMed Google
Scholar * Hinder, L. M. _et al._ Decreased glycolytic and tricarboxylic acid cycle intermediates coincide with peripheral nervous system oxidative stress in a murine model of type 2
diabetes. _J. Endocrinol._ 216(1), 1–11 (2013). Article CAS PubMed PubMed Central Google Scholar * George, D. S. _et al._ Mitochondrial calcium uniporter deletion prevents painful
diabetic neuropathy by restoring mitochondrial morphology and dynamics. _Pain_ 163(3), 560–578 (2022). Article CAS PubMed Google Scholar * Leal-Julià, M. _et al._ Proteomic quantitative
study of dorsal root ganglia and sciatic nerve in type 2 diabetic mice. _Mol. Metab._ 55, 101408 (2022). Article PubMed Google Scholar * Percie du Sert, N. & Rice, A. S. Improving the
translation of analgesic drugs to the clinic: Animal models of neuropathic pain. _Br. J. Pharmacol._ 171(12), 2951–63 (2014). Article CAS PubMed PubMed Central Google Scholar * Zisaki,
A., Miskovic, L. & Hatzimanikatis, V. Antihypertensive drugs metabolism: An update to pharmacokinetic profiles and computational approaches. _Curr. Pharm. Des._ 21(6), 806–822 (2015).
Article CAS PubMed PubMed Central Google Scholar * Iadarola, M. J., Sapio, M. R. & Mannes, A. J. Be in it for the long haul: A commentary on human tissue recovery initiatives. _J.
Pain_ 6, 66 (2022). Google Scholar * Moffett, J. R. _et al._ _N_-Acetylaspartate reductions in brain injury: Impact on post-injury neuroenergetics, lipid synthesis, and protein acetylation.
_Front. Neuroenerget._ 5, 11 (2013). Article CAS Google Scholar * Ryazanov, A. G. Ca2+/calmodulin-dependent phosphorylation of elongation factor 2. _FEBS Lett._ 214(2), 331–334 (1987).
Article CAS PubMed Google Scholar * Carlberg, U., Nilsson, A. & Nygård, O. Functional properties of phosphorylated elongation factor 2. _Eur. J. Biochem._ 191(3), 639–645 (1990).
Article CAS PubMed Google Scholar * Gauthier-Coles, G. _et al._ Quantitative modelling of amino acid transport and homeostasis in mammalian cells. _Nat. Commun._ 12(1), 5282 (2021).
Article ADS CAS PubMed PubMed Central Google Scholar * Adeva-Andany, M. _et al._ Insulin resistance and glycine metabolism in humans. _Amino Acids_ 50(1), 11–27 (2018). Article CAS
PubMed Google Scholar * Menge, B. A. _et al._ Selective amino acid deficiency in patients with impaired glucose tolerance and type 2 diabetes. _Regul. Pept._ 160(1–3), 75–80 (2010).
Article CAS PubMed Google Scholar * Sadasivan, S. _et al._ Amino acid starvation induced autophagic cell death in PC-12 cells: evidence for activation of caspase-3 but not calpain-1.
_Apoptosis_ 11(9), 1573–1582 (2006). Article CAS PubMed Google Scholar * Sato, H. _et al._ Neurodegenerative processes accelerated by protein malnutrition and decelerated by essential
amino acids in a tauopathy mouse model. _Sci. Adv._ 7(43), eabd5046 (2021). Article ADS CAS PubMed PubMed Central Google Scholar * Suraweera, A. _et al._ Failure of amino acid
homeostasis causes cell death following proteasome inhibition. _Mol. Cell_ 48(2), 242–253 (2012). Article CAS PubMed PubMed Central Google Scholar * Wiame, E. _et al._ Molecular
identification of aspartate _N_-acetyltransferase and its mutation in hypoacetylaspartia. _Biochem. J._ 425(1), 127–136 (2009). Article PubMed Google Scholar * Mersmann, N. _et al._
Aspartoacylase-lacZ knockin mice: An engineered model of Canavan disease. _PLoS ONE_ 6(5), e20336 (2011). Article ADS CAS PubMed PubMed Central Google Scholar * Zaroff, S. _et al._
Transcriptional regulation of _N_-acetylaspartate metabolism in the 5xFAD model of Alzheimer’s disease: Evidence for neuron-glia communication during energetic crisis. _Mol. Cell Neurosci._
65, 143–152 (2015). Article CAS PubMed PubMed Central Google Scholar * Maccarrone, M. _et al._ Cannabimimetic activity, binding, and degradation of stearoylethanolamide within the mouse
central nervous system. _Mol. Cell Neurosci._ 21(1), 126–140 (2002). Article CAS PubMed Google Scholar * Osman, C., Voelker, D. R. & Langer, T. Making heads or tails of
phospholipids in mitochondria. _J. Cell Biol._ 192(1), 7–16 (2011). Article CAS PubMed PubMed Central Google Scholar * Poitelon, Y., Kopec, A. M. & Belin, S. Myelin fat facts: An
overview of lipids and fatty acid metabolism. _Cells_ 9(4), 66 (2020). Article Google Scholar * Bogen, O. _et al._ GDNF hyperalgesia is mediated by PLCgamma, MAPK/ERK, PI3K, CDK5 and Src
family kinase signaling and dependent on the IB4-binding protein versican. _Eur. J. Neurosci._ 28(1), 12–19 (2008). Article PubMed PubMed Central Google Scholar * Li, Z. Z. _et al._
Extracellular matrix protein laminin beta1 regulates pain sensitivity and anxiodepression-like behaviors in mice. _J. Clin. Invest._ 131(15), 66 (2021). Article Google Scholar * Reichling,
D. B., Green, P. G. & Levine, J. D. The fundamental unit of pain is the cell. _Pain_ 154(Suppl 1), S2-9 (2013). Article PubMed Google Scholar * Woodworth, A., Pesheva, P., Fiete, D.
& Baenziger, J. U. Neuronal-specific synthesis and glycosylation of tenascin-R. _J. Biol. Chem._ 279(11), 10413–10421 (2004). Article CAS PubMed Google Scholar * Okuda, H. _et al._
Chondroitin sulfate proteoglycan tenascin-R regulates glutamate uptake by adult brain astrocytes. _J. Biol. Chem._ 289(5), 2620–2631 (2014). Article CAS PubMed Google Scholar * Reinhard,
J., Roll, L. & Faissner, A. Tenascins in retinal and optic nerve neurodegeneration. _Front. Integr. Neurosci._ 11, 30 (2017). Article PubMed PubMed Central Google Scholar * Boyce,
M. _et al._ A pharmacoproteomic approach implicates eukaryotic elongation factor 2 kinase in ER stress-induced cell death. _Cell Death Differ._ 15(3), 589–599 (2008). Article CAS PubMed
Google Scholar * Henry, S. A., Kohlwein, S. D. & Carman, G. M. Metabolism and regulation of glycerolipids in the yeast _Saccharomyces cerevisiae_. _Genetics_ 190(2), 317–349 (2012).
Article CAS PubMed PubMed Central Google Scholar * Barragan-Iglesias, P. _et al._ Activation of the integrated stress response in nociceptors drives methylglyoxal-induced pain. _Pain_
160(1), 160–171 (2019). Article CAS PubMed PubMed Central Google Scholar * Inceoglu, B. _et al._ Endoplasmic reticulum stress in the peripheral nervous system is a significant driver of
neuropathic pain. _Proc. Natl. Acad. Sci. USA_ 112(29), 9082–9087 (2015). Article ADS CAS PubMed PubMed Central Google Scholar * Lindholm, D., Wootz, H. & Korhonen, L. ER stress
and neurodegenerative diseases. _Cell Death Differ._ 13(3), 385–392 (2006). Article CAS PubMed Google Scholar * Öztürk, Z., O’Kane, C. J. & Pérez-Moreno, J. J. Axonal endoplasmic
reticulum dynamics and its roles in neurodegeneration. _Front. Neurosci._ 14, 48 (2020). Article PubMed PubMed Central Google Scholar * Lin, W. & Popko, B. Endoplasmic reticulum
stress in disorders of myelinating cells. _Nat. Neurosci._ 12(4), 379–385 (2009). Article CAS PubMed PubMed Central Google Scholar * Goswami, S. C. _et al._ Molecular signatures of
mouse TRPV1-lineage neurons revealed by RNA-Seq transcriptome analysis. _J. Pain_ 15(12), 1338–1359 (2014). Article CAS PubMed PubMed Central Google Scholar * Marsh, B. C., Kerr, N. C.,
Isles, N., Denhardt, D. T. & Wynick, D. Osteopontin expression and function within the dorsal root ganglion. _NeuroReport_ 18(2), 153–157 (2007). Article CAS PubMed PubMed Central
Google Scholar * Dalal, S. _et al._ Osteopontin stimulates apoptosis in adult cardiac myocytes via the involvement of CD44 receptors, mitochondrial death pathway, and endoplasmic reticulum
stress. _Am. J. Physiol. Heart Circ. Physiol._ 306(8), H1182–H1191 (2014). Article CAS PubMed PubMed Central Google Scholar * Wu, J. _et al._ NK cells induce hepatic ER stress to
promote insulin resistance in obesity through osteopontin production. _J. Leukoc Biol._ 107(4), 589–596 (2020). Article CAS PubMed Google Scholar * Chai, Y. L. _et al._ Plasma
osteopontin as a biomarker of Alzheimer’s disease and vascular cognitive impairment. _Sci. Rep._ 11(1), 4010 (2021). Article ADS CAS PubMed PubMed Central Google Scholar * Kahles, F.,
Findeisen, H. M. & Bruemmer, D. Osteopontin: A novel regulator at the cross roads of inflammation, obesity and diabetes. _Mol. Metab._ 3(4), 384–393 (2014). Article CAS PubMed PubMed
Central Google Scholar * Giachelli, C. M. & Steitz, S. Osteopontin: A versatile regulator of inflammation and biomineralization. _Matrix Biol._ 19(7), 615–622 (2000). Article CAS
PubMed Google Scholar * Jakovcevski, I. _et al._ Tenascins and inflammation in disorders of the nervous system. _Amino Acids_ 44(4), 1115–1127 (2013). Article CAS PubMed Google Scholar
* Rowe, G. C. _et al._ PGC-1alpha induces SPP1 to activate macrophages and orchestrate functional angiogenesis in skeletal muscle. _Circ. Res._ 115(5), 504–517 (2014). Article CAS PubMed
PubMed Central Google Scholar * Prabhakar, O. Inflammatory biomarkers as a part of diagnosis in diabetic peripheral neuropathy. _J. Diabetes Metab. Disord._ 20(1), 869–882 (2021).
Article Google Scholar * Tsalamandris, S. _et al._ The role of inflammation in diabetes: Current concepts and future perspectives. _Eur. Cardiol._ 14(1), 50–59 (2019). Article PubMed
PubMed Central Google Scholar * Wei, R. _et al._ Missing value imputation approach for mass spectrometry-based metabolomics data. _Sci. Rep._ 8(1), 663 (2018). Article ADS PubMed PubMed
Central Google Scholar * Kendrick, N. _et al._ Preparation of a phosphotyrosine-protein standard for use in semiquantitative western blotting with enhanced chemiluminescence. _PLoS ONE_
15(6), e0234645 (2020). Article CAS PubMed PubMed Central Google Scholar Download references ACKNOWLEDGEMENTS We would like to thank Anabios Corporation for procuring the human DRGs. We
also thank Alexander Buko of Human Metabolome Technologies, America for acquisition and discussion of metabolomic data. We thank Dr. Pavan Auluck of NIMH for pathological evaluation of DRG
tissues. We thank Dr. Bill Swaim and Dr. Duy Tran of the NIDCR imaging core for advisement with immunohistochemistry and imaging. We also thank Dr. Ranganath Muniyappa of NIDDK for his
insightful comments and advisement. This research was supported by the Division of Intramural Research, NIDCR, NIH (ZIA-DE-000664-24, ZIA-DE-000751). FUNDING Open Access funding provided by
the National Institutes of Health (NIH). These studies were supported by the Intramural Division of the National Institute of Dental and Craniofacial Research, National Institutes of Health:
ZIA-DE-000664-24 (ABK) and ZIA-DE-000751 (YW). AUTHOR INFORMATION AUTHORS AND AFFILIATIONS * Functional Genomics Section, National Institute of Dental and Craniofacial Research, National
Institutes of Health, Bethesda, MD, 20892, USA Megan Doty, Minghan Hu, Margaret Cassidy, Bradford Hall & Ashok B. Kulkarni * Predictiv Care, Inc, Mountain View, CA, 94040, USA Sijung Yun
* Mass Spectrometry Facility, National Institute of Dental and Craniofacial Research, National Institutes of Health, Bethesda, MD, 20892, USA Yan Wang Authors * Megan Doty View author
publications You can also search for this author inPubMed Google Scholar * Sijung Yun View author publications You can also search for this author inPubMed Google Scholar * Yan Wang View
author publications You can also search for this author inPubMed Google Scholar * Minghan Hu View author publications You can also search for this author inPubMed Google Scholar * Margaret
Cassidy View author publications You can also search for this author inPubMed Google Scholar * Bradford Hall View author publications You can also search for this author inPubMed Google
Scholar * Ashok B. Kulkarni View author publications You can also search for this author inPubMed Google Scholar CONTRIBUTIONS M.D., B.H., and A.B.K. conceptualized the project. M.D., S.Y.,
Y.W. carried out experiments and analyzed data. M.D. wrote original draft. M.D., S.Y., Y.W., B.H., M.H., M.C., and A.B.K. reviewed and edited manuscript. CORRESPONDING AUTHOR Correspondence
to Ashok B. Kulkarni. ETHICS DECLARATIONS COMPETING INTERESTS The authors declare no competing interests. ADDITIONAL INFORMATION PUBLISHER'S NOTE Springer Nature remains neutral with
regard to jurisdictional claims in published maps and institutional affiliations. SUPPLEMENTARY INFORMATION SUPPLEMENTARY TABLES. SUPPLEMENTARY INFORMATION. RIGHTS AND PERMISSIONS OPEN
ACCESS This article is licensed under a Creative Commons Attribution 4.0 International License, which permits use, sharing, adaptation, distribution and reproduction in any medium or format,
as long as you give appropriate credit to the original author(s) and the source, provide a link to the Creative Commons licence, and indicate if changes were made. The images or other third
party material in this article are included in the article's Creative Commons licence, unless indicated otherwise in a credit line to the material. If material is not included in the
article's Creative Commons licence and your intended use is not permitted by statutory regulation or exceeds the permitted use, you will need to obtain permission directly from the
copyright holder. To view a copy of this licence, visit http://creativecommons.org/licenses/by/4.0/. Reprints and permissions ABOUT THIS ARTICLE CITE THIS ARTICLE Doty, M., Yun, S., Wang, Y.
_et al._ Integrative multiomic analyses of dorsal root ganglia in diabetic neuropathic pain using proteomics, phospho-proteomics, and metabolomics. _Sci Rep_ 12, 17012 (2022).
https://doi.org/10.1038/s41598-022-21394-y Download citation * Received: 29 July 2022 * Accepted: 27 September 2022 * Published: 11 October 2022 * DOI:
https://doi.org/10.1038/s41598-022-21394-y SHARE THIS ARTICLE Anyone you share the following link with will be able to read this content: Get shareable link Sorry, a shareable link is not
currently available for this article. Copy to clipboard Provided by the Springer Nature SharedIt content-sharing initiative