- Select a language for the TTS:
- UK English Female
- UK English Male
- US English Female
- US English Male
- Australian Female
- Australian Male
- Language selected: (auto detect) - EN
Play all audios:
ABSTRACT Investments via the financial system are essential for fostering the green transition. However, the role of existing financial regulations in influencing investment decisions is
understudied. Here we analyse data from the European Banking Authority to show that existing financial accounting frameworks might inadvertently be creating disincentives for investments in
low-carbon assets. We find that differences in the provision coverage ratio indicate that banks must account for nearly double the loan loss provisions for lending to low-carbon sectors as
compared with high-carbon sectors. This bias is probably the result of basing risk estimates on historical data. We show that the average historical financial risk of the oil and gas sector
has been consistently estimated to be lower than that of renewable energy. These results indicate that this bias could be present in other model-based regulations, such as capital
requirements, and possibly impact the ability of banks to fund green investments. SIMILAR CONTENT BEING VIEWED BY OTHERS GREEN FINANCE MARKET AND CARBON NEUTRALIZATION CAPACITY IN CHINA
Article Open access 26 February 2025 DETERMINANTS OF GREEN ENERGY INVESTMENT—FINANCIAL DRIVERS AND EQUITABLE TRANSITION Article Open access 06 April 2025 SAFEGUARDING THE ENERGY TRANSITION
AGAINST POLITICAL BACKLASH TO CARBON MARKETS Article 03 March 2022 MAIN The urgency of climate change has not always been matched by the pace of action by governments. However, increasing
concerns about climate-induced financial instability and stranded assets1,2,3,4,5,6,7,8,9,10,11,12,13,14,15,16,17,18,19 have led some academics and financial regulators to advance a set of
possible policy changes to help catalyse the green transition20,21,22,23,24,25,26,27,28. While various policies aimed at assessing climate-related financial risks—which could possibly
indirectly stimulate the net-zero carbon transition—have become widespread in recent years (for example, climate stress testing, climate-related risk disclosure)29,30,31,32, financial
policies aimed at directly fostering green investments have not always gained traction among policymakers (for example, differentiated capital requirements). Yet, a largely neglected
question in this literature and among policymakers is whether existing financial regulations could be negatively contributing to the net-zero carbon transition. This paper assesses whether
widely used model-based risk regulations might create disincentives for financial institutions to divest their portfolios from high-carbon assets. Such financial regulations have extensively
required banks to use statistical models for assessing firms‘ and investments‘ financial risk for various purposes (for example, financial stability). For example, capital requirements (for
example, Basel III/IV) aim to force banks to hold higher capital buffers for investments that are ‘estimated’ to be riskier. Accounting rules (for example, IFRS9) appraise the ‘fair value’
of outstanding loans on banks’ balance sheets, reducing their net value by the amount of ‘estimated’ expected losses. These regulatory frameworks affect key metrics of financial
institutions, which ultimately influence management incentives and resource allocation33,34,35,36. We focus on financial accounting rules, which are a key driver of the profitability of
banks, and leverage model-based estimates of risk. A key measure in this framework is loan loss reserves (LLR), which is an allowance for potential future losses from outstanding loans. Due
to the structure of double-entry accounting, LLR are liabilities which net the valuation of assets by the amount of their expected losses. Any change in LLR results in loan loss provision
(LLP) charges, which are a ‘present’ cost of the ‘future expected’ credit losses from outstanding loans (ECL). When there is any change in these model-based estimates of risk, banks are
expected to account for any estimated financial losses before they occur. In turn, differentials in any of these estimates may influence banks’ profitability, management behaviour and
resource allocation (see Supplementary Information 4). To examine the impact of such financial accounting rules, we use data from the European Banking Authority (EBA) transparency exercise,
which provides the amount of LLR and outstanding loans of supervised banks in the European Union by economic sector (defined as Nomenclature of Economic Activities (NACE) rev2 level 1). We
combine these data with the results of the EBA risk assessment exercise, which reports the average exposure towards climate policy relevant sectors (CPRS)5 within each NACE level 1 section,
to classify sectors as ‘high carbon’ or ‘low carbon’. We classify sectors with a share of CPRS higher than 95% as high carbon and provide a set of robustness analyses. We are particularly
interested in the ratio of LLR over the value of outstanding loans, which is a proxy of banks’ estimates of expected credit losses. This measure is often called provision coverage ratio
(PCR). Our empirical analysis allows us to observe that model-based estimates of risk are lower for high-carbon sectors compared with low-carbon ones. We then provide an assessment of the
implications of this observation for some key financial metrics of banks if they had to divest from high-carbon assets. Specifically, we utilize the accounting relationships among some of
these metrics to show that an active divestment from high-carbon assets could be costly for banks. We argue that this, in turn, could create perverse incentives impairing the shift of
financial resources from high-carbon to low-carbon assets, possibly including much needed investments in renewable energy. Finally, we provide some possible explanations as to why some of
these models may lead to estimates that are negatively correlated with carbon emissions. RESULTS Our analysis shows that in 2021, the average PCR of banks in the EU was substantially lower
for high-carbon (1.8%) than low-carbon sectors (3.4%), as reported in Table 1. Such a difference has substantial implications for banks’ return on capital and profitability, and therefore
heavily influences management incentives and behaviours. Our analysis shows that this result is consistent for banks of different portfolio sizes and across countries of the banks’
headquarters, with the only exception being Italy. Looking at the results by the size of banks, this effect is exacerbated for smaller financial institutions in absolute terms, but in
relative terms, there is no correlation between the difference in PCR and bank size. This finding is also consistent across countries, regardless of the large variation in terms of absolute
PCR between Nordic and Southern/ Eastern European regions. These results emerge from banks’ statistical models based on historical information as required by the accounting framework.
Standard backward-looking risk models can show a high-carbon portfolio to be relatively low risk, even if there is a possibility of a rapid transition to green energy (see Discussion).
Although it is arguably difficult to take an objective stance on the correct estimate of risk for these investments on a forward-looking basis, our analysis is sufficient to show that the
structure of model-based risk frameworks may have an unintended side effect that is potentially in conflict with the purpose of the regulations or other societal goals. By affecting
financial institutions’ incentives, model-based financial regulations may create perverse outcomes possibly leading to more investments in polluting activities. Simulating the effect of a
divestment from high-carbon activities and a re-investment in low-carbon sectors allows us to better understand the effects of such action on banks’ financial metrics and the linked
management incentives, which ultimately affect behaviours and resources allocation. Specifically, as indicated by the accounting rules, we assume that if a bank had to divest from
high-carbon sectors and re-invest the proceeds in low-carbon sectors, the PCR of such investments would need to increase to the higher level of the latter (Table 1). This would in turn lead
to a higher level of loan loss provisions and higher costs due to the structure of the accounting rules (see Methods). SIMULATION OF A DIVESTMENT STRATEGY Due to the model-based risk
estimates of PCR required by the accounting regulation, the performance of financial institutions would be substantially impacted if they were to swiftly shift their portfolio away from
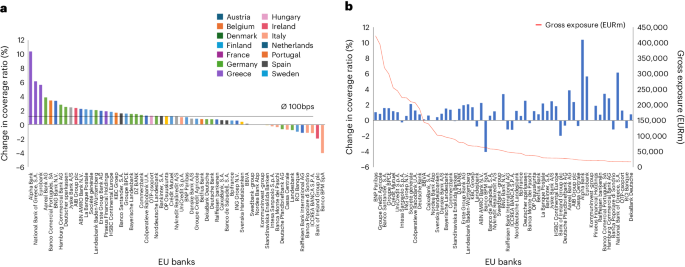
high-carbon to other investments. Our modelling shows that if banks had to stop lending to firms in high-carbon sectors and lend only to low-carbon ones, the portfolio average PCR would need
to increase by more than 100 basis points (1%) across most institutions in the European banking sector (Fig. 1). This effect is consistent for most banks in our sample and across various
nations, except for a few institutions with low PCR for high-carbon assets. Banks in countries with the largest difference in PCR between high-carbon and low-carbon assets would be hit
substantially more according to our analysis. Most financial institutions would be affected by this shift regardless of their size, but in line with our empirical observations, banks in the
smaller size quartile would be impacted more than others (2.35% increase compared with 0.9% simple average). We estimate that a shift in investments away from high-carbon to low-carbon
assets would require a loan-weighted average increase of 35% of LLR for banks in the European Union (Fig. 2). This result is consistent after controlling for bank size and country of
headquarter. The decision to divest from high-carbon assets could lead to more than doubling of provisions for some banks in our sample and could thus have material impacts on the bank’s
stock market valuations. The increase in LLR will not only depend on the difference between the estimated expected loss from lending to low-carbon and high-carbon activities, but also on the
share of high-carbon loans. The higher the share of current outstanding loans towards high-carbon firms, the more pronounced the impact on LLR given a certain level of difference in PCR.
This relationship further exacerbates the potential impact of a divestment for banks more exposed to high-carbon sectors, creating greater hysteresis in investing in high-carbon sectors and
contributing further to the build-up of risk in assets that could become stranded in a green transition. The increased PCR, LLR and the resulting LLP charges driven by a potential divestment
strategy could weigh substantially on banks’ net profits. An increase in LLR not only impacts the liability side of the balance sheet, but also the income statement through decreased
profits. To simulate this effect, we take the absolute increase in loan loss provisions, and we compare it to each bank’s cumulative profits from 2016 to 2020. We select 5 years of profits
to smooth possible bad years or extraordinary items in the financial reporting and to provide a stable baseline for our counterfactual analysis. We estimate that for some banks, the
transition could cost as much as 5 years of profits over the divestment horizon and, on an outstanding loan weighted average basis, 15% of the previous 5 years of profits due to a large
increase in LLR (Fig. 3). The total sum of banks’ lost profits due to the increase in provisions following a divestment from high-carbon assets could be of the order of €28 billion
(considering the 59 largest banks in the European Union). This is only a rough estimate as it does not account for (1) how such divestment could affect other investments in a network of
interconnected banks (indirect effects), (2) whether sufficient alternative investment opportunities are available to the banks or (3) the impact on the costs and prices of alternative
energy generation options resulting from changes in the investments in those options. However, this figure is useful to assess the materiality of our findings. The European Central Bank
(ECB) estimates that the impact of physical risk and transition risk could be around €17 billion and €53 billion, respectively, in a short-term scenario for the 41 largest banks in the
European Union. Although there are a few instances of banks that experience higher profits due to their lower estimate of risk for low-carbon than high-carbon sectors, our results show
consistently that most banks’ profits would be negatively impacted by a divestment from high-carbon assets. Our findings are also robust to the classification of specific sectors as high
carbon. It is the prevalence of the lowest PCR among the high-carbon sectors, in general terms, that drives our key results. We found that relabelling some selected sectors between
high-carbon and low-carbon clusters does not alter the main outcome of our study, although the magnitude of the impact can change (Supplementary Information 1). This sensitivity test
provides us with confidence that sectors with particularly low (high) levels of PCR among the high-carbon (low-carbon) sectors are not driving our results. We then simulate the impact of
allocating each sector partially to the low-carbon and to the high-carbon cluster depending on their median share of CPRS found among banks in the European Union taking part in the EBA risk
assessment exercise. This robustness analysis simulates a partial divestment of only the high-carbon portion of investments in each NACE level 1 and allows us to better investigate the
heterogeneity of high-carbon/low-carbon sectors within each NACE level 1 section. This is because the underlying CPRS classification leverages a much more granular sectoral classification
(NACE level 4), which better captures whether economic activities are high carbon or low carbon. Once again, we find that our main results persist. Moreover, our results are robust after
controlling for different time periods. If we use quarterly average levels from March 2020 to June 2022 (maximum temporal depth of the data), the impacts are similar (100% increase in PCR,
33% increase in provisions, 14% impact on previous 5-years profits). The robustness of our results highlights that our findings are not a function of the specific high-carbon/low-carbon
classification used but driven by a lower average estimated risk for high-carbon sectors compared with low-carbon ones. As long as the structure of the regulation foresees that (1) losses
are costs that are accounted for as expected costs as opposed to incurred costs and (2) provision coverage ratios are proportional to model-based estimates of risk, then divesting from an
‘estimated’ low-risk asset and re-investing in an ‘estimated’ high-risk asset mechanically leads to higher costs in the income statement. Indeed, despite not being able to use carbon
emissions data directly, in our Discussion and Methods, we provide strong evidence for a negative correlation between CPRS/emission intensity of assets and risk estimates (Supplementary Fig.
1). This in turn leads to a confirmation of our conclusion that there probably exists an implicit incentive structure that might inadvertently favour assets involved in high-carbon
activities. DISCUSSION The bias shown towards high-carbon assets identified in this paper probably emerges from the backward-looking nature of risk estimates. That is, it is the outcome of
using models that rely on the historical relationship between a firm’s financial performance and past risk as a predictor of future risk. As discussed in the literature and by policymakers,
such models are useful but may not be well suited to capturing uncertain macro-economic outcomes when there are structural breaks or non-marginal changes in the system, such as the clean
energy transition. In these risk-based models, the creditworthiness of firms is often estimated through financial ratios measuring profitability (for example, Earnings Before Interest, Taxes
(EBIT)/Revenue), solvency (for example, Debt/Asset, Interest/EBITDA (Earnings Before Interest, Taxes, Depreciations and Amortizations)) and liquidity (for example, short-term debt/working
capital). If these ratios have been historically favourable for high-carbon firms, as previous research has highlighted37, risk models will probably produce favourable outcomes for this type
of investment. This phenomenon might arguably limit investments in green assets if their past risk estimates have been relatively high. To illustrate this, we use a simple analysis based on
a dataset of 228 oil and gas, and 235 renewable energy firms worldwide and financial information between 2010 and 2021, retrieved from Bloomberg (Supplementary Information 2). We use this
dataset as a representative sample of some of the most relevant sectors in the high-carbon and low-carbon clusters. We construct some financial ratios that are commonly used in risk
assessment to investigate the origins of risk estimate differentials. We then contrast them to infer the likely relative magnitude between these two important sectors in the net-zero carbon
transition. The average share of interest expenses over EBITDA for the period 2010–2021 is lower for oil and gas (16%) than for renewable energy firms (32%), and the average debt over asset
ratio is lower for oil and gas (31%) than for renewable energy (42%) (Fig. 4a). Similarly, the outcome of one such model retrieved from Bloomberg shows consistently higher average estimates
of risk (expressed in terms of probability of default) for renewable energy than for oil and gas between 2010 and 2021 (Fig. 4b). This highlights how historically, investing in the former
might have been less risky compared with investing in the latter, due to the higher solvency and lower indebtedness. These ratios have been a good proxy of the historical creditworthiness of
firms and have been used extensively by financial analysts. However, problems arise if these historical metrics are not representative of the future, following a change in the probability
distribution of losses38. For example, we estimate that if there were an increase in the average global level of carbon tax enforced on Scope 1 and 2 emissions to US$100 (or climate policies
with an equivalent shadow carbon price), the ratio of interest expenses over EBITDA for oil and gas firms might increase substantially above the ratio of renewable energy companies (from
16% to 46% against 32% for renewable energy). Similarly, a partial write-off of oil reserves valuations in the balance sheet of oil and gas companies of US$20 per barrel might result in an
increase in the debt to asset ratio of these firms, much higher than the average value observed among renewable energy companies (from 16% to 86% against 32% for renewable energy). In such
case, financial ratios and the resulting risk estimates might become lower for renewable energy investments. A more forward-looking framework which includes scenario analyses that consider
climate-related risks might be better suited to capturing such unprecedented emerging risks. In conclusion, our results suggest that model-based financial regulations, and in particular
accounting rules, might disincentivize banks from divesting from high-carbon sectors by directly impacting their profitability. This side effect of the rules might impair the transition
towards net-zero carbon emissions and in turn contribute to increasing the build-up of transition risk in the financial system. Our comparison of financial ratios between oil and gas and
renewable energy firms indicates that this effect might penalize investments in clean energy. Current financial accounting practices might unintentionally hinder the shift of funds required
for the green transition, especially in Europe where these investments are often provided by the banking sector. While the desire to promote a green transition may be based on broader social
objectives that lie beyond the remit of financial regulators, the deeper problem for regulators is that this transition could represent a potential source of systemic risk. Broader research
is needed to determine whether the existing regulations sufficiently account for any such emerging sources of systemic risks that might accompany the green transition. More research is also
needed to shed light on whether this bias might be present in other similar model-based frameworks (for example, capital requirements). Finally, regulators and investors should investigate
risk models that include forward-looking assessments of climate and energy transition risk to ensure that those risks are appropriately incorporated in decisions and to remove any
inadvertent bias. METHODS DATA We used data from the 2021 EBA transparency exercise, which provides portfolio-level information of banks’ gross exposure and accumulated provisions (LLR) by
NACE sector level 1 at the end of June 2021. We used the most recent data, but with additional robustness analysis, ensured that the results do not change using different years (the reader
should note that due to the structure of this modelling, the provision coverage ratios oscillate with time in level but the relative difference across sectors is generally preserved). NACE
is a standard classification of sectors in the European Union. It has various levels of granularity from 1 (least granular) to 4 (most granular), and the EBA transparency exercise relies on
this classification. The exercise is an annual data collection to foster transparency and to complement banks’ own disclosures. The data published includes 111 EU banks across 25 countries
and provides information regarding banks’ assets, liabilities, loan loss provisions and other financial information for each bank. We used the legal entity identifier (LEI) code in the EBA
dataset to complement this information with the historical net profit data from Bloomberg. The data identifiers were matched with each LEI code in our sample through manual research on the
Bloomberg terminal. We started from the largest 60 banks in our sample representing 95% of the total banking exposure, but we excluded one bank because its name and LEI code were missing,
which did not allow us to retrieve their income information. This bank represents ~2% of total EU banking assets. After this manipulation, our dataset covered more than 93% of total banking
loans in the European Union and provided us with LLR, total lending amount for all NACE sectors (level 1) and cumulative net profits from 2016 to 2021 for the largest 59 banks in the EU. A
summary of the sector-level statistics is reported in Supplementary Table 1. HIGH-CARBON SECTORS CLASSIFICATION We added to this dataset the information necessary to classify sectors as high
carbon (that is, sectors with high levels of emission intensity). Specifically, we complemented the data with the results of the EBA Risk Assessment exercise, which provides median values
of CPRS as defined in ref. 5 within each NACE level 1. CPRS is a classification used to assess the exposure of investments to transition risks, including carbon taxation, and is a proxy for
the level of carbon emissions associated with an investment. The exercise was carried out by the EBA and a sample of 29 volunteer banks from 10 countries representing 50% of the total EU
banking assets, with the objective of obtaining a preliminary quantification of the exposure of banks to climate-related risks, particularly focusing on transition risk. The data annex
provided (publicly available) discloses the share of CPRS sectors in each NACE level 1 section according to banks’ classification of their own clients in CPRS. This information is
particularly useful because it allows us to have a more granular labelling of low-carbon and high-carbon sectors than the NACE level 1 (which would not be sufficient to address the
heterogeneity of some sectors). The CPRS rely on NACE level 4, which provides a better discrimination between climate-sensitive sectors and others (additional information provided in
Supplementary Information 2). The bank-level information on total gross loan amount and LLR by NACE code were grouped into high-carbon and low-carbon sectors. We defined sectors as
‘high-carbon’ if they had a median share of CPRS higher than 95%, as reported by banks in the EBA Risk Assessment exercise. This gave us the following high-carbon sectors and their
respective codes: A - Agriculture, forestry and fishing; B - Mining and quarrying; D - Electricity, gas, steam and air conditioning supply; E - Water supply, sewerage, waste management; H -
Transport and storage; and L - Real estate activities. We acknowledge that our approach has limitations, but we extensively tested the robustness of our results to a change in the
methodology used to classify low-carbon and high-carbon sectors (Supplementary Information 1). Moreover, we compared our classification to more granular data reporting emission intensity to
provide transparency about their level of correlation. It should be noted that the banks participating in the climate risk exercise did not include Sweden, Denmark and Norway, but results do
not change if those countries are excluded due to their relatively low materiality in the overall EU banking system. Data availability prevented us from assigning carbon emissions to loans
directly. However, the CPRS classification we used is highly correlated with GHG emissions intensity (Supplementary Fig. 1). The EBA Risk Assessment provides a breakdown of emission
intensity by percentiles for CPRS and non-CPRS. They use individual firms’ GHG emissions from the data provider Trucost (representing 30% of total banks’ loan amount) and a proxy based on
the average GHG emission intensity at NACE rev2 level 4 for the remaining loan amount. Each bank loan is classified in percentiles of emission intensity in a range from very low to very high
(more details could be found in the EBA 2020 Risk Assessment Report, Table 19). We used these data to test the correlation between the share of loan amount in CPRS/non-CPRS and its emission
intensity. There is a clear correlation between the share of loan amount of CPRS and the clusters of emission intensity (Supplementary Fig. 1). Around 85% of the loan amount classified as
having ‘very high’ emission intensity are in CPRS. At the opposite end of the spectrum, only 8% of the loan amount of CPRS are in the ‘very low’ emission intensity bucket. The correlation
between the share of loan amount in CPRS (non-CPRS) and its emission intensity is therefore strongly positive (negative) and around 90% (−90%). In Supplementary Information 1, we show that
this correlation is very unlikely to change with different classifications using a set of robustness analyses. SIMULATION OF A DIVESTMENT STRATEGY Using the data available, we could provide
an estimate of the potential impact of a divestment from high-carbon assets on EU banks’ financials. The primary assumption in this estimation is that the total amount of loans of each bank
is left unvaried. In other words, the simulation assumes that banks shift their lending portfolio directly from high-carbon to low-carbon investments. We also assume that sufficient
low-carbon investments are available for these transactions. The labelling in our data allowed us to calculate the average risk estimate (PCR) of low-carbon and high-carbon sectors for all
banks in our sample. We made use of the accounting relationship between provisions coverage ratio, LLP charges and net profits to assess the impact of a divestment from high-carbon assets on
these metrics (all else being equal). Importantly, we did not rely on an explicit economic model, but on the accounting relationship among these metrics. In turn, our results were generated
by the structure of the regulation as long as a bank divests from a low-PCR asset and re-invests in a high-PCR asset. It should be noted that LLP changes are only the direct effect of this
divestment on bank’s net profit changes at the time they make the investment. This is an expected loss, not necessarily a loss that will occur in the future. More specifically, three
conditions need to be satisfied to generate an increase in costs from a divestment by banks: * 1. Losses are costs that must be accounted for as ‘expected’ as opposed to ‘incurred’. That is,
financial firms must account for any change in the portfolio expected losses, not the actual incurred losses; * 2. Provision coverage ratios must be equal to model-based estimates of
‘expected losses’. That is, expected losses are proportional to measures of risk; * 3. Risk estimates of the asset in which a bank is divesting are lower than the asset in which it is making
a new investment; Conditions (1) and (2) are provided by the structure of the regulation and replicated in the stylized analysis proposed in this paper (see Supplementary Information 4).
Evidence supporting condition (3) is provided in our empirical analysis and further corroborated in the analyses described in the Discussion and Supplementary Information 2. In particular,
from the three conditions above, it emerges that the results of the simulation are grounded on PCR differentials. For this reason, we paid particular attention to demonstrating a negative
correlation between high-carbon sectors and risk measures. More formally, we defined the PCR as the LLR (or accumulated provisions in EBA terminology) divided by the gross exposure for the
high-carbon and low-carbon sectors _i_ for each bank _j_. The PCR represents the expected credit loss (of non-default counterparties) and the corresponding loan loss provisions which banks
must allocate to lending activities in each sector. This measure is assumed to be the model-based output from each institution risk model, in line with the accounting regulation:
$${\rm{PC}{R}}_{i,\,j}=\frac{{{\rm{Loan}\;\rm{loss}\;\rm{reserves}}}_{i,\,j}}{{\rm{Gross}\;{exposur}{e}}_{i,\,j}}.$$ (1) We then calculated the change in the level of LLR following a
divestment from high-carbon assets. This was performed by assuming that all low-carbon loans replacing the high-carbon ones would require the average PCR of existing low-carbon assets. In
other words, a divestment from low-PCR assets and re-investment in high-PCR assets would lead to an increase in the overall average PCR. More formally, the increase/decrease in provision for
bank _j_ is defined as follows: $$\begin{array}{l}{\rm{Loan}\,{loss}\,{provision}\,{charge}{s}}_{j}=\Delta
{\rm{Loan}\,{loss}\,{reserve}{s}}_{j}\\=\left({\rm{PC}{R}}_{{\rm{low-carbon}},\,j}-{\rm{PC}{R}}_{{\rm{high-carbon}},\,j}\right)\times
{\rm{Gross}\,{exposur}{e}}_{{\rm{high-carbon}},\,j}\end{array}.$$ (2) This result provides the expected increase or decrease in provisions if a bank had to shift the totality of its assets
from high-carbon to low-carbon investments. This relationship is an accounting identity defined by the framework. The impact of additional loan loss provisions on a particular bank’s income
statement is considered an LLP ‘charge’ (that is, additional cost) with direct effect on their net profit. In particular, the increase in provisions (that is, the LLP charges) is directly
deducted from net profit, being an additional cost for the bank in the fiscal year of the divestment. This in turn provides a direct estimate of the change in net profits following a
divestment from high-carbon assets. More formally: $${\rm{Net}\,{profi}{t}}_{j,t+1}={\rm{Net}\,{profi}{t}}_{j,t}-{\rm{Loan}\,{loss}\,{provisio}{n}}\,{\rm{charges}}_{j},$$ (3) where _j_
refers to each bank in our sample, _t_ is the starting point period and _t_ + 1 is the period post divestments. Importantly, to simulate the effect of the divestment, we assumed it to occur
entirely in one fiscal year. This divestment would probably be spread across multiple years, but frontloading the entire impact allows us to better investigate the implicit incentive
structure created by the regulation. This simple approach allowed us to simulate what would be the impact of a divestment from high-carbon assets on banks’ balance sheets and income
statements, testing the hypothesis that a potential divestment strategy might be costly, disincentivizing banks from taking such action. DATA AVAILABILITY The data used for the analyses and
the results have been deposited in Zenodo at https://doi.org/10.5281/zenodo.10632853 (ref. 39). Loan data, including loan loss reserves and gross exposure, were extracted from the EBA
transparency exercise website available at this link (https://www.eba.europa.eu/risk-analysis-and-data/eu-wide-transparency-exercise). Financial information, including banks’ profits, and
oil and gas and renewable energy companies’ financials were retrieved from the dataset Bloomberg and can be shared only with Bloomberg’s permission. Source data are provided with this paper.
REFERENCES * Semieniuk, G. et al. Stranded fossil-fuel assets translate to major losses for investors in advanced economies. _Nat. Clim. Change_ 12, 532–538 (2022). Article Google Scholar
* Lamperti, F., Bosetti, V., Roventini, A. & Tavoni, M. The public costs of climate-induced financial instability. _Nat. Clim. Change_ 9, 829–833 (2019). Article Google Scholar *
Mercure, J. F. et al. Macroeconomic impact of stranded fossil fuel assets. _Nat. Clim. Change_ 8, 588–593 (2018). Article Google Scholar * Dietz, S., Bowen, A., Dixon, C. & Gradwell,
P. Climate value at risk’ of global financial assets. _Nat. Clim. Change_ 6, 676–679 (2016). Article Google Scholar * Battiston, S., Mandel, A., Monasterolo, I., Schütze, F. &
Visentin, G. A climate stress-test of the financial system. _Nat. Clim. Change_ 7, 283–288 (2017). Article Google Scholar * Weyzig, F., Kuepper, B., van Gelder, J. W. & van Tilburg, R.
_The Price of Doing Too Little Too Late_ (Green European Foundation, 2014). * D’Orazio, P., Hertel, T. & Kasbrink, F. _No Need to Worry? Estimating the Exposure of the German Banking
Sector to Climate-related Transition Risks_ Ruhr Economic Papers, No. 946 (Leibniz-Institut für Wirtschaftsforschung, 2022). * Battiston, S., Guth, M., Monasterolo, I., Neudorfer, B. &
Pointner, W. _Austrian Banks’ Exposure to Climate-related Transition Risk_ Financial Stability Report 40 (Oesterreichische Nationalbank, 2020). * Campiglio, E. & van der Ploeg, R.
Macrofinancial risks of the transition to a low-carbon economy. _Rev. Environ. Econ. Policy_ 16, 173–195 (2022). * Campiglio, E., Monnin, P. & von Jagow, A. _Climate Risks in Financial
Assets_ (Council on Economic Policies, 2019). * _Climate-Related Financial Risks: A Survey on Current Initiatives_ (BIS, 2020). * Di Virgilio, S., Faiella, I., Mistretta, A. & Narizzano,
S. _Assessing Credit Risk Sensitivity to Climate and Energy Shocks_ (Bank of Italy, 2023). * Caldecott, B., Clark, A., Koskelo, K., Mulholland, E. & Hickey, C. Stranded assets:
environmental drivers, societal challenges, and supervisory responses. _Annu. Rev. Environ. Resour._ 46, 417–447 (2021). Article Google Scholar * Alogoskoufis, S. et al. _ECB’s
Economy-Wide Climate Stress Test_ (European Central Bank, 2021). * Monasterolo, I. Climate change and the financial system. _Annu. Rev. Resour. Econ._ 12, 299–320 (2020). Article Google
Scholar * Roncoroni, A., Battiston, S., Escobar-Farfán, L. O. L. & Martinez-Jaramillo, S. Climate risk and financial stability in the network of banks and investment funds. _J. Financ.
Stabil._ 52, 100870 (2021). Article Google Scholar * Sen, S. & von Schickfus, M. T. Climate policy, stranded assets, and investors’ expectations. _J. Environ. Econ. Manage._ 100,
102277 (2020). Article Google Scholar * Vermeulen, R. et al. The heat is on: a framework for measuring financial stress under disruptive energy transition scenarios. _Ecol. Econ._ 190,
107205 (2021). Article Google Scholar * Gasparini, M., Baer, M. & Ives, M. C. A re-evaluation of the financial risks of the net zero transition. _SSRN_
https://doi.org/10.2139/ssrn.4254054 (2023). * Campiglio, E. et al. Climate change challenges for central banks and financial regulators. _Nat. Clim. Change_ 8, 462–468 (2018). Article
Google Scholar * Dafermos, Y. & Nikolaidi, M. _Greening Capital Requirements_ (Centre for Sustainable Finance, Grantham Research Institute on Climate Change and the Environment, 2022).
* Philipponnat, T. _Breaking the Climate–Finance Doom Loop_ (Finance Watch, 2020). * Bolton, P., Despres, M., Pereira da Silva, L. A., Samama, F. & Svartzman, R. _The Green Swan_ (Bank
for International Settlements, 2020). * Campiglio, E. Beyond carbon pricing: the role of banking and monetary policy in financing the transition to a low-carbon economy. _Ecol. Econ._ 121,
220–230 (2016). Article Google Scholar * Alessi, L., Di Girolamo, F., Pagano, A. & Petracco Giudici, M. _Accounting for Climate Transition Risk in Banks’ Capital Requirements_
(European Commission, 2022). * Dafermos, Y. & Nikolaidi, M. How can green differentiated capital requirements affect climate risks? A dynamic macrofinancial analysis. _J. Financ.
Stabil._ 54, 100871 (2021). Article Google Scholar * Diluiso, F., Annicchiarico, B., Kalkuhl, M. & Minx, J. C. Climate actions and macro-financial stability: the role of central banks.
_J. Environ. Econ. Manage._ 110, 102548 (2021). Article Google Scholar * Dunz, N., Naqvi, A. & Monasterolo, I. Climate sentiments, transition risk, and financial stability in a
stock-flow consistent model. _J. Financ. Stabil._ 54, 100872 (2021). Article Google Scholar * Ameli, N., Kothari, S. & Grubb, M. Misplaced expectations from climate disclosure
initiatives. _Nat. Clim. Change_ 11, 917–924 (2021). Article Google Scholar * Ameli, N., Drummond, P., Bisaro, A., Grubb, M. & Chenet, H. Climate finance and disclosure for
institutional investors: why transparency is not enough. _Clim. Change_ 160, 565–589 (2020). Article Google Scholar * Goldstein, A., Turner, W. R., Gladstone, J. & Hole, D. G. The
private sector’s climate change risk and adaptation blind spots. _Nat. Clim. Change_ 9, 18–25 (2019). * Edwards, I., Yapp, K., Mackay, S. & Mackey, B. Climate-related financial
disclosures in the public sector. _Nat. Clim. Change_ 10, 588–591 (2020). Article Google Scholar * Gropp, R., Mosk, T., Ongena, S. & Wix, C. Banks response to higher capital
requirements: evidence from a quasi-natural experiment. _Rev. Financ. Stud._ 32, 266–299 (2019). Article Google Scholar * Glancy, D. & Kurtzman, R. How do capital requirements affect
loan rates? Evidence from high volatility commercial real estate. _Rev. Corp. Financ. Stud._ 11, 88–127 (2022). Article Google Scholar * Beatty, A. & Liao, S. Financial accounting in
the banking industry: a review of the empirical literature. _J. Account. Econ._ 58, 339–383 (2014). Article Google Scholar * Aymanns, C., Caccioli, F., Farmer, J. D. & Tan, V. W. C.
Taming the Basel leverage cycle. _J. Financ. Stabil._ 27, 263–277 (2016). Article Google Scholar * Schmidt, T. Low-carbon investment risks and de-risking. _Nat. Clim. Change_ 4, 237–239
(2014). Article Google Scholar * Holscher, M., Ignell, D., Lewis, M. & Stiroh, K. _Climate Change and the Role of Regulatory Capital: A Stylized Framework for Policy Assessment_
Finance and Economics Discussion Series 2022-068 (Board of Governors of the Federal Reserve System, 2022). * Gasparini, M. Dataset paper model-based financial regulations impair the
transition to net zero carbon emissions. _Zenodo_ https://doi.org/10.5281/zenodo.10632853 (2024). Download references ACKNOWLEDGEMENTS The project has received no external funding. We thank
P. Tufano (Harvard Business School), C. Hepburn (University of Oxford), J. Stock (Harvard University) and R. Barker (University of Oxford, ISSB) for feedback on this research; the
discussants and participants at the EAERE conference and various people at the European Central Bank (ECB); the International Sustainability Standards Board (ISSB), and the International
Monetary Fund (IMF) for feedback on this research. This paper only reflects the views of the authors. Any organizations they may be affiliated with do not accept any liability for opinions
expressed in it. AUTHOR INFORMATION AUTHORS AND AFFILIATIONS * Smith School of Enterprise and The Environment, University of Oxford, Oxford, UK Matteo Gasparini & Matthew C. Ives *
Institute for New Economic Thinking, University of Oxford, Oxford, UK Matteo Gasparini, Matthew C. Ives & Eric Beinhocker * Grantham Research Institute, London School of Economics,
London, UK Ben Carr * Bloomberg L.P., Enterprise Products, London, UK Ben Carr * Blavatnik School of Government, University of Oxford, Oxford, UK Sophie Fry & Eric Beinhocker Authors *
Matteo Gasparini View author publications You can also search for this author inPubMed Google Scholar * Matthew C. Ives View author publications You can also search for this author inPubMed
Google Scholar * Ben Carr View author publications You can also search for this author inPubMed Google Scholar * Sophie Fry View author publications You can also search for this author
inPubMed Google Scholar * Eric Beinhocker View author publications You can also search for this author inPubMed Google Scholar CONTRIBUTIONS M.G. contributed to conceptualizing the study,
carrying out the analyses and writing of the paper. M.C.I., B.C., S.F. and E.B. contributed to the writing of the paper. CORRESPONDING AUTHOR Correspondence to Matteo Gasparini. ETHICS
DECLARATIONS COMPETING INTERESTS The authors declare no competing interests. PEER REVIEW PEER REVIEW INFORMATION _Nature Climate Change_ thanks the anonymous reviewers for their contribution
to the peer review of this work. ADDITIONAL INFORMATION PUBLISHER’S NOTE Springer Nature remains neutral with regard to jurisdictional claims in published maps and institutional
affiliations. SUPPLEMENTARY INFORMATION SUPPLEMENTARY INFORMATION Supplementary Notes 1–5 and References. SOURCE DATA SOURCE DATA FIG. 1 Results of the analyses starting from the dataset
Gasparini et al. 2024 - input data and reported in Gasparini et al. 2024 - results data.csv. SOURCE DATA FIG. 2 Results of the analyses starting from the dataset Gasparini et al. 2024 -
input data and reported in Gasparini et al. 2024 - results data.csv. SOURCE DATA FIG. 3 Results of the analyses starting from the dataset Gasparini et al. 2024 - input data and reported in
Gasparini et al. 2024 - results data.csv. SOURCE DATA FIG. 4 Results of the analysis starting from the Bloomberg download of financial data on renewable energy and oil and gas companies’
financials. RIGHTS AND PERMISSIONS OPEN ACCESS This article is licensed under a Creative Commons Attribution 4.0 International License, which permits use, sharing, adaptation, distribution
and reproduction in any medium or format, as long as you give appropriate credit to the original author(s) and the source, provide a link to the Creative Commons licence, and indicate if
changes were made. The images or other third party material in this article are included in the article’s Creative Commons licence, unless indicated otherwise in a credit line to the
material. If material is not included in the article’s Creative Commons licence and your intended use is not permitted by statutory regulation or exceeds the permitted use, you will need to
obtain permission directly from the copyright holder. To view a copy of this licence, visit http://creativecommons.org/licenses/by/4.0/. Reprints and permissions ABOUT THIS ARTICLE CITE THIS
ARTICLE Gasparini, M., Ives, M.C., Carr, B. _et al._ Model-based financial regulations impair the transition to net-zero carbon emissions. _Nat. Clim. Chang._ 14, 476–481 (2024).
https://doi.org/10.1038/s41558-024-01972-w Download citation * Received: 26 July 2023 * Accepted: 01 March 2024 * Published: 02 April 2024 * Issue Date: May 2024 * DOI:
https://doi.org/10.1038/s41558-024-01972-w SHARE THIS ARTICLE Anyone you share the following link with will be able to read this content: Get shareable link Sorry, a shareable link is not
currently available for this article. Copy to clipboard Provided by the Springer Nature SharedIt content-sharing initiative