- Select a language for the TTS:
- UK English Female
- UK English Male
- US English Female
- US English Male
- Australian Female
- Australian Male
- Language selected: (auto detect) - EN
Play all audios:
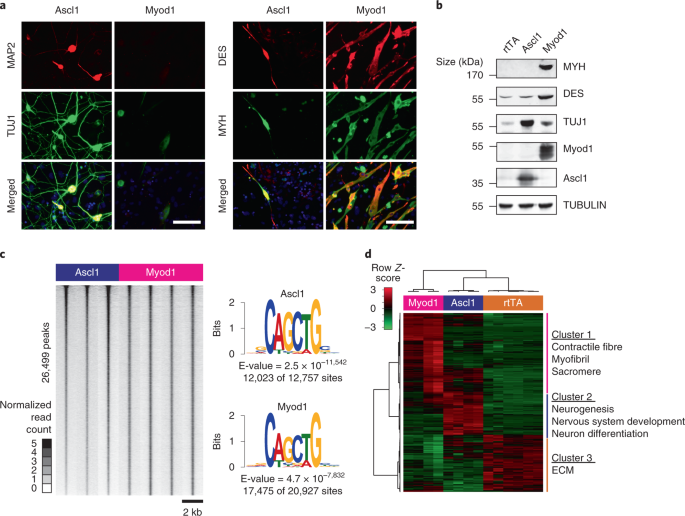
ABSTRACT The on-target pioneer factors Ascl1 and Myod1 are sequence-related but induce two developmentally unrelated lineages—that is, neuronal and muscle identities, respectively. It is
unclear how these two basic helix–loop–helix (bHLH) factors mediate such fundamentally different outcomes. The chromatin binding of Ascl1 and Myod1 was surprisingly similar in fibroblasts,
yet their transcriptional outputs were drastically different. We found that quantitative binding differences explained differential chromatin remodelling and gene activation. Although strong
Ascl1 binding was exclusively associated with bHLH motifs, strong Myod1-binding sites were co-enriched with non-bHLH motifs, possibly explaining why Ascl1 is less context dependent.
Finally, we observed that promiscuous binding of Myod1 to neuronal targets results in neuronal reprogramming when the muscle program is inhibited by Myt1l. Our findings suggest that
chromatin access of on-target pioneer factors is primarily driven by the protein–DNA interaction, unlike ordinary context-dependent transcription factors, and that promiscuous transcription
factor binding requires specific silencing mechanisms to ensure lineage fidelity. Access through your institution Buy or subscribe This is a preview of subscription content, access via your
institution ACCESS OPTIONS Access through your institution Access Nature and 54 other Nature Portfolio journals Get Nature+, our best-value online-access subscription $29.99 / 30 days cancel
any time Learn more Subscribe to this journal Receive 12 print issues and online access $209.00 per year only $17.42 per issue Learn more Buy this article * Purchase on SpringerLink *
Instant access to full article PDF Buy now Prices may be subject to local taxes which are calculated during checkout ADDITIONAL ACCESS OPTIONS: * Log in * Learn about institutional
subscriptions * Read our FAQs * Contact customer support SIMILAR CONTENT BEING VIEWED BY OTHERS H3K9ME SELECTIVELY BLOCKS TRANSCRIPTION FACTOR ACTIVITY AND ENSURES DIFFERENTIATED TISSUE
INTEGRITY Article Open access 04 November 2021 POLY(ADP-RIBOSE) POLYMERASE 1 (PARP1) RESTRAINS MYOD-DEPENDENT GENE EXPRESSION DURING MUSCLE DIFFERENTIATION Article Open access 15 September
2020 SKELETAL MUSCLE DIFFERENTIATION INDUCES WIDE-RANGING NUCLEOSOME REPOSITIONING IN MUSCLE GENE PROMOTERS Article Open access 24 April 2024 DATA AVAILABILITY ChIP–seq, RNA-seq and ATAC-seq
data that support the findings of this study have been deposited in the Gene Expression Omnibus (GEO) under the accession code GSE126414. Previously published RNA-seq data for Figs. 1 and 2
were deposited in GSE43916 and GSE72121; micrococcal nuclease digestion with deep sequencing data for Extended Data Fig. 1d were deposited in GSE40896; ChIP–seq data for endogenous TF
expression in Extended Data Fig. 1f were deposited in GSE48336, GSE55840, GSE21621, GSE44824 and GSE24852; ChIP–seq data for TF overexpression in mESCs (Extended Data Fig. 1e) were deposited
in GSE97715; and ATAC-seq data for Fig. 2 were deposited in GSE101397. All other data supporting the findings of this study are available from the corresponding author on reasonable
request. CODE AVAILABILITY Specific code used for data analysis is available on request. REFERENCES * Vierbuchen, T. & Wernig, M. Direct lineage conversions: unnatural but useful? _Nat.
Biotechnol._ 29, 892–907 (2011). Article CAS PubMed PubMed Central Google Scholar * Takahashi, K. & Yamanaka, S. A decade of transcription factor-mediated reprogramming to
pluripotency. _Nat. Rev. Mol. Cell Biol._ 17, 183–193 (2016). Article CAS PubMed Google Scholar * Xu, J. et al. Direct lineage reprogramming: strategies, mechanisms, and applications.
_Cell Stem Cell_ 16, 119–134 (2015). Article CAS PubMed Google Scholar * Gascón, S., Masserdotti, G., Russo, G. L. & Götz, M. Direct neuronal reprogramming: achievements, hurdles,
and new roads to success. _Cell Stem Cell_ 21, 18–34 (2017). Article CAS PubMed Google Scholar * Chen, Y., Yang, Z., Zhao, Z.-A. & Shen, Z. Direct reprogramming of fibroblasts into
cardiomyocytes. _Stem Cell Res. Ther._ 8, 118 (2017). Article CAS PubMed PubMed Central Google Scholar * Di Stefano, B. et al. C/EBPa poises B cells for rapid reprogramming into induced
pluripotent stem cells. _Nature_ 506, 235–239 (2014). Article CAS PubMed Google Scholar * Zaret, K. S. & Mango, S. E. Pioneer transcription factors, chromatin dynamics, and cell
fate control. _Curr. Opin. Genet. Dev._ 37, 76–81 (2016). Article CAS PubMed PubMed Central Google Scholar * Iwafuchi-Doi, M. & Zaret, K. S. Pioneer transcription factors in cell
reprogramming. _Genes Dev._ 28, 2679–2692 (2014). Article CAS PubMed PubMed Central Google Scholar * Chanda, S. et al. Generation of induced neuronal cells by the single reprogramming
factor ASCL1. _Stem Cell Rep._ 3, 282–296 (2014). Article CAS Google Scholar * Vierbuchen, T. et al. Direct conversion of fibroblasts to functional neurons by defined factors. _Nature_
463, 1035–1041 (2010). Article CAS PubMed PubMed Central Google Scholar * Marro, S. et al. Direct lineage conversion of terminally differentiated hepatocytes to functional neurons.
_Cell Stem Cell_ 9, 374–382 (2011). Article CAS PubMed PubMed Central Google Scholar * Tanabe, K. et al. Transdifferentiation of human adult peripheral blood T cells into neurons.
_Proc. Natl Acad. Sci. USA_ 115, 6470–6475 (2018). Article CAS PubMed PubMed Central Google Scholar * Karow, M. et al. Direct pericyte-to-neuron reprogramming via unfolding of a neural
stem cell-like program. _Nat. Neurosci._ 21, 932–940 (2018). Article CAS PubMed PubMed Central Google Scholar * Chouchane, M. et al. Lineage reprogramming of astroglial cells from
different origins into distinct neuronal subtypes. _Stem Cell Rep._ 9, 162–176 (2017). Article CAS Google Scholar * Wapinski, O. L. et al. Hierarchical mechanisms for direct reprogramming
of fibroblasts to neurons. _Cell_ 155, 621–635 (2013). Article CAS PubMed Google Scholar * Wapinski, O. L. et al. Rapid chromatin switch in the direct reprogramming of fibroblasts to
neurons. _Cell Rep._ 20, 3236–3247 (2017). Article CAS PubMed PubMed Central Google Scholar * Castro, D. S. et al. A novel function of the proneural factor Ascl1 in progenitor
proliferation identified by genome-wide characterization of its targets. _Genes Dev._ 25, 930–945 (2011). Article CAS PubMed PubMed Central Google Scholar * Davis, R. L., Weintraub, H.
& Lassar, A. B. Expression of a single transfected cDNA converts fibroblasts to myoblasts. _Cell_ 51, 987–1000 (1987). Article CAS PubMed Google Scholar * Choi, J. et al. MyoD
converts primary dermal fibroblasts, chondroblasts, smooth muscle, and retinal pigmented epithelial cells into striated mononucleated myoblasts and multinucleated myotubes. _Proc. Natl Acad.
Sci. USA_ 87, 7988–7992 (1990). Article CAS PubMed PubMed Central Google Scholar * Weintraub, H. et al. Activation of muscle-specific genes in pigment, nerve, fat, liver, and
fibroblast cell lines by forced expression of MyoD. _Proc. Natl Acad. Sci. USA_ 86, 5434–5438 (1989). Article CAS PubMed PubMed Central Google Scholar * Yao, Z. et al. Comparison of
endogenous and overexpressed MyoD shows enhanced binding of physiologically bound sites. _Skelet. Muscle_ 3, 8 (2013). Article CAS PubMed PubMed Central Google Scholar * Berkes, C. A.
et al. Pbx marks genes for activation by MyoD indicating a role for a homeodomain protein in establishing myogenic potential. _Mol. Cell_ 14, 465–477 (2004). Article CAS PubMed Google
Scholar * Maves, L. et al. Pbx homeodomain proteins direct Myod activity to promote fast-muscle differentiation. _Development_ 134, 3371–3382 (2007). Article CAS PubMed Google Scholar *
Fong, A. P. et al. Genetic and epigenetic determinants of neurogenesis and myogenesis. _Dev. Cell_ 22, 721–735 (2012). Article CAS PubMed PubMed Central Google Scholar * Treutlein, B.
et al. Dissecting direct reprogramming from fibroblast to neuron using single-cell RNA-seq. _Nature_ 534, 391–395 (2016). * Teif, V. B. et al. Genome-wide nucleosome positioning during
embryonic stem cell development. _Nat. Struct. Mol. Biol._ 19, 1185–1192 (2012). Article CAS PubMed Google Scholar * Casey, B. H., Kollipara, R. K., Pozo, K. & Johnson, J. E.
Intrinsic DNA binding properties demonstrated for lineage-specifying basic helix-loop-helix transcription factors. _Genome Res._ 28, 484–496 (2018). Article CAS PubMed PubMed Central
Google Scholar * Borromeo, M. D. et al. A transcription factor network specifying inhibitory versus excitatory neurons in the dorsal spinal cord. _Development_ 141, 2803–2812 (2014).
Article CAS PubMed PubMed Central Google Scholar * Webb, A. E. et al. FOXO3 shares common targets with ASCL1 genome-wide and inhibits ASCL1-dependent neurogenesis. _Cell Rep._ 4,
477–491 (2013). Article CAS PubMed Google Scholar * Marinov, G. K., Kundaje, A., Park, P. J. & Wold, B. J. Large-scale quality analysis of published ChIP-seq data. _G3_ 4, 209–223
(2014). Article PubMed Google Scholar * Mullen, A. C. et al. Master transcription factors determine cell-type-specific responses to TGF-β signaling. _Cell_ 147, 565–576 (2011). Article
CAS PubMed PubMed Central Google Scholar * Soleimani, V. D. et al. Snail regulates MyoD binding-site occupancy to direct enhancer switching and differentiation-specific transcription in
myogenesis. _Mol. Cell_ 47, 457–468 (2012). Article CAS PubMed PubMed Central Google Scholar * Heinz, S. et al. Simple combinations of lineage-determining transcription factors prime
cis-regulatory elements required for macrophage and B cell identities. _Mol. Cell_ 38, 576–589 (2010). Article CAS PubMed PubMed Central Google Scholar * Davis, R. L. & Weintraub,
H. Acquisition of myogenic specificity by replacement of three amino acid residues from MyoD into E12. _Science_ 256, 1027–1030 (1992). Article CAS PubMed Google Scholar * Davis, R. L.,
Cheng, P. F., Lassar, A. B. & Weintraub, H. The MyoD DNA binding domain contains a recognition code for muscle-specific gene activation. _Cell_ 60, 733–746 (1990). Article CAS PubMed
Google Scholar * Ma, P. C., Rould, M. A., Weintraub, H. & Pabo, C. O. Crystal structure of MyoD bHLH domain-DNA complex: perspectives on DNA recognition and implications for
transcriptional activation. _Cell_ 77, 451–459 (1994). Article CAS PubMed Google Scholar * Weintraub, H. et al. Muscle-specific transcriptional activation by MyoD. _Genes Dev._ 5,
1377–1386 (1991). Article CAS PubMed Google Scholar * Nakada, Y., Hunsaker, T. L., Henke, R. M. & Johnson, J. E. Distinct domains within Mash1 and Math1 are required for function in
neuronal differentiation versus neuronal cell-type specification. _Development_ 131, 1319–1330 (2004). Article CAS PubMed Google Scholar * Chien, C. T., Hsiao, C. D., Jan, L. Y. &
Jan, Y. N. Neuronal type information encoded in the basic-helix-loop-helix domain of proneural genes. _Proc. Natl Acad. Sci. USA_ 93, 13239–13244 (1996). Article CAS PubMed PubMed Central
Google Scholar * Mall, M. et al. Myt1l safeguards neuronal identity by actively repressing many non-neuronal fates. _Nature_ 544, 245–249 (2017). Article CAS PubMed Google Scholar *
Hobert, O. & Kratsios, P. Neuronal identity control by terminal selectors in worms, flies, and chordates. _Curr. Opin. Neurobiol._ 56, 97–105 (2019). Article CAS PubMed Google Scholar
* Ptashne, M. Regulation of transcription: from lambda to eukaryotes. _Trends Biochem. Sci._ 30, 275–279 (2005). Article CAS PubMed Google Scholar * Chronis, C. et al. Cooperative
binding of transcription factors orchestrates reprogramming. _Cell_ 168, 442–459 (2017). Article CAS PubMed PubMed Central Google Scholar * Soufi, A. et al. Pioneer transcription
factors target partial DNA motifs on nucleosomes to initiate reprogramming. _Cell_ 161, 555–568 (2015). Article CAS PubMed PubMed Central Google Scholar * Soufi, A., Donahue, G. &
Zaret, K. S. Facilitators and impediments of the pluripotency reprogramming factors’ initial engagement with the genome. _Cell_ 151, 994–1004 (2012). Article CAS PubMed PubMed Central
Google Scholar * Luna-Zurita, L. et al. Complex interdependence regulates heterotypic transcription factor distribution and coordinates cardiogenesis. _Cell_ 164, 999–1014 (2016). Article
CAS PubMed PubMed Central Google Scholar * Metzakopian, E. et al. Genome-wide characterisation of Foxa1 binding sites reveals several mechanisms for regulating neuronal differentiation
in midbrain dopamine cells. _Development_ 142, 1315–1324 (2015). Article CAS PubMed PubMed Central Google Scholar * Hirai, H. et al. Radical acceleration of nuclear reprogramming by
chromatin remodeling with the transactivation domain of MyoD. _Stem Cells_ 29, 1349–1361 (2011). CAS PubMed PubMed Central Google Scholar * Fong, A. P. et al. Conversion of MyoD to a
neurogenic factor: binding site specificity determines lineage. _Cell Rep._ 10, 1937–1946 (2015). Article CAS PubMed PubMed Central Google Scholar * Bailey, T. L. et al. MEME SUITE:
tools for motif discovery and searching. _Nucleic Acids Res._ 37, W202–W208 (2009). Article CAS PubMed PubMed Central Google Scholar * Ross-Innes, C. S. et al. Differential oestrogen
receptor binding is associated with clinical outcome in breast cancer. _Nature_ 481, 389–393 (2012). Article CAS PubMed PubMed Central Google Scholar * Huang, D. W., Sherman, B. T.
& Lempicki, R. A. Systematic and integrative analysis of large gene lists using DAVID bioinformatics resources. _Nat. Protoc._ 4, 44–57 (2009). Article CAS Google Scholar * Tucker, K.
L., Meyer, M. & Barde, Y.-A. Neurotrophins are required for nerve growth during development. _Nat. Neurosci._ 4, 29–37 (2001). Article CAS PubMed Google Scholar * Marro, S. &
Yang, N. in _Stem Cell Transcriptional Networks. Methods in Molecular Biology (Methods and Protocols)_ Vol. 1150 (ed. Kidder B.) 237–246 (Humana Press, 2014). * Boyer, L. A. et al. Core
transcriptional regulatory circuitry in human embryonic stem cells. _Cell_ 122, 947–56 (2005). Article CAS PubMed PubMed Central Google Scholar * Langmead, B. & Salzberg, S. L. Fast
gapped-read alignment with Bowtie 2. _Nat. Methods_ 9, 357–359 (2012). Article CAS PubMed PubMed Central Google Scholar * Zhang, Y. et al. Model-based Analysis of ChIP-Seq (MACS).
_Genome Biol._ 9, R137 (2008). Article CAS PubMed PubMed Central Google Scholar * Li, Q., Brown, J. B., Huang, H. & Bickel, P. J. Measuring reproducibility of high-throughput
experiments. _Ann. Appl. Stat._ 5, 1752–1779 (2011). Article Google Scholar * Schmieder, R. & Edwards, R. Quality control and preprocessing of metagenomic datasets. _Bioinformatics_
27, 863–864 (2011). Article CAS PubMed PubMed Central Google Scholar * Kim, D. et al. TopHat2: accurate alignment of transcriptomes in the presence of insertions, deletions and gene
fusions. _Genome Biol._ 14, R36 (2013). Article CAS PubMed PubMed Central Google Scholar * Trapnell, C. et al. Transcript assembly and quantification by RNA-Seq reveals unannotated
transcripts and isoform switching during cell differentiation. _Nat. Biotechnol._ 28, 511–515 (2010). Article CAS PubMed PubMed Central Google Scholar * Buenrostro, J. D., Giresi, P.
G., Zaba, L. C., Chang, H. Y. & Greenleaf, W. J. Transposition of native chromatin for fast and sensitive epigenomic profiling of open chromatin, DNA-binding proteins and nucleosome
position. _Nat. Methods_ 10, 1213–1218 (2013). Article CAS PubMed PubMed Central Google Scholar * Pfaffl, M. W., Horgan, G. W. & Dempfle, L. Relative expression software tool (REST)
for group-wise comparison and statistical analysis of relative expression results in real-time PCR. _Nucleic Acids Res._ 30, e36 (2002). Article PubMed PubMed Central Google Scholar *
Sievers, F. et al. Fast, scalable generation of high-quality protein multiple sequence alignments using Clustal Omega. _Mol. Syst. Biol._ 7, 539 (2011). Article PubMed PubMed Central
Google Scholar Download references ACKNOWLEDGEMENTS We thank the Stanford Functional Genomics Facility for sequencing (NIH award S10OD018220) and members of the Wernig and Chang lab for
their ideas and discussions. Support was provided by the National Science Scholarship from the Agency for Science, Technology and Research to Q.Y.L.; the Hector Foundation II and the
European Research Council to M.M.; the National Institutes of Health to T.C.S., H.Y.C. and M.W.; and the California Institute for Regenerative Medicine to H.Y.C. and M.W. H.Y.C. and T.C.S.
are Investigators of the Howard Hughes Medical Institute. M.W. is a Tashia and John Morgridge Faculty Scholar at the Child Health Research Institute at Stanford and a Howard Hughes Medical
Institute Faculty Scholar. AUTHOR INFORMATION Author notes * Qian Yi Lee Present address: Laboratory of Metabolic Medicine, Singapore Bioimaging Consortium, Agency for Science, Technology
and Research, Singapore, Singapore * Soham Chanda Present address: Department of Biochemistry and Molecular Biology, Colorado State University, Fort Collins, CO, USA * Michael S. Kareta
Present address: Genetics and Genomics Group, Sanford Research, Sioux Falls, SD, USA * These authors contributed equally: Qian Yi Lee, Moritz Mall. AUTHORS AND AFFILIATIONS * Department of
Bioengineering, Stanford University, Stanford, CA, USA Qian Yi Lee & Cheen Euong Ang * Institute for Stem Cell Biology and Regenerative Medicine, Department of Pathology, Stanford
University, Stanford, CA, USA Qian Yi Lee, Moritz Mall, Soham Chanda, Bo Zhou, Kylesh S. Sharma, Katie Schaukowitch, Sarah D. Grieder, Michael S. Kareta, Cheen Euong Ang & Marius Wernig
* Cell Fate Engineering and Disease Modeling Group, German Cancer Research Center (DKFZ) and DKFZ–ZMBH Alliance, Heidelberg, Germany Moritz Mall, Juan M. Adrian-Segarra & Sarah D.
Grieder * Hector Institute for Translational Brain Research (HITBR) gGmbH, Heidelberg, Germany Moritz Mall, Juan M. Adrian-Segarra & Sarah D. Grieder * Central Institute of Mental
Health, Medical Faculty Mannheim, Heidelberg University, Mannheim, Germany Moritz Mall, Juan M. Adrian-Segarra & Sarah D. Grieder * Center for Personal Dynamic Regulomes, Department of
Genetics, Department of Dermatology, Howard Hughes Medical Institute, Stanford University, Stanford, CA, USA Soham Chanda, Bo Zhou & Thomas C. Südhof * Center for Personal Dynamic
Regulomes and Howard Hughes Medical Institute, Stanford University, Stanford, CA, USA Orly L. Wapinski, Rui Li & Howard Y. Chang Authors * Qian Yi Lee View author publications You can
also search for this author inPubMed Google Scholar * Moritz Mall View author publications You can also search for this author inPubMed Google Scholar * Soham Chanda View author publications
You can also search for this author inPubMed Google Scholar * Bo Zhou View author publications You can also search for this author inPubMed Google Scholar * Kylesh S. Sharma View author
publications You can also search for this author inPubMed Google Scholar * Katie Schaukowitch View author publications You can also search for this author inPubMed Google Scholar * Juan M.
Adrian-Segarra View author publications You can also search for this author inPubMed Google Scholar * Sarah D. Grieder View author publications You can also search for this author inPubMed
Google Scholar * Michael S. Kareta View author publications You can also search for this author inPubMed Google Scholar * Orly L. Wapinski View author publications You can also search for
this author inPubMed Google Scholar * Cheen Euong Ang View author publications You can also search for this author inPubMed Google Scholar * Rui Li View author publications You can also
search for this author inPubMed Google Scholar * Thomas C. Südhof View author publications You can also search for this author inPubMed Google Scholar * Howard Y. Chang View author
publications You can also search for this author inPubMed Google Scholar * Marius Wernig View author publications You can also search for this author inPubMed Google Scholar CONTRIBUTIONS
Conceptualization: Q.Y.L., M.M. and M.W. Methodology: Q.Y.L., M.M., H.Y.C. and M.W. Software: Q.Y.L. and M.S.K. Formal analysis: Q.Y.L., M.M., M.S.K., S.C., B.Z., K.S. and J.M.A.-S.
Investigation: Q.Y.L., M.M., S.C., B.Z., K.S.S., K.S., J.M.A.-S., S.D.G., M.S.K., O.L.W., C.E.A. and R.L. Writing of the original draft: Q.Y.L. and M.M. Writing, review and editing: Q.Y.L.,
M.M. and M.W. Funding acquisition: M.W. and H.Y.C. Resources: M.W. and H.Y.C. Supervision: T.C.S., H.Y.C. and M.W. CORRESPONDING AUTHOR Correspondence to Marius Wernig. ETHICS DECLARATIONS
COMPETING INTERESTS The authors declare no competing interests. ADDITIONAL INFORMATION PUBLISHER’S NOTE Springer Nature remains neutral with regard to jurisdictional claims in published maps
and institutional affiliations. EXTENDED DATA EXTENDED DATA FIG. 1 BOTH ASCL1 AND MYOD1 BIND THEIR ENDOGENOUS BINDING SITES IN THE CLOSED CHROMATIN CONTEXT IN MEFS. A,B, Heatmap showing
FLAG ChIP-seq normalized read counts ±1 kb around peak summits for reproducible peaks from (A) FLAG–Ascl1 or (B) FLAG–Myod1 expressing MEFs 48 h after dox-induction. Cells expressing only
rtTA alone were used as a control, and the corresponding peaks from FLAG-ChIP of rtTA control samples were plotted next to Ascl1 or Myod1 samples to show specificity of FLAG antibody
pull-down. C, Distribution of Ascl1 (top) and Myod1 (bottom) peaks from (A-B). pro=promoter, enh=enhancer, gt=genetail, int=intergenic. D, Nucleosomal occupancy based on micrococcal nuclease
digestion combined with sequencing (MNase-seq) signal in MEFs26. Higher signal indicates increased protection from MNase digestion by nucleosome and thus decreased chromatin accessibility.
Both Ascl1 (purple) and Myod1(magenta) bind to closed regions compared to the randomized control (orange). E, Heatmap showing ChIP-seq normalized read counts ±1 kb around summits of merged
peaks from FLAG ChIP in FLAG-Ascl1 expressing MEFs (48 h post induction), Ascl1 ChIP in Ascl1 expressing mESC (24 h post induction)27, FLAG ChIP in FLAG-Ascl1 expressing mESCs (48 h post
induction), FLAG ChIPs in FLAG-Myod1 expressing mESCs (24 h27 and 48 h post induction), and FLAG ChIP in rtTA expressing mESC as a negative control. Heatmap was sorted by signal in 48 h mESC
FLAG-Ascl1 ChIP-seq. F, Heatmap showing ChIP-seq normalized read counts ±1 kb around summits of merged peaks from FLAG ChIP in FLAG-Ascl1 expressing MEFs (48 h post induction), endogenous
Ascl1 ChIP in E12.5 neural tubes28 and adult neural progenitor cells29, FLAG ChIP in FLAG-Myod1 expressing MEFs (48 h post induction), and endogenous Myod1 ChIP in differentiating C2C12
cells30,31 and skeletal myoblasts32, sorted by the combined FLAG-Ascl1 ChIP-seq signal. G, Gene ontology terms for clusters of significantly changing genes defined in Fig. 1d using DAVID
v6.852. Source data EXTENDED DATA FIG. 2 DIFFERENTIAL BINDING AFFINITIES OF ASCL1 AND MYOD1 MEDITATE DISTINCT TRANSCRIPTION FACTOR ACTIONS. A,B, Average normalized read counts of all peaks
for (A) H3K27ac ChIP and (B) ATAC-seq in no-virus control (novir), Ascl1 (A1) and Myod1 (MD) samples 48 hr post-TF-induction, separated into Ascl1-enriched, Myod1-enriched and common peaks
(from Fig. 2a). C, Gene ontology of nearest genes associated with a FLAG ChIP-seq peak that fall within the gene promoter or enhancer at Ascl1-enriched, Myod1-enriched and common peaks (from
Fig. 2a) using DAVID v6.852. (D–G) Genome browser tracks showing FLAG ChIP signals and corresponding H3K27ac, ATAC-seq and RNA-seq signals for neurogenic genes, (D) Sox11 and (F) Syn2, and
myogenic genes (E) Klhl41 and (G) Myog. Source data EXTENDED DATA FIG. 3 MOTIF ENRICHMENT AT DIFFERENTIALLY BOUND SITES. A, Reverse search of known motifs at FLAG ChIP peaks, as defined in
Fig. 2a, that are associated with significantly changing genes (fold-change ≥ 1.2, p ≤ 0.05) using HOMER33. Ascl1-enriched and common sites mainly contain bHLH motifs, while Myod1-enriched
sites also contain homeodomains and other motifs. HOMER uses ZOOPS scoring (zero or one occurrence per sequence) coupled with hypergeometric enrichment calculations to determine
significance. (B-C) Examples of (B) bHLH and (C) homeobox motifs that are enriched in differentially bound sites from Fig. 3. EXTENDED DATA FIG. 4 BASIC DOMAIN AND C-TERMINUS OF ASCL1 ARE
SUFFICIENT TO CONFER NEURONAL REPROGRAMMING ABILITY. A-B, Representative immunofluorescence images of cells reprogrammed using indicated (A) Ascl1 and (B) Myod1 domain swap constructs, as
summarized in Fig. 4a, 14 days post TF induction stained with TUJ1 (green), DES (red) and DAPI (blue) (top) or with MAP2 (green), MYH (red) and DAPI (blue) (bottom). Repeated 3 times with
similar results. Scale bar: 100μm. C, Representative immunofluorescence images of cells reprogrammed using Myod1(Ascl1 B+C) domain swaps with various truncations on the Ascl1 C-terminus
stained with TUJ1 (green), MAP2 (red) and DAPI staining (blue). The full-length Ascl1 C-terminus has 66 amino acids and we tested truncations containing 15, 7 or 0 amino acids for their
effect. While reprogramming efficiency is reduced in the C-terminal truncations only 7 amino acids were sufficient to induced Tuj1+/Map2+ neurons. Removing the entire C-terminus abolished
reprogramming activity completely. Repeated 3 times with similar results. Scale bar: 200μm. D, Sequence alignment of mouse Ascl1 (purple) and Myod1 (magenta) using Clustal Omega64 with
highlighted N- and C-terminus as well as basic (B), helix 1 (H1), loop (L), and helix 2 (H2) domains. EXTENDED DATA FIG. 5 FUSING PBX1B TO ASCL1 CONTAINING THE BASIC REGION OF MYOD1 ENHANCES
INDUCTION OF A SUBSET OF MYOD1 TARGET GENES. A, Representative immunofluorescence images of cells 14 days post TF induction using the indicated Ascl1, Ascl1-Pbx1b fusion, Ascl1 (Myod1
B)-Pbx1b fusion or Myod1 constructs, stained with TUJ1 (green), DES (red) and DAPI staining (blue) (top) or stained with MAP2 (green), MYH (red) and DAPI staining (blue) (bottom). While all
constructs containing Ascl1 (Myod1 B) induced the muscle markers DES and MYH, fusion to Pbx1b did not greatly alter the switch to a muscle cell fate. Repeated 3 times with similar results.
Scale bar: 400 µm. B, Mean expression levels of muscle and neuronal marker genes of cells in A determined by qRT-PCR. Fusion of Pbx1b to Ascl1 or Ascl1 (Myod1 B) does not enhance the
expression of muscle markers Des or Myh3. n = 3 biologically independent samples, error bars = SEM, two-tailed Student’s t-test * p < 0.05; ** p < 0.01; *** p < 0.001. C, Mean
expression levels of potential Myod1 and Pbx1b target genes in cells from (A) determined by qRT-PCR. A subset of these genes (Myog, Cdh15, Dysf) increased expression in the Pbx1b-Ascl1
(Myod1 B) condition compared to Ascl1 (Myod1 B) alone (top row). n = 3 biologically independent samples, error bars = SEM, two-tailed Student’s t-test * p < 0.05; ** p < 0.01; *** p
< 0.001. Source data EXTENDED DATA FIG. 6 PRO-NEURONAL ACTIVITY OF MYOD1 UPON CO-EXPRESSION OF MULTI-LINEAGE REPRESSOR MYT1L. A, Representative immunofluorescence images of reprogrammed
cells with MAP2 (red), MYH (green) and DAPI (blue) 14 days after TF-induction. Scale bar: 100 µm. B, Single cell quantification of MAP2+ cells with neuronal morphology (left) and MYH+ cells
(right) in A. n = 3 biologically independent samples. C, Normalized expression levels of neuronal and muscle marker genes 14 days post TF induction, determined by qRT-PCR. n = 3 biologically
independent samples. D, Western blot of reprogramming MEFs in A, two days post TF induction. E, Representative immunofluorescence images of MEFs reprogrammed with either Ascl1+Myt1l+Gfp or
Myod1+Myt1l+Gfp for six weeks on primary mouse glia. Scale bar: 50μm. F, Quantification of the fraction of TUJ1+/GFP+ neurons found in E that are vGAT or VGLUT positive. Violin plots
indicate the median and interquartile range. n = 4 technical replicates. (G,J) Representative immunofluorescence images of reprogrammed MEFs 14 days post Ascl1 (G) or Myod1 (J) induction
together with either Gfp, Myt1l full length, or a non-functional Myt1l (410-623) truncation that contains two DNA binding zinc fingers fused with either an engrailed repressor (EnR) domain
or a VP64-activator (VP64) domain. Scale bar: 100 µm. (H,K) Single cell quantification of TUJ1+ cells with neuronal morphology (green) and DES+ cells (red) in G,J upon addition of Myt1l full
length or Myt1l-EnR fusion constructs to either Ascl1 (H) or Myod1 (K) alone. n = 3 biologically independent samples. (I,L) Western blot of reprogramming MEFs in G,J two days post-induction
of Ascl1 (I) or Myod1 (L) in combination with indicated constructs. All immunofluorescence and western blots were repeated 3 times with similar results, except ED Fig. 6e, which was only
repeated twice; Unprocessed blots ED Fig. 6; For all bar graphs, error bars = SEM, two-tailed Student’s t-test, * p < 0.05, ** p < 0.01; *** p < 0.001. Source data SUPPLEMENTARY
INFORMATION REPORTING SUMMARY SUPPLEMENTARY VIDEO 1 Movie of twitching induced muscle cells using Myod1 or Ascl1(Myod1 B+C). SUPPLEMENTARY TABLES Supplementary Table 1. Quantitative
real-time polymerase chain reaction (qRT-PCR) primers. Supplementary Table 2. List of antibodies. Supplementary Table 3. (1) cDNA sequences for domain swap proteins. (2) cDNA sequences for
Myod1 (Ascl1 B+C) truncation proteins. (3) cDNA sequences for Pbx-fusion proteins. SOURCE DATA SOURCE DATA FIG. 1 c, Normalized read counts for Ascl1 and Myod1 ChIP-seq, ±1 kb around merged
peak summits, sorted by MEF_flagAscl1_r1 ChIP-seq signal. Reads for each sample are binned into 100 windows of 20 bp each. d, Left, log2[FPKM] of all differentially expressed genes (fold
change ≥ 2, FDR ≤ 0.05, with respect to rtTA control) 2 d after TF induction. Right, scaled _Z_-scores for log2[FPKM] values on the left. SOURCE DATA FIG. 1 Unprocessed western blots
(bottom). SOURCE DATA FIG. 2 a, (1) log2[FC] of Ascl1/Myod1 RPKM values summed from +/-100 bp around merged peak summits. Peaks are ordered first by FDR ≤ 0.05 cut-off, then by log2[FC] of
RPKM. Peak classification was performed using FDR and fold changes calculated using Diffbind 2.12.0 (using DEseq2 for differential binding analysis). Peaks are classified into Ascl1-enriched
(FDR ≤ 0.05, FC ≥ 2), Myod1-enriched (FDR ≤ 0.05, FC ≤ −2) and common (all other peaks). (2) log2[FC] of quantile normalized RPKM values for H3K27ac ChIP-seq, summed from ±500 bp around
merged peak summits, over average of MEF controls. (3) log2[FC] of quantile normalized RPKM values for ATAC-seq, summed from ±100 bp around merged peak summits, over MEF control. (4)
log2[FC] of RPKM values of nearest gene with respect to the rtTA controls. FLAG ChIP peaks were associated with a nearest gene, taking only genes with a peak that falls within the promoter
or enhancer regions (between 20 kb upstream and 2 kb downstream from the TSS). c, Average normalized read counts of H3K27ac ChIP-seq in no-virus control, Ascl1 and Myod1 conditions at
Ascl1-enriched, Myod1-enriched and common peaks, including only peaks that are associated with significantly changing genes (fold change ≥ 1.2, _P_ ≤ 0.05). Counts are taken ±1 kb from
merged peak summits, binned into 100 windows. d, Average normalized read counts of ATAC-seq in no-virus control, Ascl1 and Myod1 conditions at Ascl1-enriched, Myod1-enriched and common
peaks, including only peaks that are associated with significantly changing genes (fold change ≥ 1.2, _P_ ≤ 0.05). Counts are taken ±1 kb from merged peak summits, binned into 100 windows.
SOURCE DATA FIG. 4 c, Left, counts of Tuj1+ or Des+ cells per 20× image taken, ten images per biological replicate. Middle, average of Tuj1+ or Des+ cells per 10× field of view in each
biological replicate. Right, mean and s.e.m. of Tuj1+ or Des+ cells in Ascl1, Myod1 or Myod1(Ascl1 B+C) conditions, and pairwise _t_-tests for all three conditions. d, Left, _C_t and d_C_t
(with respect to _Gapdh_) of each individual biological replicate. Right, normalized (% _Gapdh_) expression of _Des_, _Myh_, _Map2_ and _Tuj1_ in no virus (control) and Ascl1, Myod1 and
Myod1(Ascl1 B+C) conditions at 2 d and 14 d post TF induction. SOURCE DATA FIG. 4 Unprocessed western blots (bottom). SOURCE DATA FIG. 5 a–c, Electrophysiological characterization of induced
neuronal cells at 13–14 d post dox induction. a, Fraction of cells firing success and failure action potentials at the 85-pA pulse. b, AP threshold. c, AP height. d–f, Electrophysiological
characterization of induced neuronal cells at 22–24 d post dox induction. d, Fraction of cells firing single or multiple action potentials at 85-pA pulse. e, AP threshold. f, Mean number of
action potentials fired, plotted with respect to pulse amplitude measured at −60 mV holding potential. g, Normalized RPKM values of FLAG–Ascl1, FLAG–Myod1 (Ascl1 B+C) and FLAG–Myod1 FLAG
ChIP-seq. Reproducible peaks from all three conditions were merged. RPKM was calculated based on tag counts within ±100 bp of each peak summit and then normalized. Peaks were sorted by the
fold change between FLAG–Ascl1 and FLAG–Myod1 conditions. SOURCE DATA FIG. 6 b, Average number of indicated marker+ cells counted in 10*10× fields of view in MEFs upon TF induction.
Individual replicates on the top, mean and s.e.m. on the bottom. c, AP firing traces for Ascl1+Gfp or Myod1+Myt1l. _n_ = 8 different cells for both conditions. d, AP threshold (14 d after TF
induction). e, AP height (14 d after TF induction). f, Normalized RPKM values of FLAG–Ascl1, FLAG–Myod1+Myt1l and FLAG–Myod1 FLAG ChIP-seq. Reproducible peaks from all three conditions were
merged and normalized RPKM was calculated based on tag counts within ±100 bp of each peak summit. Peaks were sorted by the fold change between FLAG–Ascl1 and FLAG–Myod1 conditions. SOURCE
DATA EXTENDED DATA FIG. 1 a, FLAG ChIP-seq normalized read counts ±1 kb around peak summits for reproducible peaks from FLAG–Ascl1- or rtTA-expressing cells 48 h after dox induction. Reads
for each sample are binned into 100 windows of 20 bp each. b, FLAG ChIP-seq normalized read counts ±1 kb around peak summits for reproducible peaks from FLAG–Myod1- or rtTA-expressing cells
48 h after dox induction. Reads for each sample are binned into 100 windows of 20 bp each. d, Nucleosomal occupancy based on MNase-seq signal in MEFs. e, ChIP-seq normalized read counts ±1
kb around summits of merged peaks from FLAG ChIP in FLAG–Ascl1-expressing MEFs (48 h post induction), Ascl1 ChIP in Ascl1-expressing mESC (24 h post induction), FLAG ChIP in
FLAG–Ascl1-expressing mESCs (48 h post induction), FLAG ChIPs in FLAG–Myod1-expressing mESCs (24 h and 48 h post induction) and FLAG ChIP in rtTA-expressing mESCs as a negative control.
Reads for each sample are binned into 100 windows of 20 bp each and peaks are sorted by signal in 48 h mESC FLAG–Ascl1 ChIP-seq. f, ChIP–seq normalized read counts ±1 kb around summits of
merged peaks from FLAG ChIP in FLAG–Ascl1-expressing MEFs (48 h post induction), endogenous Ascl1 ChIP in E12.5 neural tubes and adult neural progenitor cells, FLAG ChIP in
FLAG–Myod1-expressing MEFs (48 h post induction) and endogenous Myod1 ChIP in differentiating C2C12 cells and skeletal myoblasts, sorted by the combined FLAG–Ascl1 ChIP-seq signal. Reads for
each sample are binned into 100 windows of 20 bp each. SOURCE DATA EXTENDED DATA FIG. 2 a, Average normalized read counts of all peaks for H3K27ac ChIP in no-virus control, Ascl1 and Myod1
conditions at Ascl1-enriched, Myod1-enriched and common peaks, ±1 kb from merged peak summits, binned into 100 windows. b, Average normalized read counts of all peaks for ATAC-seq in
no-virus control, Ascl1 and Myod1 conditions at Ascl1-enriched, Myod1-enriched and common peaks, ±1 kb from merged peak summits, binned into 100 windows. SOURCE DATA EXTENDED DATA FIG. 5
b,c, Expression levels of muscle and neuronal markers (b), and potential Myod1+Pbx target genes (c) in MEFs upon TF induction. Individual replicates on the left, mean and s.e.m. on the
right. SOURCE DATA EXTENDED DATA FIG. 6 b, Average number of indicated marker+ cells counted in 10 × 10× fields of view in MEFs upon TF induction. Individual replicates on the top, mean and
s.e.m. on the bottom. c, Expression levels of indicated muscle and neuronal marker genes in MEFs upon TF induction. Individual replicates on the top, mean, s.d. and s.e.m. on the bottom. f,
vGlut or vGat costaining of randomly selected GFP+Tuj1+ cells with neuronal morphology upon indicated TF induction in MEFS. Replicates on the left, mean and percentage on the right. h, Ascl1
+ Myt1l full-length/fusion constructs. k, Myod1 + Myt1l full-length/fusion constructs. Average number of indicated marker+ cells counted in 10 × 10× fields of view in MEFs upon TF
induction. Individual replicates on the top, mean and s.e.m. on the bottom. SOURCE DATA EXTENDED DATA FIG. 6 Unprocessed western blots (bottom). RIGHTS AND PERMISSIONS Reprints and
permissions ABOUT THIS ARTICLE CITE THIS ARTICLE Lee, Q.Y., Mall, M., Chanda, S. _et al._ Pro-neuronal activity of Myod1 due to promiscuous binding to neuronal genes. _Nat Cell Biol_ 22,
401–411 (2020). https://doi.org/10.1038/s41556-020-0490-3 Download citation * Received: 17 March 2019 * Accepted: 18 February 2020 * Published: 30 March 2020 * Issue Date: April 2020 * DOI:
https://doi.org/10.1038/s41556-020-0490-3 SHARE THIS ARTICLE Anyone you share the following link with will be able to read this content: Get shareable link Sorry, a shareable link is not
currently available for this article. Copy to clipboard Provided by the Springer Nature SharedIt content-sharing initiative


)