- Select a language for the TTS:
- UK English Female
- UK English Male
- US English Female
- US English Male
- Australian Female
- Australian Male
- Language selected: (auto detect) - EN
Play all audios:
ABSTRACT Stroke, a major cause of disability, disrupts brain function and motor skills. Previous research has mainly focused on reorganization of the motor system post-stroke, but the
effects on other brain areas and their influence on recovery is poorly understood. Here, we use functional neuroimaging in a nonhuman primate model (23 male _Cynomolgus Macaques_), we
explore how ischemic stroke affects whole-brain cortical architecture and its relation to spontaneous behavioral recovery. By projecting patterns of cortical functional connectivity onto a
low-dimensional manifold space, we find that several regions in both sensorimotor cortex and higher-order transmodal cortex exhibit significant shifts in their manifold embedding from pre-
to post-stroke. Furthermore, we observe that changes in default mode and limbic network regions, and not preserved sensorimotor cortical regions, are associated with animal behavioral
recovery post-stroke. These results establish the whole-brain functional changes associated with stroke, and suggest an important role for higher-order transmodal cortex in post-stroke
outcomes. SIMILAR CONTENT BEING VIEWED BY OTHERS FRONTOPARIETAL NETWORK ACTIVATION IS ASSOCIATED WITH MOTOR RECOVERY IN ISCHEMIC STROKE PATIENTS Article Open access 21 September 2022
EXPLORING THE INTERRELATIONSHIP OF INTRA- AND INTER-NETWORK ALTERATION IN MOTOR RECOVERY AFTER STROKE Article Open access 15 April 2025 MULTISCALE GRADIENTS OF CORTICOPONTINE STRUCTURAL
CONNECTIVITY Article Open access 12 May 2025 INTRODUCTION Stroke, a significant public health issue, is a leading cause of adult disability, known to disrupt functional brain networks and
lead to deficits in various neurological domains1,2. The most substantial of these deficits, impaired motor control, is a major obstacle to regaining functional independence post-stroke3,4.
As a result, many survivors face enduring disabilities, reducing their quality of life and requiring long-term care. This not only places a heavy personal burden on patients and their
families but also incurs substantial costs for healthcare systems and society5,6,7,8. After an ischemic stroke, human patients will exhibit a degree of spontaneous behavioral recovery,
believed to stem from the intrinsic rewiring of salvaged brain regions9,10,11,12. Most of this recovery is seen within the first month following the stroke, though notable improvements can
persist for up to a year13,14,15,16. To date, the majority of the work on this spontaneous recovery has tended to focus on the neural reorganization of the motor and premotor
cortices11,17,18,19,20,21,22,23, reflecting the inherent link between motor improvements and spontaneous recovery. However, there is a growing body of research highlighting that changes also
occur outside the motor system, such as in various frontal and parietal regions of transmodal cortex24,25,26,27,28. For instance, some studies have noted stroke-related changes in the
default mode network (DMN), a distributed collection of regions situated at the very apex of the cortical processing hierarchy and neuroanatomically furthest removed from sensory and motor
cortex29,30,31,32. Yet, the implications of these changes in higher-order transmodal cortex, in terms of patient impairment and contribution to spontaneous recovery, remain unclear.
Understanding the neural basis of spontaneous behavioral recovery in an important endeavor, as it not only establishes a baseline to distinguish natural improvements from those due to
interventions, but also holds the potential to identify novel brain targets for rehabilitation and enhance therapeutic strategies. Investigating post-stroke changes in functional cortical
organization in humans is challenging due to variable lesion locations, differences in post-stroke evaluation periods, and diversity in the timelines of behavioral recovery. This raises
important questions concerning how exactly ischemic lesions impact overall cortical functional architecture, and how these changes relate to spontaneous behavioral recovery. Addressing these
questions requires the use of (1) analytical approaches that allow for the characterization of post-stroke changes in patterns of functional activity at the whole-brain level, and (2)
stroke models that mimic the human condition but that also constrain heterogeneity with respect to stroke location and the evaluation timelines. Here, using a well-validated nonhuman primate
model of stroke33, we investigate how widespread cortical functional architecture is altered following a stroke and how these cortical changes relate to natural variation in animal
behavioral recovery. We utilize functional MRI and advanced manifold learning techniques to analyze high-dimensional, whole-brain functional connectivity in a low-dimensional subspace,
uncovering the main patterns of covariance across brain regions34. This analysis approach provides key insights into the core principles that not only govern the activity of large-scale
neural populations in many brain areas35,36,37, but also the intrinsic functional organization of the nonhuman primate and human brain38,39,40,41. Using this manifold learning approach, we
characterize changes in macaque cortical organization from pre- to post-stroke, and examine how these changes relate to the degree of spontaneous behavioral recovery exhibited by the
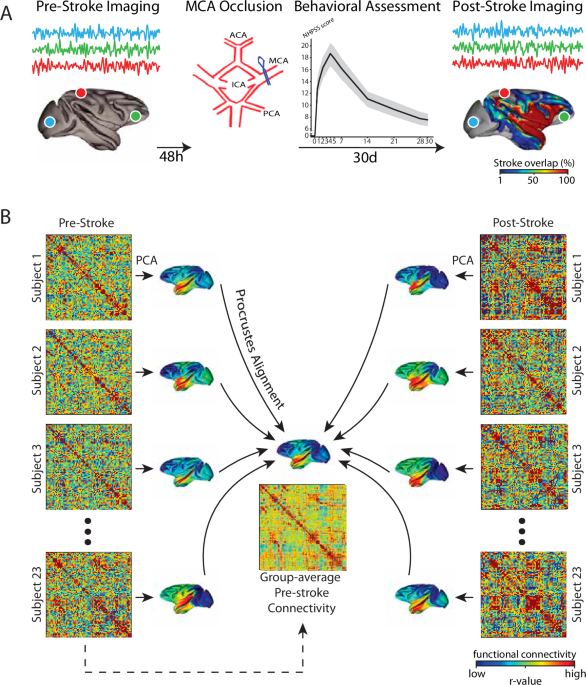
animals. RESULTS In our study, twenty-three _Cynomolgus macaques_ underwent a transient 90-minute right Middle Cerebral Artery Occlusion (MCAO) and had their motor functions tested daily,
using the Non-Human Primate Stroke Scale (NHPSS), for 30 days following the occlusion42. Two days prior to the stroke procedure and at 30 days post-stroke, we performed whole-brain
functional neuroimaging of the macaques, allowing us to uniquely assess stroke-related changes in functional brain architecture. Prior to the MCAO procedure, all macaques displayed typical
healthy behaviors. Following stroke, the NHPSS evaluation showed a progressive increase in neurological severity score from the first evaluation (24 h post-MCAO) to its peak score at 4th-day
post-MCAO, and then showed a progressive decrease until it became stable at the 28th and 30th-day post-MCAO (Fig. 1A). This recovery profile in our animals mimics the typical recovery
trajectory observed in human stroke patients33,43,44,45,46. For our functional MRI analyses, we extracted mean blood oxygenation level-dependent (BOLD) time series data for 177 cortical
regions defined by the 278-region NMT v2.0 normalized Cortical Hierarchy Atlas of the Rhesus Macaque (CHARM atlas47,48). Note that any region that was affected by stroke was subsequently
removed from analysis, thus, only 177 cortical regions remained (43 in the right hemisphere, and 134 in the left hemisphere). Next, we then estimated separate functional connectivity (FC)
matrices for each pre- and post-stroke resting-state scan using the covariance matrix of the timeseries (see Fig. 1). To examine reconfigurations of cortical connectivity following MCAO, we
took the FC matrices and estimated separate cortical connectivity manifolds for each animal’s pre-stroke and post-stroke scans. Using established procedures34,49, each matrix was first
transformed into an affinity matrix by computing the pairwise cosine similarity between regions after row-wise thresholding (see Methods). Then, we applied principal components analysis
(PCA) to obtain a set of principal components (PCs), i.e., manifold, that provides a low-dimensional representation of cortical functional organization. We then aligned each manifold to a
‘template’ pre-stroke manifold, which we constructed using the mean of all pre-stroke FC matrices across animals (see Fig. 1). Importantly, this alignment to the pre-stroke template served
two interrelated purposes. First, it provided a reference target for manifold alignment, thus allowing all animals and scans to be directly compared within a common neural space34. Second,
it provided a direct means of assessing post-stroke _changes_ in cortical connectivity with respect to this baseline, pre-stroke cortical architecture. CHANGES IN CORTICAL MANIFOLD STRUCTURE
FROM PRE- TO POST-STROKE The top three principal components (PCs) of the pre-stroke template manifold (Fig. 2A, left column) elucidates main features of whole-brain cortical functional
organization prior to stroke. These PCs situate regions that have similar patterns of whole-brain functional connectivity in close proximity to one another along a given connectivity
gradient (e.g., regions in red for PC1 have more similar patterns of connectivity to one another, and vice versa for blue regions). Essentially, this dimension reduction approach allows for
the visualization of the macroscale functional connectivity patterns that describe the largest amounts of variance in the resting-state data. In this analysis, PC 1 separates lateral and
medial temporal regions (in red) from medial parietal areas (eg., PCC, in blue)41. PC 2 illustrates a gradient differentiating medial frontal and anterior temporal cortical regions (in red)
from the medial parietal regions (in blue), and PC 3 illustrates a gradient separating anterior temporal regions (in red) from medial frontal regions (in blue, Fig. 2A, left). These top
three PCs collectively explain 50.1% of the total variance (Fig. 2B). [We should note that although we only retained the top three PCs for our further analyses, it is important to highlight
that the inclusions of PC 4 and PC 5, which explains 10.7% and 7.8% variance, respectively, does not change our overall results and interpretations; See supplemental Fig. 1]. Together, the
top 3 PCs of the baseline, pre-stroke cortical manifold describe the main sources of variance in intrinsic functional brain architecture, mainly differentiating the patterns of connectivity
of the temporal, frontal and parietal cortex (Fig. 2A, left). When compared to the pre-stroke connectivity gradients, we found that the post-stroke gradients exhibited much stronger loadings
onto the individual PCs. For instance, for regions that exhibited the highest absolute component scores in PCs 1-3 pre-stroke (regions in dark red and blue in the left column of Fig. 2A),
we observed that these same regions tended to now exhibit even higher component scores post-stroke (i.e., even darker red and blue colors, Fig. 2A right column). In addition, for many of the
PCs, areas exhibiting the highest component loadings also tended to increase in number following stroke (compare left and right columns in Fig. 2A). For instance, for post-stroke PC1, the
negative loading (in blue) of regions along the PCC extended to include more anterior regions, into the mid cingulate cortex; and similarly, for post-stroke PC2, the negative loading of the
PCC (in blue) expanded posteriorly to now encompass the entirety of visual cortex. For a direct statistical comparison of the changes in regional loadings for each PC, see Supplemental Fig.
2). These noticeable changes in regional loadings become more obvious when plotting individual brain regions in the three-dimensional manifold space (Fig. 2C), whereby the location of each
brain region is dictated by its loading onto each component axis. As can be clearly seen in Fig. 2C, several brain regions, particularly those belonging to the DMN and limbic networks,
exhibited large shifts in their manifold embedding from pre- to post-stroke. Importantly, these shifts in manifold embedding do not appear to be simply attributed to noise. A formal analysis
of the temporal signal to noise ratio (tSNR) across networks revealed no significant differences from pre- to post-stroke. Specifically, the tSNR within the regions with the largest shifts
in manifold embedding including the DMN (_t_ = 0.269, _p_ = 0.79) and limbic networks (_t_ = 0.233, _p_ = 0.81) did not show any significant changes, nor did any other network (_p_»>0.05;
see Supplemental Fig. 3). In order to better characterize these shifts in manifold embedding from pre- to post-stroke, we sought to quantify the relative positioning of individual brain
regions within the cortical manifold space. Following from prior work50,51,52, this led us to calculate the Euclidean distance of each brain region from the manifold centroid (i.e.,
coordinates [0,0,0]; see methods), a region-based metric referred to as ‘eccentricity’. Through this eccentricity metric, we obtain a multivariate index of each brain region’s embedding in
the cortical manifold space, whereby regions situated at the manifold periphery have a larger eccentricity compared to those regions located near its core (Fig. 3A). Under this convention,
regions with _higher_ eccentricity, located along the periphery of the manifold, are intuitively more functionally _segregated_ from other networks, whereas regions with a _lower_
eccentricity, located near the manifold center, are intuitively more functionally _integrated_ with other networks. Consistent with this interpretation, we observed strong linear
relationships between this eccentricity metric and conventional graph theoretic measures of network integration and segregation (see Supplementary Fig. 4). Thus, a brain region’s change in
eccentricity along the manifold provides us with a single scalar measure effectively capturing that region’s change in network integration versus segregation post-stroke (Fig. 3B). To
examine which brain regions exhibited significant changes in cortical manifold eccentricity from pre- to post-stroke, we performed a paired t-test for each brain region between the two
timepoints (Post > Pre), and corrected for multiple comparisons using a false-discovery rate correction (FDR; _q_ < 0.05). Figure 3C and D shows the results of this direct contrast,
revealing significant increases in the eccentricity of 88 different brain regions, including contralesional (left) superior parietal, somatomotor and ventral premotor cortex, as well as in
several bilateral higher-order transmodal cortical areas. With respect to the latter, we observed particularly prominent post-stroke increases in brain areas belonging to the DMN and limbic
networks, such as the bilateral PCC, OFC, and anterior and medial temporal cortex. Consistent with this visual observation, we found that brain regions that exhibited the largest average
changes in their manifold embedding tended to lie within the DMN and limbic networks (Fig. 4A). According to prior studies, brain regions that comprise the DMN and limbic networks are
positioned at the very apex of the cortical processing hierarchy, which extends from lower-order unimodal sensory and motor areas to higher-order regions in transmodal cortex41. Consistent
with this interpretation, the DMN and limbic networks have been shown to (1) exhibit less myelination, thus allowing for greater synapse formation and experience-dependent plasticity53, and
(2) have a higher density of neurotransmitter receptors per neuron, thus allowing for greater cognitive flexibility54,55; see Fig. 4B). Given these observations, we naturally wondered
whether the regional changes in manifold structure that we observed following stroke (in Fig. 3D) might relate to differences in the distribution of myelin content and the density of
neurotransmitter receptors across cortex. To explore this, we tested for a spatial correlation across brain regions between the t-statistic reflecting with the change in eccentricity from
Pre- to Post-stroke versus each of the following: (1) a macaque brain map capturing regional differences in cortical56,57 and, (2) a macaque brain map that captures total neurotransmitter
receptor density per neuron (receptor gradient 1;54). The results of these analyses are shown in Fig. 4B. As can be seen in these plots, brain regions that exhibited a larger, more
significant change in manifold eccentricity from Pre to Post-stroke were associated both with lower myelin content and with a greater density of neurotransmitter receptors. We address the
implications of these important results in our Discussion. One potential alternative explanation of the above results is that, instead of reflecting a stroke, the manifold changes might
simply reflect unrelated changes in manifold structure over time and/or a byproduct of the manifold alignment procedure (e.g., the Procrustes alignment of the Post-stroke scans to the
Pre-stroke scan). To address this possibility, we obtained a separate imaging dataset recently collected at our research facility (for a separate study) in which 13 neurologically healthy
male _Cynomolgus macaques_ underwent scanning at two separate time points, 90 days apart. In this separate NHP sample we performed the identical set of analyses and aligned each animals’
whole-brain manifolds to the Pre-stroke scans from the current data set. We then performed region-wise paired-samples t-tests to test for the change in eccentricity between the 0 day and 90
day timepoints (see Supplementary Fig. 6). The results of this analysis did not identify any significant changes in eccentricity over the 90 days, indicating that the current findings (in
Fig. 3D) are likely to reflect changes in cortical organization due to the stroke. CONNECTIVITY CHANGES UNDERLYING THE POST-STROKE MANIFOLD RECONFIGURATION While significant shifts in the
eccentricity of an individual brain region reflect alterations in its overall connectivity pattern, this metric does not clarify which specific aspect of its connectivity has undergone
change. That is, although changes in eccentricity are indicative of a change in how a brain region functionally interacts with other areas, it does not reveal the precise nature of these
connectivity alterations. To address this particular question, we conducted seed connectivity analyses to detail the pre- to post-stroke connectivity alterations for representative brain
regions—in the PCC, OFC—that had demonstrated notable increases in eccentricity. For each region, we performed paired t-tests on the seed connectivity maps between pre- and post-stroke
(i.e., Post > Pre), which produced contrast maps for each seed region (Fig. 3D). Note that in order to illustrate the full pattern of connectivity changes that underlie the eccentricity
effects (as eccentricity is a multivariate measure), we elected to simply show the unthresholded contrast maps. For the right PCC seed region, associated with the DMN, we observed the most
prominent post-stroke increases in connectivity with bilateral posterior and mid cingulate regions, as well as several frontal regions of the DMN (Fig. 5, left). By contrast, the most
prominent post-stroke decreases in connectivity for the PCC were observed with the left DLPFC of the frontoparietal Control network and right subgenual cortex of the limbic network.
Together, these results suggest that the post-stroke manifold expansion of the PCC arises from its increased connectivity with several other DMN areas (i.e., segregation of the DMN) and
relatively decreased connectivity with other distributed brain networks. For the right subgenual cortex seed region, associated with the limbic network, we observed the most prominent
post-stroke increases in connectivity with bilateral orbitofrontal cortical regions of the limbic network (Fig. 5, middle). By contrast, the most prominent post-stroke decreases in
connectivity were observed with the bilateral medial posterior and mid-cingulate cortical regions, and sensorimotor cortical regions more broadly. Consistent with the results of PCC above,
these results suggest that the post-stroke manifold expansion of subgenual cortex results from its increased connectivity with other limbic areas (i.e., segregation of the limbic network)
and its decreased connectivity with other brain networks. Finally, for the left medial frontal pole, located in the DMN, we found that this region exhibited its most prominent post-stroke
increases in connectivity with bilateral frontal regions. (Fig. 5, right). By contrast, its most prominent decreases in connectivity were observed with left sensorimotor regions and right
medial and lateral ventrotemporal regions of the visual network. Consistent with above, these results suggest that the post-stroke manifold expansion of medial frontal pole results from its
increased connectivity with other medial frontal regions (i.e., segregation of DMN) and its decreased connectivity with other networks. Collectively, the results of our seed connectivity
analyses above are consistent with the interpretation that the cortical manifold expansion observed post-stroke generally reflects increases in _within_-network connectivity and decreases in
_between_-network connectivity (i.e., network segregation). SPONTANEOUS BEHAVIORAL RECOVERY FOLLOWING STROKE AND ITS RELATION TO CHANGES IN CORTICAL MANIFOLD STRUCTURE In examining changes
in the manifold structure from pre- to post-stroke, we have thus far considered the mean changes across all individuals. It is widely recognized, however, that individual differences in the
trajectories of stroke recovery are substantial58,59,60. Although the group-averaged recovery curve depicted in Fig. 1A suggests a stereotypical rapid increase and subsequent gradual
decrease in NHPSS across the 30 days, this representation obscures significant intersubject variability. For example, Fig. 6B illustrates the learning trajectories of all subjects,
highlighting two distinct cases—one individual who exhibits a relatively small increase in NHPSS scores and subsequently better recovery (green trace) and another individual who exhibits a
strikingly large increase in NHPSS scores and a subsequently poorer recovery (red trace). The pronounced variability in recovery trajectories across individuals prompted us to identify a
single recovery measure that could adequately encapsulate these individual differences in recovery profile, and thus simplify our examination of the relationships between manifold changes
and behaviour. On this point, a particularly salient feature of individuals’ learning curves is their temporal autocorrelation; i.e., individuals who exhibit good recovery at 30 days (prior
to the post-stroke scan) are also the same individuals who exhibit relatively smaller increases in NHPSS score immediately following the stroke (i.e., within days 1–5; see Fig. 6B). This
temporal covariation results in a strong positive correlation between NHPSS scores obtained immediately following the stroke with those obtained at 30 days (see correlation matrix in Fig.
6C). Importantly, this covariation in time series data lends itself well to temporal dimension reduction techniques, such as functional principal component analysis (fPCA), which are able to
extract the dominant patterns of covariation across time61. Building on our previous work using these techniques52,62, we employed fPCA on the recovery trajectories across animals (see
Methods for details). The fPCA revealed that a single component—representing overall recovery—accounted for the majority (88%) of the variability in animals’ recovery curves (Fig. 6D). We
thus utilized individuals’ scores on this primary component as a singular measure describing their overall recovery profile across the 30 days. [Note that the two subjects exemplified in
Fig. 6B, are actually those with the lowest (in green) and highest (in red) loadings on the fPCA component]. In sum, our application of fPCA allowed us to distill complex, time-varying
patterns of individuals’ NHPSS scores over the 30 days into a single metric that effectively describes their spontaneous behavioral recovery profile. Next, we divided the animals into two
recovery groups—a good and poor group—based on a median split of their z-scored fPCAscores. Under this division, animals with fPCA scores below the median were considered to have good
recovery (_N_ = 11; −0.87 +/−0.14; Fig. 6D), whereas animals with scores above the median were considered to have poor recovery (_N_ = 12; 0.797 +/− 0.18; Fig. 6D). To examine whether these
group differences in spontaneous behavioral recovery were related to any of the statistically significant changes in regional eccentricity that we observed from pre- to post-stroke (in Fig.
3D), we performed a series of independent sample t-tests between the two recovery groups (Good > Poor), and then corrected for multiple comparisons using the FDR correction (_q_ <
0.05). This analysis revealed that 17 of the 88 regions had a significant group (good versus poor) effect, with all of these regions being located within the ipsi- and contra-lesional
posteromedial cortex (PCC and precuneus) and medial frontal cortex, particularly the OFC region (Fig. 7). Notably, the direction of this effect for each significant region was such that the
increase in post-stroke eccentricity was on average greater in the poor recovery group than the good recovery group (Fig. 7B). This indicates that, in the good recovery group, the
aforementioned brain regions (PCC and OFC) were relatively more integrated (i.e., less eccentric) post-stroke compared to the poor recovery group. To our surprise, we did not observe any
relation to animals’ behavioral outcomes in areas of premotor and somatomotor cortex, which we had also identified as having significantly changed in eccentricity post-stroke (see Fig. 3D
for reference). The results of the above analyses naturally beg the question as to the key differences in functional connectivity patterns of PCC and OFC regions that may account for the
observed group differences (good versus poor recovery). To investigate this, we performed independent sample t-tests between the two groups on the pre- to post-change in connectivity of
representative seed regions from Fig. 7A, and then corrected for multiple comparisons using FDR correction (_q_ < 0.05). For the left PCC seed region, we found that the good group had
significantly higher post-stroke connectivity with several distributed brain regions including areas in the left medial frontal gyrus, dorsomedial and dorsolateral prefrontal cortex, right
medial and ventrolateral prefrontal cortex, and bilateral anterior temporal cortex (see all red areas in Fig. 7C). By comparison, we observed that the poor recovery group only had higher
post-stroke connectivity in the right dorsomedial prefrontal cortex (see blue area in Fig. 7C). Likewise, for the left subgenual seed region, we found that the good group had significantly
higher post-stroke connectivity across several distributed regions including the left superior parietal cortex, lateral somatomotor cortex, DLPFC and anterior temporal cortex, as well as
bilateral posteromedial cortex, retrosplenial cortex and visual cortex (see all red areas in Fig. 7D). By comparison, we observed that the poor recovery group only had higher post-stroke
connectivity in the left temporal cortex and right dorsomedial prefrontal cortex (see blue regions in Fig. 7D). Note that when we averaged the changes in connectivity across the different
significant regions for each of the PCC and OFC seed regions we found that, whereas in the poor group, these regions reflected an average decrease in connectivity with respect to the
Pre-stroke scan (connectivity below zero), for the good group, these regions reflected an average increase in connectivity with respect to the Pre-stroke scan (connectivity above zero). That
is, the connectivity of these different regions highlighted in Fig. 7C and D were increased in the good group following the stroke. Taken together, these seed-based results suggest that the
success of animals’ post-stroke behavioral recovery was related to increases in the integration of PCC and OFC areas with other brain areas; that is, animals that had better post-stroke
outcomes (good group), tended to exhibit greater, and much more extensive connectivity between these PCC and OFC areas with other distributed brain areas. Finally, although prior studies
have indicated that lesion size is a relatively poor predictor of stroke outcomes63,64, we wondered whether the above group effects could be partially explained as a consequence of
differences in the size of ischemic lesions. To assess this, we calculated the average stroke volume of each recovery group and tested for significant differences in lesion size using an
independent sample t-test. We observed no significant differences in lesion size between the good and poor recovery groups (t(22) = −1.63, _p_ = 0.116; see Supplementary Fig. 5).
Furthermore, we observed no significant correlations between lesion size and the change in eccentricity for any single brain region (Supplementary Fig. 5), indicating that differences in
functional recovery, and the associated changes in brain connectivity patterns, cannot be solely explained as a difference in total stroke volume. Rather, the findings indicate that the
degree of post-stroke functional changes in transmodal cortical regions (e.g., PCC and OFC in particular) may be an important biomarker of spontaneous behavioral recovery. DISCUSSION After a
stroke, the brain undergoes a process of functional reorganization as it attempts to compensate for the damage incurred following ischemia. Understanding this functional reorganization in
human populations is inherently difficult, not only given the heterogeneity in naturally occurring strokes and the timeline over which individuals are typically assessed, but also the
inability to perform direct comparisons to an individual’s pre-stroke brain. Here we leveraged a well-established nonhuman primate stroke model to elucidate key impacts of ischemia on
functional cortical organization, and how these relate to differences in spontaneous behavioral recovery. Using a manifold learning approach to characterize changes in the landscape of
whole-brain activity from pre- to post-stroke, we found that regions broadly within sensorimotor cortex and higher-order transmodal regions of the DMN and limbic networks exhibited
significant expansion along the cortical manifold, reflecting their increased segregation from other cortical brain networks. When we separated individuals into two groups based on their
recovery outcomes (good versus poor), we found that it was changes in connectivity of transmodal areas, and not preserved sensorimotor regions, that was associated with differences in
spontaneous recovery. Specifically, we found that the less DMN and limbic areas altered their connectivity patterns post-stroke, the better individuals were able to behaviorally recover.
Together, these findings suggest that changes in the connectivity of transmodal cortex, in particular, play an important role in behavioral outcomes post-stroke. As an improvement in
patients’ motor control is the defining hallmark of spontaneous behavioral recovery, it is understandable that previous studies have tended to focus on the role of motor-related brain
regions (e.g., primary and premotor cortex) in driving this recovery process11,17,18,19,20,21,22,23. It is crucial to note that our findings do not contradict this perspective. Indeed, it is
expected that the ipsilesional motor and premotor cortices will have played substantial roles in the recovery of our animals. However, the nature of our analysis, which involved
inter-subject manifold alignment, required excluding any brain regions affected by stroke in any single animal, leading to a broad stroke mask (see Fig. 2A), and thus the omission of many
ipsilesional regions. Consequently, our findings are unable to speak to the nature of functional reorganization in these areas or the neighboring penumbra, known to aid in recovery65,66,67.
Nevertheless, our findings indicate that _differences_ in subject recovery are not actually related to changes in the connectivity of preserved sensorimotor areas, like those in the
contralesional hemisphere. This is an important observation, as several studies have suggested a prominent role for the contralesional sensorimotor cortex in stroke recovery68,69,70,71.
Rather, our findings suggest that individual differences in subject recovery are actually related to the connectivity of DMN and limbic brain areas (i.e., PCC and OFC). In the context of
prior work, this finding is noteworthy, as these regions—and transmodal cortex more generally—are thought to act as key hubs for cortical integration and behavioral
flexibility39,41,72,73,74. According to contemporary perspectives on functional brain organization, the DMN and limbic networks sit atop a global processing hierarchy that extends from
lower-order brain systems in primary, unimodal cortex (visual and somatomotor networks) to higher-order brain systems situated in multi-modal, transmodal cortex29,75,76,77,78,79. Congruent
with this viewpoint, DMN and limbic areas differ anatomically from sensory and motor systems in important ways. First, in both humans and macaques, these areas have a much higher density of
neurotransmitter receptors per neuron54,55. This presumably allows these regions to contribute to more complex cortical functions, and flexibly integrate information across distributed
sources54,55. Second, DMN and limbic areas contain significantly less myelin compared to unimodal cortical areas41,54,55 but display larger dendrites, and far more intricate patterns of
dendritic branching and arborization80,81. Given that myelin inhibits synapse formation53, such complexity is thought to enhance their potential for neural plasticity53,82,83, such as when
the cortex faces damage or trauma. Notably, when we directly compared the cortical changes following stroke to brain maps of these different structural features, we found that the regions
that exhibited the largest changes Post-stroke were also regions that tended to exhibit both higher receptor density and lower levels of myelination. One interpretation of these results is
that these structural features of the DMN and limbic networks—i.e., the convergence of different neurotransmitter signals, their dendritic complexity, and their lower myelin content—make
these regions particularly susceptible to severe brain trauma. A compelling alternative interpretation is that these structural features might make these brain areas more adaptable and
capable of re-organizing their neural connections in response to damage, which in turn might facilitate recovery and compensation. As our current results are compatible with both
interpretations, future work will be required to disentangle these different possibilities. Notably, while many neuroimaging studies on stroke have highlighted connectivity alterations in
unimodal cortex18,26,84,85,86, a few studies have also revealed substantial post-stroke modifications in the activity and connectivity of transmodal cortical regions, such as the
DMN29,30,31,32. To date, these studies have mainly associated alterations in DMN activity with changes in cognitive function post-stroke, as assessed through standardized cognitive
assessments29,30,31,32. Our current study, by contrast, links changes in DMN connectivity to differences in spontaneous motor recovery. This notion that the DMN may contribute to action
control is not new. Indeed, prior neurophysiological evidence from macaques has indicated that DMN activity enhances action task performance, particularly in instances where performance is
initially poor87,88,89,90,91,92,93,94. These studies have shown, for example, that DMN neurons play an active role in forming behavioral strategies during tasks94, thus helping to guide
subsequent behavioral adjustments. Other work in humans using functional neuroimaging supports this general idea, showing that motor performance during early learning relates to changes in
the connectivity of DMN areas in particular50,52,62. These previous studies combined with our current findings indicate that, beyond their well-established role in high-level cognitive
processes29,74,95,96, DMN areas may also help to marshal cognitive resources to enhance motor behavior and performance, such as when the animal begins recovery following stroke. In addition
to the functional arguments above, there are at least a few other potential reasons for why the DMN and limbic areas in our study appeared to exhibit less altered connectivity 30 days
post-MCAO stroke. Firstly, this may relate to the vascular distribution that these regions receive. MCA territory strokes predominantly affect the lateral aspects of the frontal, temporal,
and parietal lobes due to the extensive distribution of the MCA. However, the DMN and limbic areas may exhibit relatively preserved connectivity because of their partial vascular supply from
the anterior and posterior cerebral arteries. This secondary vascular distribution might contribute to the resilience observed in these networks post-MCAO. Secondly, many DMN and limbic
regions are generally further neuroanatomically removed from the stroke location, which could potentially preserve their connectivity patterns more effectively. Lastly, an alternative
possibility is that, rather than the DMN and limbic areas being less affected by the stroke, these regions may simply reinstantiate their patterns of connectivity more quickly during the
30-day recovery period. As noted above, this could be attributed to the lower myelin content of these regions53,54,55,56,57, which is thought to enhance their capacity for neural plasticity.
Together, these possibilities highlight the complex interplay between vascular supply, neuroanatomical distance from the stroke site, and intrinsic structural properties of the different
cortical tissues in determining post-stroke connectivity patterns. A particular strength of the current work lies in its use of the non-human primate model, which we leveraged to provide an
understanding of changes in whole-brain connectivity following stroke. Primate models closely mimic the human condition due to their comparable brain organization, including similar
structural and functional neural organization, and comparable motor and cognitive behaviors97,98. Moreover, our ability to precisely control the timing, location and conditions under which
the animals received the stroke, as well as perform behavioral testing and neuroimaging at prescribed intervals, allow for a nuanced understanding of the trajectory of stroke
pathophysiology, as well as the potential sources of individual differences in stroke outcomes. Indeed, the link between changes in the connectivity of higher-order DMN and limbic structures
and individual motor outcomes is not an obvious relationship when surveying the pre-existing literature. Thus, the insights gleaned from this model hold high translational potential, as
well as better understanding the neural drivers of rehabilitation following stroke. Although our study highlights the role of higher-order transmodal cortex in behavioral recovery following
stroke, it also raises a number of important research questions for future work. First, while our study has focused on the relationship of DMN and limbic areas in stroke recovery, it does
not assess the causal contribution of these areas. Such investigations will undoubtedly require the targeting lesioning of transmodal cortex and the resulting deficits. Second, while the
brain networks identified in our study point to potentially important factors of cortical microstructure that may help drive the recovery process (e.g., less myelin content, greater density
of neurotransmitter receptor per neuron, larger dendrites, etc.), our findings preclude direct insights into the molecular-level contributions of stroke recovery and/or how these may relate
to macroscale functional coupling between brain regions following stroke. Third, while our study identifies important patterns of functional connectivity related to recovery, we did not
conduct any diffusion imaging in these same animals, and thus we cannot evaluate the role of white-matter tract integrity on behavioral recovery. Fourth, the exclusion of ipsilesional stroke
infarct areas when generating the stroke mask could potentially obscure or alter the interpretation of connectivity changes in the ipsilesional hemisphere. This exclusion may lead to an
underestimation of the true extent of connectivity disruptions or compensatory mechanisms that occur post-stroke. We acknowledge that while the broad stroke mask approach simplifies analysis
across subjects and affords direct comparisons, it may not fully capture the complexity of individuals’ lesion characteristics and their effects on functional connectivity. Finally, while
our study focuses on spontaneous recovery, it is important to acknowledge that this process is influenced by numerous factors including initial damage, post-stroke activities,
microcirculation, and behavioral compensation, making it difficult to distinguish between intrinsic neural rewiring and compensatory mechanisms involving additional neural
circuits99,100,101. Future work will be required to distinguish between these different processes, which itself will be important for developing targeted interventions that can enhance both
spontaneous and compensatory recovery pathways. METHODS ANIMAL PREPARATION Data was obtained from 23 male captive-bred _Cynomolgus macaques (Macaca fascicularis)_, with an average age of 7.9
± 1.1 and an average weight of 4.23 ± 1.3 kg (range 3.6 to 5.6 kg). All animals were healthy with no comorbidities and completely neurologically intact prior to stroke induction. All the
surgical and experimental procedures were carried out in accordance with the Canadian Council of Animal Care policy on the use of laboratory animals and approved by the Animal Use
Subcommittee of Queen’s University Council on Animal Care. Finally, every effort was made to ensure that the animals were free from pain and discomfort. STROKE MODEL In the process of
inducing stroke, the animals were first sedated with Isoflurane at concentrations between 1.0%-1.6%, followed by intubation and artificial ventilation. We monitored various physiological
parameters non-invasively, including blood pressure via leg cuff, end-tidal CO2, O2 saturation, and temperature by rectal probe. To maintain a stable body temperature at 37 ± 0.5 °C, a
warming blanket was employed. Additionally, a catheter was inserted into the femoral artery to keep track of both blood pressure and blood gas levels. Each animal underwent a middle cerebral
artery occlusion (MCAO), which was achieved through a pterional craniotomy on the right side. This procedure involved separation of the sylvian fissure to reveal the right MCA, which was
then blocked using a 5 mm clip made of titanium, positioned on the M1 section of the MCA before the orbitofrontal branch. Subsequently, the animals were transferred to the scanner for an MRI
to verify the blockage using magnetic resonance angiography (MRA). The duration of ischemia averaged 90.0 ± 1.1 minutes among the 23 animals. After occlusion, the surgical site was reopened
to remove the clip, thereby reestablishing blood circulation. The skull opening was then cleansed with a 0.9% saline solution, and the dura mater, temporalis muscle, fascia, and skin were
sutured. This MCAO procedure results in a consistently defined stroke in each animal. The period of 90 minutes for the obstruction and the subsequent reperfusion marks an initial plateau
phase in the stroke volume, characterized by reduced variability44. The removal of the clip from the microvessel enables the animals to survive the stroke given the proportion of tissue
affected by the infarct. Notably, all animals survived their respective strokes. NEUROLOGICAL ASSESSMENT Before and after the MCAO, the neurological functioning of each animal was evaluated
using the Non-Human Primate Stroke Scale (NHPSS). Despite the potential utility of other neurological scoring system, including the primate Rankin Score and Neurological Scale for Middle
Cerebral Artery Infarction102,103,104, the NHPSS was selected as a recovery measure over other outcome measures for two main reasons: (1) It has been previously validated in the exact animal
model used in this study43,44,46. (2) It is a comprehensive outcome measure that is simple to administer103. This scale was applied at 8 h and 12 h post-stroke and on days 1, 2, 3, 4, 5, 7,
14, 21, 28, and 30, as was performed in previous studies43,44,46,105,106,107. The NHPSS, comparable to the NIH Stroke Scale in human subjects, aims to determine the severity of the stroke
by examining various aspects such as consciousness level, grasp reflex, movement of limbs (both upper and lower), inattention, hemianopia, and facial muscle weakness42,44. In assessing
stroke recovery, raters were blinded to information about the animals’ brain lesions. The NHPSS comprises 11 categories and has a maximum score of 41 points, with 0 indicating normal
behavior and 41 denoting severe bilateral neurological deficits. Past studies involving _Cynomolgus macaques_ subjected to a 90-minute MCAO revealed an initial rise in NHPSS scores,
mirroring the trends observed in human patients. These scores then gradually decreased and stabilized between 14 and 30 days, suggesting that the behavioral impairments reached a steady
state at one month after the stroke44,108. Due to the complexity of these behavioral data, we sought an interpretable, low-dimensional representation of the NHPSS to capture the variability
and across days. To this end, we used functional principal component analysis (fPCA) to derive a low-dimensional summary of the main patterns of recovery across individual animals61. Just as
standard PCA finds a set of components capturing the dominant patterns of variability of data lying in ordinary Euclidean space, fPCA attempts to find a basis of component functions
capturing the dominant patterns of variability in time-varying data. For analysis, we represented individual animal recovery curves as functional data using a cubic spline basis with
smoothing penalty estimated by generalized cross-validation109. We then performed f_PCA_110, which allowed us to extract components capturing the dominant patterns of variability in
subjects’ recovery trajectories. Spline smoothing and fPCA were performed using the python package scikit-fda111. MRI IMAGE ACQUISITION Animals underwent three scanning sessions: 1)
pre-stroke (baseline), 2) < 1 h post-stroke (stroke confirmation), and 3) 30 days post-stroke. All data were acquired on an actively shielded 3 Tesla Siemens Trio scanner with a
32-channel head coil at the Queen’s University Centre for Neuroscience Studies. For the acquisition of MRI images, animals were intubated, and anesthetized (Isoflurane 1.0–1.6 %, O2 flow
rate of 2 L/min) throughout scanning. The induction of anesthesia was performed in the same way as in the surgical procedure with a mixture of ketamine (7.5 mg/kg) and dexmetatomadine (0.05
mg/kg). Baseline, pre-stroke MRI acquisitions were made 48 h prior to MCAO. Baseline Scans consisted of a high-resolution, T1-weighted, magnetization-prepared rapid gradient echo (MP-RAGE TR
= 1600 ms; TE = 3.92 ms, flip angle = 9°, matrix = 320 × 320, FOV 192 × 192, 120 slices and final voxel size = 0.6 × 0.6 × 0.6 mm. Baseline resting state fMRI data were also
acquired using a gradient-echo echo-planar sequence sensitive to BOLD contrast, with volume repetition time (TR) = 2000 ms, T2* echo time (TE) = 28 ms, flip angle = 80°, slices
matrix = 64 × 64, FOV = 768 × 768, 28 slices and a final voxel size = 2 × 2 × 2 mm. In all monkeys, the slices were acquired using contiguous, interleaved acquisition with 353 functional
volumes total (11 min. 46 seconds). Immediately following MCAO, animals underwent imaging to confirm vessel occlusion post-stroke using a high-resolution MRA sequence; TR = 39 ms; TE = 7.33
ms, flip angle=15°, matrix=448 × 448, FOV 112 × 112mm2 and final voxel size=0.3 × 0.3 × 1 mm3. At thirty days post-stroke, resting state fMRI was again acquired using the same parameters as
above. A T2-weighted Fast Spin-Echo was also acquired; TR = 9270 ms; TE = 65 ms, flip angle=157°, matrix=256 × 256, FOV 154 × 154 mm2, 100 slices and final voxel size=0.6 × 0.6 × 0.6 mm3.
All images were downloaded in DICOM format and converted to NIfTI format using dcm2niix from MRIcron112. IMAGING ANALYSIS ANATOMICAL PREPROCESSING All preprocessing was implemented using the
Nipype (1.8.4) software package, including FSL(5.0), AFNI (21.0.06), and ANTs (2.3.5). The pre-stroke and 30-day T2w images were corrected for intensity non-uniformity with ANTs’
N4BiasFieldCorrection113. The T2w were then skull-stripped with AFNI’s skullstrip. Each animal’s pre-stroke skull-stripped T2w image underwent brain tissue segmentation of cerebrospinal
fluid (CSF), white-matter (WM) and gray-matter (GM) using FSL’s FAST114. An average pre-stroke T2w template was constructed by combining all the skull-stripped T2w images (12
degrees-of-freedom [DOF] linear affine transformation). Similarly, each animal’s 30-day post-stroke skull-stripped T2w image underwent brain tissue segmentation to obtain cerebrospinal fluid
(CSF), white-matter (WM) and gray-matter (GM) and the lesioned voxels using FSL’s FAST114. An average post-stroke T2w template was also constructed by combining all the skull-stripped T2w
images (12 degrees-of-freedom [DOF] linear affine transformation). The resulting T2w templates were subsequently non-linearly normalized to the NIMH Macaque Template (NMT v2.0)47,48 using
ANTs’ antsRegistration. The NMT v2.0 normalized Cortical Hierarchy Atlas of the Rhesus Macaque (CHARM) was used to define 278 (139 per hemisphere) cortical regions47,48. Note that we did not
use regions from subcortical structures, due to concerns about the anatomically based parcellation of small substructures and decreased signal-to-noise ratio. Furthermore, we omitted any
region that had been affected by stroke (see below). LESION ANALYSIS The infarcted lesions were segmented using each animal’s 30-day post-stroke T2-weighted images. All segmentations were
performed automatically using FSL’s FAST segmentation and eroded to remove spurious voxels related to edema and cerebrospinal fluid. The resulting segmented lesions were visually inspected
by a graduate student and an experienced neurosurgeon. Each animal’s individual stroke mask was combined and averaged to produce a final group-average stroke template (See Fig. 1A). This
stroke template was subsequently projected onto the CHARM atlas and any cortical atlas regions that overlapped with any voxels of the stroke template were eliminated from the CHARM atlas and
our subsequent analysis. This procedure ensured that our analyses were constrained to only the aspects of cortex that were preserved across every animal, thus eliminating any stroke
differences between animals (note that this was also critical for our Procruster inter-subject alignment procedure, see below). Ultimately, we were left with 177 total cortical regions (43
in the right hemisphere, and 134 in the left hemisphere) following removal of any regions that overlapped with any stroke voxels. FUNCTIONAL PREPROCESSING For each BOLD run, the following
preprocessing was performed. First, a reference volume and its skull-stripped version were generated using a custom methodology in Nipype115. Head-motion parameters with respect to the BOLD
reference (transformation matrices, and six corresponding rotation and translation parameters) were estimated before any spatiotemporal filtering using ANFI’s volreg116. BOLD runs were
slice-time corrected using FSL’s slicetimer117. Each animal’s BOLD reference was then co-registered to their T2w reference using a custom version of Omni Synth118, which uses basis functions
from T2w images to produce an ideal synthetic undistorted anatomical image that has many contrast properties to BOLD that can be used for cross-modal image registration. All transformation
matrices (e.g. head-motion transform matrices, and co-registrations to anatomical and output spaces) were combined together and used to transform the BOLD timeseries to the NMT template in
standard space using ANTs’ antsApplyTransforms. Motion and physiological regressors were extracted for each scan in order to minimize the impact of head motion and physiological noise.
Motion correction produced six estimated head-motion regressors116. Confounding signals from non-brain tissues were also used as physiological regressors. Specifically, for pre-stroke scans,
CSF and WM masks were separately used to extract physiological regressors. To account for the ischemic lesion post-stroke, CSF, WM and the subject-specific lesion masks were used to extract
physiological regressors from post-stroke scans. Thus, there were eight and nine motion and physiological regressors used for the pre- and post-stroke scans, respectively. Together, motion
and physiological regressors were combined and subsequently extracted from the BOLD signal during regional signal extraction. REGION TIMESERIES EXTRACTION For each animal’s pre- and
post-stroke functional scans, the first three imaging volumes were discarded to mitigate the effects of signal saturation. The remaining BOLD timeseries data were extracted using the NMTv2.0
CHARM atlas for the ‘intact’ 177 regions noted above. Regional timeseries were denoised using motion and physiological regressors (as stated above) and subsequently spatially smoothed using
a 3 mm full-width-at-half-maximum Gaussian kernel, and temporally filtered using a 0.1 cut-off high-pass filter, which was implemented using Nilearn. Finally, all regional timeseries were
z-scored. FUNCTIONAL CONNECTIVITY ESTIMATES AND MANIFOLD CONSTRUCTION For every animal, functional connectivity estimates using the intact 177 regions were generated for pre- and post-stroke
scans by computing the region-wise covariance matrix using the Ledoit-Wolf estimator119. Connectivity manifolds were computed for all pre- and post-stroke functional connectivity matrices
using well-established procedures34,41,49,50,52,62. First, connectivity matrices were row-wise thresholded to retain the top 10% connections in each row. Next, the pairwise cosine
similarities of the thresholded rows in each matrix were computed, producing an affinity matrix that describes the similarity of each region’s connectivity profiles. Then we performed PCA on
the affinity matrices to obtain a set of principal components that yield a low-dimensional representation of whole-brain connectivity structure (i.e. connectivity gradients)34. Principal
component analysis has been shown to be a reliable dimension reduction technique as compared to other non-linear dimensionality reduction techniques, such as diffusion map embedding49. Note
that we also constructed gradients based on all 278-cortical regions (rather than just the subset of regions unaffected by the stroke) and then subsequently removed any regions that had been
affected by the stroke after gradient construction and observed nearly identical results (See Supplemental Fig. 7). In order to compare whole-brain network architecture across animals as a
function of stroke, we constructed a group-average template manifold by computing the geometric mean (across animals) of all the pre-stroke connectivity matrices (Fig. 1). This pre-stroke
manifold template was then used to align all individual animal manifolds (23 animals × 2 scans) using Procrustes alignment. All analyses on the aligned manifolds were performed using the top
three PCs, which cumulatively explained 50.1% of the total variance in the template manifold (Fig. 2B). Although PC4 explained 10.7% of the variance, including PC4 did not substantially
impact the results and interpretations of our main analyses. Across animals and scans, the top three PCs, following Procrustes alignment, had an average correlation of _r_ = 0.91 with their
respective PCs in the template manifold, indicating good overall reliability and alignment across animals and scans. This approach enabled us to examine stroke-related changes in
low-dimensional connectivity structure with respect to a well-defined pre-stroke functional architecture. MANIFOLD ECCENTRICITY AND ANALYSES Euclidean distance has previously been used to
characterize functional architecture in low-dimensional space38,50,51,120. Here, we defined manifold eccentricity as the euclidean distance between a single brain region and the manifold
centroid in PCA space38,50,51,120. Briefly, Briefly, for each brain region (N), the regional eccentricity (Ecc) was then defined as the square root of the sum of the squared differences
between the coordinates of the individual brain regions and the centroid giving a length value for each region’s vector from the origin (Eq. 1).
$${Ecc}=\sqrt{{\left({{{{\bf{N}}}}}_{{{{\boldsymbol{x}}}}}\right)}^{2}+\left({{{{\bf{N}}}}}_{{{{\boldsymbol{y}}}}}\right)^{2}+\left({{{{\bf{N}}}}}_{{{{\boldsymbol{z}}}}}\right)^{2}}$$ (1)
Eccentricity can be used to infer a measure of network integration and segregation. For example, low regional eccentricity suggests proximal regions that integrate more broadly across
functional networks. In contrast, a high regional eccentricity suggests that distal regions are more functionally segregated across functional networks. We validated this interpretation by
correlating template manifold eccentricity with graph theoretical measures of functional integration and segregation (see Supplementary Fig. 4). Similar to our previous work50, we correlated
the row-wise thresholded template connectivity matrix with node strength, within-module degree z-score participation coefficient and nodal efficiency. Node strength represents the sum of a
region’s connectivity; within-module degree z-score provides the degree centrality of a region within its respective network; participation coefficient is used to measure the network
diversity of a region’s connectivity distribution; and finally, nodal efficiency represents of how efficiently information is exchanged or communicated between a particular node (i.e., a
brain region) and all other nodes in the network In order to examine manifold expansion and contractions (i.e. changes in eccentricity) between pre- and post-stroke scans, we computed each
region’s eccentricity for each animal’s individual manifolds. We then performed a paired t-test between the mean pre- and post-stroke eccentricity across all regions for each individual
animal, and applied FDR correction (_q_ < 0.05) to control for Type I errors. SEED CONNECTIVITY ANALYSES In order to probe the changes in brain connectivity that underlie the observed
changes in manifold eccentricity, we performed seed connectivity contrasts between the different task epochs. For this, we selected several seed regions that were statistically significant
in the Post-stroke > Pre-stroke contrast and generated region-wise functional connectivity maps using paired t-tests across all animals. For these contrasts, we opted to show
unthresholded t-maps as a means of visualizing the multivariate pattern of connectivity changes that drive changes in eccentricity. Note that these analyses are mainly intended to help
characterize (and interpret) the connectivity changes of representative brain regions that were identified as being of interest from our main eccentricity analyses. COMPARISON OF OUR STROKE
DATA WITH PREVIOUS DATASETS To directly compare our findings based on the NMTv2.0 CHARM atlas with previous descriptions of functional network organization in humans, we downloaded label
files (https://github.com/TingsterX/alignment_macaque-human/tree/main/cross-species_parcellation) generated by Xu et al.121, who transferred the cognitive networks defined by Yeo et al.122
from human to macaques using cross-species functional alignment121. Because these data are in Yerkes19 template space, we used the Connectome Workbench command (-label-to-volume-mapping) to
map them into volume space and convert them into NMT space using RheMAP (https://github.com/PRIME-RE/RheMAP). We used this human-to-monkey mapping to identify the functional assignments of
individual regions that changed their eccentricity from pre- to post-stroke (Fig. 4A). In addition, using the same procedures as above, we also compared our data to (1) the T1w/Tw2 data
acquired by Donahue et al.123, which we downloaded from the from the BALSA neuroimaging website (https://balsa.wustl.edu/study/W336), and (2) primary neurotransmitter receptor gradient data
generated by Froudist-Walsh54, which we downloaded from (https://balsa.wustl.edu/study/P2Nql) and that effectively represents the total receptor density per neuron (81% of the variance in
receptor data). To generate this gradient, the researchers z-scored the receptor-per-neuron data from their study, and performed PCA following z-scoring. ANALYSES OF GROUP RECOVERY (GOOD
VERSUS POOR) DIFFERENCES To examine whether regional changes in eccentricity were related to improved functional outcomes in the NHPs, we first divided the animals into good (_N_ = 11) and
poor (_N_ = 12) recovery groups based on a median split of their fPCA scores. We then performed an independent sample t-test between the good versus poor recovery groups for each brain
region (88 in total, Fig. 3D) that exhibited significant changes in pre- to post-stroke eccentricity. We corrected for multiple comparisons using an FDR correction (_q_ < 0.05, Fig. 7A).
Next, to describe connectivity changes that underlie these good vs. poor differences in eccentricity, we performed paired t-tests on the seed connectivity maps between groups, resulting in a
contrast map for each seed region, which also underwent FDR correction (Fig. 7C, D). Finally, we also calculated the average stroke volume of each recovery group at 30 days to test whether
lesion volume alone could explain the differences in animal recovery. Importantly, we calculated stroke volume for each animal by quantifying the lesion voxel size and multiplying it by the
voxel dimensions (length x width x height; to obtain mm³)124. REPORTING SUMMARY Further information on research design is available in the Nature Portfolio Reporting Summary linked to this
article. DATA AVAILABILITY Data available on request by contacting the corresponding author and under an inter-institutional Data Transfer Agreement with Queen’s University. Source data are
provided with this paper. CODE AVAILABILITY Code is available at https://github.com/jnash22/Stroke_Gradients. https://doi.org/10.5281/zenodo.13624004. REFERENCES * Virani, S. S. et al. Heart
disease and stroke statistics-2020 update: a report from the American Heart Association. _Circulation_ 141, e139–e596 (2020). Article PubMed Google Scholar * Zorowitz, R. D., Chen, E.,
Tong, K. B. & Laouri, M. Costs and rehabilitation use of stroke survivors: a retrospective study of Medicare beneficiaries. _Top. Stroke Rehabil._ 16, 309–320 (2009). Article PubMed
Google Scholar * Bernspang, B., Asplund, K., Eriksson, S. & Fugl-Meyer, A. R. Motor and perceptual impairments in acute stroke patients: effects on self-care ability. _Stroke_ 18,
1081–1086 (1987). Article CAS PubMed Google Scholar * Lai, S. M., Studenski, S., Duncan, P. W. & Perera, S. Persisting consequences of stroke measured by the Stroke Impact Scale.
_Stroke_ 33, 1840–1844 (2002). Article PubMed Google Scholar * Efi, P. et al. Quality of life and psychological distress of caregivers’ of stroke people. _Acta Neurol. Taiwan_ 26, 154–166
(2017). PubMed Google Scholar * Kaji, R. Global burden of neurological diseases highlights stroke. _Nat. Rev. Neurol._ 15, 371–372 (2019). Article PubMed Google Scholar * Chai, R. C.
et al. A novel DNA methylation-based signature can predict the responses of MGMT promoter unmethylated glioblastomas to temozolomide. _Front Genet_ 10, 910 (2019). Article CAS PubMed
PubMed Central Google Scholar * Rudberg, A. S., Berge, E., Gustavsson, A., Nasman, P. & Lundstrom, E. Long-term health-related quality of life, survival and costs by different levels
of functional outcome six months after stroke. _Eur. Stroke J._ 3, 157–164 (2018). Article PubMed PubMed Central Google Scholar * Cramer, S. C. Repairing the human brain after stroke: I.
Mechanisms of spontaneous recovery. _Ann. Neurol._ 63, 272–287 (2008). Article PubMed Google Scholar * Feydy, A. et al. Longitudinal study of motor recovery after stroke: recruitment and
focusing of brain activation. _Stroke_ 33, 1610–1617 (2002). Article CAS PubMed Google Scholar * Ward, N. S., Brown, M. M., Thompson, A. J. & Frackowiak, R. S. Neural correlates of
outcome after stroke: a cross-sectional fMRI study. _Brain_ 126, 1430–1448 (2003). Article CAS PubMed Google Scholar * Wei, W. et al. A longitudinal study of hand motor recovery after
sub-acute stroke: a study combined FMRI with diffusion tensor imaging. _PLoS One_ 8, e64154 (2013). Article ADS CAS PubMed PubMed Central Google Scholar * Dobkin, B. H. Strategies for
stroke rehabilitation. _Lancet Neurol._ 3, 528–536 (2004). Article PubMed PubMed Central Google Scholar * Grefkes, C. & Fink, G. R. Recovery from stroke: current concepts and future
perspectives. _Neurological Res. Pract._ 2, 17 (2020). Article Google Scholar * Kwakkel, G., Kollen, B. & Twisk, J. Impact of Time on Improvement of Outcome After Stroke. _Stroke_ 37,
2348–2353 (2006). Article PubMed Google Scholar * Lee, K. B. et al. Six-month functional recovery of stroke patients: a multi-time-point study. _Int J. Rehabil. Res_. 38, 173–180 (2015).
Article PubMed PubMed Central Google Scholar * Taub, E., Uswatte, G. & Elbert, T. New treatments in neurorehabiliation founded on basic research. _Nat. Rev. Neurosci._ 3, 228–236
(2002). Article CAS PubMed Google Scholar * Ward, N. S. Functional reorganization of the cerebral motor system after stroke. _Curr. Opin. Neurol._ 17, 725–730 (2004). Article PubMed
Google Scholar * Brown, WardN. S., Thompson, M. M. & Frackowiak, A. J. RS. Neural correlates of motor recovery after stroke: a longitudinal fMRI study. _Brain_ 126, 2476–2496 (2003).
Article PubMed Google Scholar * Ward, N. S. & Cohen, L. G. Mechanisms underlying recovery of motor function after stroke. _Arch. Neurol._ 61, 1844–1848 (2004). Article PubMed PubMed
Central Google Scholar * Ward, N. S. & Frackowiak, R. S. The functional anatomy of cerebral reorganisation after focal brain injury. _J. Physiol. Paris_ 99, 425–436 (2006). Article
PubMed Google Scholar * Hodics, T., Cohen, L. G. & Cramer, S. C. Functional imaging of intervention effects in stroke motor rehabilitation. _Arch. Phys. Med. rehabilitation_ 87, 36–42
(2006). Article Google Scholar * Cramer, S. C. Functional imaging in stroke recovery. _Stroke_ 35, 2695–2698 (2004). Article PubMed Google Scholar * Baldassarre, A., Ramsey, L. E.,
Siegel, J. S., Shulman, G. L. & Corbetta, M. Brain connectivity and neurological disorders after stroke. _Curr. Opin. Neurol._ 29, 706–713 (2016). Article PubMed PubMed Central Google
Scholar * Idesis, S. et al. A low dimensional embedding of brain dynamics enhances diagnostic accuracy and behavioral prediction in stroke. _Sci_ 13, 15698 (2023). CAS Google Scholar *
Lee, J. et al. Alteration and role of interhemispheric and intrahemispheric connectivity in motor network after stroke. _Brain Topogr._ 31, 708–719 (2018). Article PubMed Google Scholar *
Olafson, E. et al. Frontoparietal network activation is associated with motor recovery in ischemic stroke patients. _Commun. Biol._ 5, 993 (2022). Article PubMed PubMed Central Google
Scholar * Reibelt, A., Quandt, F. & Schulz, R. Posterior parietal cortical areas and recovery after motor stroke: a scoping review. _Brain Commun._ 5, fcad250 (2023). Article PubMed
PubMed Central Google Scholar * Smallwood, J. et al. The default mode network in cognition: a topographical perspective. _Nat. Rev. Neurosci._ 22, 503–513 (2021). Article CAS PubMed
Google Scholar * Li, S. et al. Altered default mode and affective network connectivity in stroke patients with and without dysphagia. _J. Rehabil. Med_. 46, 126–131 (2014). Article PubMed
Google Scholar * Tuladhar, A. M. et al. Default mode network connectivity in stroke patients. _PLoS One_ 8, e66556 (2013). Article ADS CAS PubMed PubMed Central Google Scholar *
Bayrak, S. et al. The impact of ischemic stroke on connectivity gradients. _Neuroimage_ (Amst 24, 101947 (2019). * Cook, D. J. & Tymianski, M. Nonhuman primate models of stroke for
translational neuroprotection research. _Neurotherapeutics_ 9, 371–379 (2012). Article CAS PubMed PubMed Central Google Scholar * Vos de Wael, R. et al. BrainSpace: a toolbox for the
analysis of macroscale gradients in neuroimaging and connectomics datasets. _Commun. Biol._ 3, 103 (2020). Article PubMed PubMed Central Google Scholar * Shenoy, K. V., Sahani, M. &
Churchland, M. M. Cortical control of arm movements: a dynamical systems perspective. _Annu Rev. Neurosci._ 36, 337–359 (2013). Article CAS PubMed Google Scholar * Churchland, M. M. et
al. Neural population dynamics during reaching. _Nature_ 487, 51–56 (2012). Article ADS CAS PubMed Central Google Scholar * Vyas, S., Golub, M. D., Sussillo, D. & Shenoy, K. V.
Computation through neural population dynamics. _Annu. Rev. Neurosci._ 43, 249–275 (2020). Article CAS PubMed Central Google Scholar * Valk, S. L. et al. Shaping brain structure: Genetic
and phylogenetic axes of macroscale organization of cortical thickness. _Sci. Adv._ 6, eabb3417 (2020). Article ADS CAS PubMed PubMed Central Google Scholar * Paquola, C. et al.
Microstructural and functional gradients are increasingly dissociated in transmodal cortices. _PLOS Biol._ 17, e3000284 (2019). Article CAS PubMed PubMed Central Google Scholar *
Paquola, C. et al. Shifts in myeloarchitecture characterise adolescent development of cortical gradients. _eLife_ 8, e50482 (2019). Article CAS PubMed PubMed Central Google Scholar *
Margulies, D. S. et al. Situating the default-mode network along a principal gradient of macroscale cortical organization. _Proc. Natl Acad. Sci._ 113, 12574–12579 (2016). Article ADS CAS
PubMed PubMed Central Google Scholar * Roitberg, B. et al. Chronic ischemic stroke model in cynomolgus monkeys: behavioral, neuroimaging and anatomical study. _Neurol. Res_ 25, 68–78
(2003). Article PubMed Google Scholar * Cook, D. J., Teves, L. & Tymianski, M. Treatment of stroke with a PSD-95 inhibitor in the gyrencephalic primate brain. _Nature_ 483, 213–217
(2012). Article ADS CAS PubMed Google Scholar * Cook, D. J., Teves, L. & Tymianski, M. A translational paradigm for the preclinical evaluation of the stroke neuroprotectant
Tat-NR2B9c in gyrencephalic nonhuman primates. _Sci. Transl. Med_ 4, 154ra133 (2012). Article PubMed Google Scholar * Cook, D. J. & Tymianski, M. Translating promising preclinical
neuroprotective therapies to human stroke trials. _Expert Rev. Cardiovasc Ther._ 9, 433–449 (2011). Article PubMed Google Scholar * Nashed, J. Y. et al. Spontaneous behavioural recovery
following stroke relates to the integrity of parietal and temporal regions. _Transl. Stroke Res_. 15, 127–139 (2022). Article PubMed Google Scholar * Reveley, C. et al. Three-dimensional
digital template atlas of the macaque brain. _Cereb. Cortex_ 27, 4463–4477 (2017). PubMed Google Scholar * Jung, B. et al. A comprehensive macaque fMRI pipeline and hierarchical atlas.
_Neuroimage_ 235, 117997 (2021). Article PubMed Google Scholar * Hong, S. J. et al. Toward a connectivity gradient-based framework for reproducible biomarker discovery. _Neuroimage_ 223,
117322 (2020). Article CAS PubMed Google Scholar * Gale, D. J. et al. Distinct patterns of cortical manifold expansion and contraction underlie human sensorimotor adaptation. _Proc. Natl
Acad. Sci. USA_ 119, e2209960119 (2022). Article CAS PubMed PubMed Central Google Scholar * Park, B. Y. et al. An expanding manifold in transmodal regions characterizes adolescent
reconfiguration of structural connectome organization. _Elife_ 10, e64694 (2021). Article CAS PubMed PubMed Central Google Scholar * Nick Q., _et al_. _Reconfigurations of cortical
manifold structure during reward-based motor learning.)_. eLife Sciences Publications, Ltd (2023). * McGee, A. W., Yang, Y., Fischer, Q. S., Daw, N. W. & Strittmatter, S. M.
Experience-driven plasticity of visual cortex limited by myelin and Nogo receptor. _Science_ 309, 2222–2226 (2005). Article ADS CAS PubMed PubMed Central Google Scholar *
Froudist-Walsh, S. et al. Gradients of neurotransmitter receptor expression in the macaque cortex. _Nat. Neurosci._ 26, 1281–1294 (2023). Article CAS PubMed PubMed Central Google Scholar
* Hansen, J. Y. et al. Mapping neurotransmitter systems to the structural and functional organization of the human neocortex. _Nat. Neurosci._ 25, 1569–1581 (2022). Article CAS PubMed
PubMed Central Google Scholar * Glasser, M. F., Goyal, M. S., Preuss, T. M., Raichle, M. E. & Van Essen, D. C. Trends and properties of human cerebral cortex: correlations with
cortical myelin content. _Neuroimage_ 93 PT 2, 165–175 (2014). Article PubMed Google Scholar * Van Essen, D. C. et al. Cerebral cortical folding, parcellation, and connectivity in humans,
nonhuman primates, and mice. _Proc. Natl Acad. Sci. USA_ 116, 26173–26180 (2019). Article ADS PubMed PubMed Central Google Scholar * Hawe, R. L., Scott, S. H. & Dukelow, S. P.
Taking Proportional Out of Stroke Recovery. _Stroke_ 50, 204–211 (2019). Article PubMed Google Scholar * Prabhakaran, S. et al. Inter-individual variability in the capacity for motor
recovery after ischemic stroke. _Neurorehabil Neural Repair_ 22, 64–71 (2008). Article PubMed Google Scholar * Semrau, J. A., Herter, T. M., Scott, S. H. & Dukelow, S. P. Examining
differences in patterns of sensory and motor recovery after stroke with robotics. _Stroke_ 46, 3459–3469 (2015). Article PubMed Google Scholar * Shang, H. L. A survey of functional
principal component analysis. _AStA Adv. Stat. Anal._ 98, 121–142 (2014). Article MathSciNet Google Scholar * Areshenkoff, C. et al. Neural excursions from manifold structure explain
patterns of learning during human sensorimotor adaptation. _Elife_ 11, e74591 (2022). Article CAS PubMed PubMed Central Google Scholar * Chen, C. L., Tang, F. T., Chen, H. C., Chung, C.
Y. & Wong, M. K. Brain lesion size and location: effects on motor recovery and functional outcome in stroke patients. _Arch. Phys. Med Rehabil._ 81, 447–452 (2000). Article CAS PubMed
Google Scholar * Zhang, X. et al. Temporal evolution of ischemic lesions in nonhuman primates: a diffusion and perfusion MRI study. _PLoS One_ 10, e0117290 (2015). Article PubMed PubMed
Central Google Scholar * Ermine, C. M., Bivard, A., Parsons, M. W. & Baron, J.-C. The ischemic penumbra: From concept to reality. _Int. J. Stroke_ 16, 497–509 (2021). Article PubMed
Google Scholar * Astrup, J., Symon, L., Branston, N. M. & Lassen, N. A. Cortical evoked potential and extracellular K+ and H+ at critical levels of brain Ischemia. _Stroke_ 8, 51–57
(1977). Article CAS PubMed Google Scholar * Astrup, J., Siesjo, B. K. & Symon, L. Thresholds in cerebral ischemia - the ischemic penumbra. _Stroke_ 12, 723–725 (1981). Article CAS
PubMed Google Scholar * Bradnam, L. V., Stinear, C. M., Barber, P. A. & Byblow, W. D. Contralesional hemisphere control of the proximal paretic upper limb following stroke. _Cereb.
Cortex_ 22, 2662–2671 (2012). Article PubMed Google Scholar * Buetefisch, C. M. Role of the contralesional hemisphere in post-stroke recovery of upper extremity motor function. _Front
Neurol._ 6, 214 (2015). Article PubMed PubMed Central Google Scholar * Crofts, J. J. et al. Network analysis detects changes in the contralesional hemisphere following stroke.
_Neuroimage_ 54, 161–169 (2011). Article CAS PubMed Google Scholar * Dodd, K. C., Nair, V. A. & Prabhakaran, V. Role of the contralesional vs. ipsilesional hemisphere in stroke
recovery. _Front Hum. Neurosci._ 11, 469 (2017). Article PubMed PubMed Central Google Scholar * Braga, R. M. & Leech, R. Echoes of the brain: local-scale representation of
whole-brain functional networks within transmodal cortex. _Neuroscientist_ 21, 540–551 (2015). Article CAS PubMed PubMed Central Google Scholar * Igelstrom, K. M. & Graziano, M. S.
A. The inferior parietal lobule and temporoparietal junction: A network perspective. _Neuropsychologia_ 105, 70–83 (2017). Article PubMed Google Scholar * Murphy, C. et al. Modes of
operation: A topographic neural gradient supporting stimulus dependent and independent cognition. _NeuroImage_ 186, 487–496 (2019). Article PubMed Google Scholar * Mesulam, M.
Representation, inference, and transcendent encoding in neurocognitive networks of the human brain. _Ann. Neurol._ 64, 367–378 (2008). Article PubMed Google Scholar * Mesulam, M. The
evolving landscape of human cortical connectivity: Facts and inferences. _NeuroImage_ 62, 2182–2189 (2012). Article PubMed Google Scholar * Mesulam, M. M. From sensation to cognition.
_Brain_ 121, 1013–1052 (1998). Article PubMed Google Scholar * Suárez, L. E., Markello, R. D., Betzel, R. F. & Misic, B. Linking structure and function in macroscale brain networks.
_Trends Cogn. Sci._ 24, 302–315 (2020). Article PubMed Google Scholar * Wolff, A. et al. Intrinsic neural timescales: temporal integration and segregation. _Trends Cogn. Sci._ 26, 159–173
(2022). Article PubMed Google Scholar * Jacobs, B. et al. Regional dendritic and spine variation in human cerebral cortex: a quantitative golgi study. _Cereb. Cortex_ 11, 558–571 (2001).
Article CAS PubMed Google Scholar * Rothnie, P., Kabaso, D., Hof, P. R., Henry, B. I. & Wearne, S. L. Functionally relevant measures of spatial complexity in neuronal dendritic
arbors. _J. Theor. Biol._ 238, 505–526 (2006). Article ADS MathSciNet CAS PubMed Google Scholar * Gou, Z. et al. PirB is a novel potential therapeutic target for enhancing axonal
regeneration and synaptic plasticity following CNS injury in mammals. _J. Drug Target_ 22, 365–371 (2014). Article CAS PubMed Google Scholar * Lee, H. et al. Synaptic function for the
Nogo-66 receptor NgR1: regulation of dendritic spine morphology and activity-dependent synaptic strength. _J. Neurosci._ 28, 2753–2765 (2008). Article CAS PubMed PubMed Central Google
Scholar * Calautti, C. & Baron, J. C. Functional neuroimaging studies of motor recovery after stroke in adults: a review. _Stroke_ 34, 1553–1566 (2003). Article PubMed Google Scholar
* Li, Y. et al. Changes of brain connectivity in the primary motor cortex after subcortical stroke: a multimodal magnetic resonance imaging study. _Med. (Baltim.)_ 95, e2579 (2016).
Article CAS Google Scholar * van Meer, M. P., van der Marel, K., Otte, W. M., Berkelbach van der Sprenkel, J. W. & Dijkhuizen, R. M. Correspondence between altered functional and
structural connectivity in the contralesional sensorimotor cortex after unilateral stroke in rats: a combined resting-state functional MRI and manganese-enhanced MRI study. _J. Cereb. Blood
Flow. Metab._ 30, 1707–1711 (2010). Article PubMed PubMed Central Google Scholar * Barack, D. L., Chang, S. W. C. & Platt, M. L. Posterior cingulate neurons dynamically signal
decisions to disengage during foraging. _Neuron_ 96, 339–347.e335 (2017). Article CAS PubMed PubMed Central Google Scholar * Barack, D. L. & Platt, M. L. Neuronal activity in the
posterior cingulate cortex signals environmental information and predicts behavioral variability during trapline foraging. _J. Neurosci._ 41, 2703–2712 (2021). Article CAS PubMed PubMed
Central Google Scholar * Hayden, B. Y., Nair, A. C., McCoy, A. N. & Platt, M. L. Posterior cingulate cortex mediates outcome-contingent allocation of behavior. _Neuron_ 60, 19–25
(2008). Article CAS PubMed PubMed Central Google Scholar * Hayden, B. Y., Pearson, J. M. & Platt, M. L. Neuronal basis of sequential foraging decisions in a patchy environment.
_Nat. Neurosci._ 14, 933–939 (2011). Article CAS PubMed PubMed Central Google Scholar * Hayden, B. Y., Smith, D. V. & Platt, M. L. Electrophysiological correlates of default-mode
processing in macaque posterior cingulate cortex. _Proc. Natl Acad. Sci. USA_ 106, 5948–5953 (2009). Article ADS CAS PubMed PubMed Central Google Scholar * Heilbronner, S. R. &
Platt, M. L. Causal evidence of performance monitoring by neurons in posterior cingulate cortex during learning. _Neuron_ 80, 1384–1391 (2013). Article CAS PubMed PubMed Central Google
Scholar * Pearson, J. M., Hayden, B. Y., Raghavachari, S. & Platt, M. L. Neurons in posterior cingulate cortex signal exploratory decisions in a dynamic multioption choice task. _Curr.
Biol._ 19, 1532–1537 (2009). Article CAS PubMed PubMed Central Google Scholar * Pearson, J. M., Heilbronner, S. R., Barack, D. L., Hayden, B. Y. & Platt, M. L. Posterior cingulate
cortex: adapting behavior to a changing world. _Trends Cogn. Sci._ 15, 143–151 (2011). Article PubMed PubMed Central Google Scholar * Menon, V. 20 years of the default mode network: A
review and synthesis. _Neuron_ 111, 2469–2487 (2023). Article CAS PubMed PubMed Central Google Scholar * Raichle, M. E. The brain’s default mode network. _Annu. Rev. Neurosci._ 38,
433–447 (2015). Article CAS PubMed Google Scholar * Phillips, K. A. et al. Why primate models matter. _Am. J. Primatol._ 76, 801–827 (2014). Article PubMed PubMed Central Google
Scholar * Phillips, K. A. & Sherwood, C. C. Cortical development in brown capuchin monkeys: a structural MRI study. _Neuroimage_ 43, 657–664 (2008). Article PubMed Google Scholar *
Bandet, M. V. & Winship, I. R. Aberrant cortical activity, functional connectivity, and neural assembly architecture after photothrombotic stroke in mice. _eLife_ 12, RP90080 (2024).
Article PubMed PubMed Central Google Scholar * Cirillo, C. et al. Post-stroke remodeling processes in animal models and humans. _J. Cereb. Blood Flow. Metab._ 40, 3–22 (2020). Article
PubMed Google Scholar * Murphy, T. H. & Corbett, D. Plasticity during stroke recovery: from synapse to behaviour. _Nat. Rev. Neurosci._ 10, 861–872 (2009). Article CAS PubMed Google
Scholar * Feng, M. et al. Serial 18F-FDG PET demonstrates benefit of human mesenchymal stem cells in treatment of intracerebral hematoma: a translational study in a primate model. _J.
Nucl. Med._ 52, 90–97 (2011). Article PubMed Google Scholar * Lin, X. et al. Nonhuman primate models of ischemic stroke and neurological evaluation after stroke. _J. Neurosci. Methods_
376, 109611 (2022). Article PubMed Google Scholar * Wu, D. et al. Primate version of modified rankin scale for classifying dysfunction in rhesus monkeys. _Stroke_ 51, 1620–1623 (2020).
Article PubMed Google Scholar * Chen, Y. et al. Robotic assessment of upper limb function in a nonhuman primate model of chronic stroke. _Transl. Stroke Res_ 12, 569–580 (2021). Article
PubMed Google Scholar * Meloni, B. P. et al. Poly-arginine peptide-18 (R18) reduces brain injury and improves functional outcomes in a nonhuman primate stroke model. _Neurotherapeutics_
17, 627–634 (2020). Article CAS PubMed Google Scholar * Ramirez-Garcia, G., Harrison, K. A., Fernandez-Ruiz, J., Nashed, J. Y. & Cook, D. J. Stroke longitudinal volumetric measures
correlate with the behavioral score in non-human primates. _Neuroscience_ 397, 41–55 (2019). Article CAS PubMed Google Scholar * Nacu, A. et al. Early neurological worsening in acute
ischaemic stroke patients. _Acta Neurol. Scand._ 133, 25–29 (2016). Article CAS PubMed Google Scholar * Härdle W. _Applied Nonparametric Regression_. Cambridge University Press (1990). *
Ramsay J., Silverman B. W. _Functional Data Analysis_. Springer New York (2013). * Ramos-Carreño, C., Torrecilla, J. L., Carbajo-Berrocal, M., Marcos, P. & Suárez, A. scikit-fda: A
python package for functional data analysis. _J. Stat. Softw._ 109, 1–37 (2024). Article Google Scholar * Li, X., Morgan, P. S., Ashburner, J., Smith, J. & Rorden, C. The first step
for neuroimaging data analysis: DICOM to NIfTI conversion. _J. Neurosci. Methods_ 264, 47–56 (2016). Article PubMed Google Scholar * Tustison, N. J. et al. N4ITK: improved N3 bias
correction. _IEEE Trans. Med Imaging_ 29, 1310–1320 (2010). Article PubMed PubMed Central Google Scholar * Zhang, Y., Brady, M. & Smith, S. Segmentation of brain MR images through a
hidden Markov random field model and the expectation-maximization algorithm. _IEEE Trans. Med Imaging_ 20, 45–57 (2001). Article CAS PubMed Google Scholar * Gorgolewski, K. et al.
Nipype: a flexible, lightweight and extensible neuroimaging data processing framework in python. _Front Neuroinform_ 5, 13 (2011). Article PubMed PubMed Central Google Scholar * Cox, R.
W. AFNI: software for analysis and visualization of functional magnetic resonance neuroimages. _Comput Biomed. Res_ 29, 162–173 (1996). Article ADS CAS PubMed Google Scholar * Smith, S.
M. et al. Advances in functional and structural MR image analysis and implementation as FSL. _Neuroimage_ 23, S208–S219 (2004). Article PubMed Google Scholar * Montez, D. F. et al. Using
synthetic MR images for distortion correction. _Dev. Cogn. Neurosci._ 60, 101234 (2023). Article PubMed PubMed Central Google Scholar * Ledoit, O. & Wolf, M. A well-conditioned
estimator for large-dimensional covariance matrices. _J. Multivar. Anal._ 88, 365–411 (2004). Article MathSciNet Google Scholar * Bethlehem, R. A. I. et al. Dispersion of functional
gradients across the adult lifespan. _Neuroimage_ 222, 117299 (2020). Article PubMed Google Scholar * Xu, T. et al. Cross-species functional alignment reveals evolutionary hierarchy
within the connectome. _NeuroImage_ 223, 117346 (2020). Article PubMed Google Scholar * Yeo, B. T. et al. The organization of the human cerebral cortex estimated by intrinsic functional
connectivity. _J. Neurophysiol._ 106, 1125–1165 (2011). Article PubMed Google Scholar * Donahue, C. J. et al. Using diffusion tractography to predict cortical connection strength and
distance: a quantitative comparison with tracers in the monkey. _J. Neurosci._ 36, 6758–6770 (2016). Article CAS PubMed PubMed Central Google Scholar * Nashed, J. Y. (2024).
_jnash22/Stroke_Gradients: Nat_comms_code (Nat_comms_code)_. Zenodo. https://doi.org/10.5281/zenodo.13624004. Download references ACKNOWLEDGEMENTS We thank Andrew Winterborn, J. Leclerc, T.
Armand and P. E. Ryan, for critical assistance with surgical procedures and data collection. This work was supported by Canadian Institute of Health Research Project Grants (FRN: 479350
(DJC) and 486456 (DJC)), Brain Canada Platform Grant issued in 2019 (DJC) and Canadian Institute of Health Research Canada Graduate Scholarship Doctoral Award (FRN: 181419 (JYN)). AUTHOR
INFORMATION AUTHORS AND AFFILIATIONS * Centre for Neuroscience Studies, Queen’s University, Kingston, ON, Canada Joseph Y. Nashed, Daniel J. Gale, Jason P. Gallivan & Douglas J. Cook *
School of Medicine, Queen’s University, Kingston, ON, Canada Joseph Y. Nashed & Douglas J. Cook * Department of Psychology, Queen’s University, Kingston, ON, Canada Jason P. Gallivan *
Department of Biomedical and Molecular Sciences, Queen’s University, Kingston, ON, Canada Jason P. Gallivan * Division of Neurosurgery, Department of Surgery, Queen’s University, Kingston,
ON, Canada Douglas J. Cook Authors * Joseph Y. Nashed View author publications You can also search for this author inPubMed Google Scholar * Daniel J. Gale View author publications You can
also search for this author inPubMed Google Scholar * Jason P. Gallivan View author publications You can also search for this author inPubMed Google Scholar * Douglas J. Cook View author
publications You can also search for this author inPubMed Google Scholar CONTRIBUTIONS Conceptualization: JYN, DJG, JPG, DJC. Methodology: JYN, DJG, JPG, DJC. Investigation: JYN, JPG, DJC.
Visualization: JYN, JPG, DJC. Supervision: JPG, DJC. Writing—original draft: JYN, JPG, DJC. Writing—review & editing: JYN, DJG, JPG, DJC. CORRESPONDING AUTHOR Correspondence to Joseph Y.
Nashed. ETHICS DECLARATIONS COMPETING INTERESTS The authors declare no competing interests. PEER REVIEW PEER REVIEW INFORMATION _Nature Communications_ thanks the anonymous reviewer(s) for
their contribution to the peer review of this work. A peer review file is available. ADDITIONAL INFORMATION PUBLISHER’S NOTE Springer Nature remains neutral with regard to jurisdictional
claims in published maps and institutional affiliations. SUPPLEMENTARY INFORMATION SUPPLEMENTARY INFORMATION PEER REVIEW FILE REPORTING SUMMARY SOURCE DATA SOURCE DATA RIGHTS AND PERMISSIONS
OPEN ACCESS This article is licensed under a Creative Commons Attribution-NonCommercial-NoDerivatives 4.0 International License, which permits any non-commercial use, sharing, distribution
and reproduction in any medium or format, as long as you give appropriate credit to the original author(s) and the source, provide a link to the Creative Commons licence, and indicate if you
modified the licensed material. You do not have permission under this licence to share adapted material derived from this article or parts of it. The images or other third party material in
this article are included in the article’s Creative Commons licence, unless indicated otherwise in a credit line to the material. If material is not included in the article’s Creative
Commons licence and your intended use is not permitted by statutory regulation or exceeds the permitted use, you will need to obtain permission directly from the copyright holder. To view a
copy of this licence, visit http://creativecommons.org/licenses/by-nc-nd/4.0/. Reprints and permissions ABOUT THIS ARTICLE CITE THIS ARTICLE Nashed, J.Y., Gale, D.J., Gallivan, J.P. _et al._
Changes in cortical manifold structure following stroke and its relation to behavioral recovery in the male macaque. _Nat Commun_ 15, 9005 (2024). https://doi.org/10.1038/s41467-024-53365-4
Download citation * Received: 12 February 2024 * Accepted: 07 October 2024 * Published: 18 October 2024 * DOI: https://doi.org/10.1038/s41467-024-53365-4 SHARE THIS ARTICLE Anyone you share
the following link with will be able to read this content: Get shareable link Sorry, a shareable link is not currently available for this article. Copy to clipboard Provided by the Springer
Nature SharedIt content-sharing initiative