- Select a language for the TTS:
- UK English Female
- UK English Male
- US English Female
- US English Male
- Australian Female
- Australian Male
- Language selected: (auto detect) - EN
Play all audios:
ABSTRACT BACKGROUND Advanced gastro-oesophageal cancer (GEA) treatment has been improved by the introduction of immune checkpoint inhibitors (CPIs), yet identifying predictive biomarkers
remains a priority, particularly in patients with a combined positive score (CPS) < 5, where the benefit is less clear. Our study assesses certain immune microenvironment features related
to sensitivity or resistance to CPIs with the aim of implementing a personalised approach across CPS < 5 GEA. DESIGN Through integrative transcriptomic and clinicopathological analyses,
we studied in both a retrospective and a prospective cohort, the immune tumour microenvironment features. We analysed the cell types composing the immune infiltrate highlighting their
functional activity. RESULTS This integrative study allowed the identification of four different groups across our patients. Among them, we identified a cluster whose tumours expressed the
most gene signatures related to immunomodulatory pathways and immunotherapy response. These tumours presented an enriched immune infiltrate showing high immune function activity that could
potentially achieve the best benefit from CPIs. Finally, our findings were proven in an external CPI-exposed population, where the use of our transcriptomic results combined with CPS helped
better identify those patients who could benefit from immunotherapy than using CPS alone (_p_ = 0.043). CONCLUSIONS This transcriptomic classification could improve precision immunotherapy
for GEA. SIMILAR CONTENT BEING VIEWED BY OTHERS AN INDIVIDUALIZED IMMUNE SIGNATURE OF PRETREATMENT BIOPSIES PREDICTS PATHOLOGICAL COMPLETE RESPONSE TO NEOADJUVANT CHEMORADIOTHERAPY AND
OUTCOMES IN PATIENTS WITH ESOPHAGEAL SQUAMOUS CELL CARCINOMA Article Open access 04 September 2020 A NOVEL HIGH-RISK SUBPOPULATION IDENTIFIED BY CTSL AND ZBTB7B IN GASTRIC CANCER Article 08
August 2022 MULTI-OMIC FEATURES OF OESOPHAGEAL ADENOCARCINOMA IN PATIENTS TREATED WITH PREOPERATIVE NEOADJUVANT THERAPY Article Open access 31 May 2023 BACKGROUND Gastro-oesophageal
adenocarcinoma (GEA) represents the fourth leading cause of cancer death worldwide [1]. Despite significant advances in multimodal approaches and efforts to personalise treatment, overall
survival for metastatic patients is still poor [2]. In the field of immunotherapy, patients with microsatellite instability (MSI-H) have shown greater response to immune checkpoint
inhibitors (CPIs) across different lines [3]. Recently, the combination of platinum-based chemotherapy and immunotherapy as first line strategy has demonstrated a clear improvement in both
progression-free survival (PFS) and overall survival (OS) across GEA [4,5,6]. Furthermore, a randomised trial has also demonstrated the potential role of nivolumab (anti-PD1) as an adjuvant
maintenance strategy in improving PFS in patients with resected stage II or III oesophageal or gastro-oesophageal junction cancer with prior neoadjuvant chemoradiotherapy and residual
pathological disease [7]. Overall, it was demonstrated that GEA patients presenting a combined positive score (CPS) > 5 benefit the most from CPIs. However, a lower benefit was seen in
the CPS ≥ 1 subgroup [6, 8]. There is therefore a pressing need to identify biomarkers predictive of response in patients presenting with a CPS > 1 and <5, as resistance is a frequent
event in this group [9, 10]. An important factor in determining resistance to immunotherapy is the complexity of the tumour immune microenvironment, which influences tumour response to
therapies. Conventionally, so-called “cold tumours” are characterised by an immune desert or immunosuppressive profile which contribute to immune tolerance and progression; in contrast, the
presence of infiltrating immune cells indicates strong immune system activity against tumours [11, 12]. Beyond the ability to determine the presence or lack of immune-infiltrate, therefore,
improved understanding the function of immune cells composing the tumour microenvironment, as well as of cell–cell interactions is required to move precision immunotherapy forward. For this
reason, there is a growing interest in identifying both immune microenvironment and tumour components that could serve as biomarkers able to predict response to standard chemotherapy and
CPIs. In the present study, our aim was to investigate the cellular and functional immune characteristics of the tumour microenvironment, moving to a precision immunotherapy approach. By
performing in-depth transcriptomic study, we propose a novel immune classification for advanced GEA patients, which in combination with CPS could potentially improve the prediction of
response to CPIs. METHODS PATIENT CHARACTERISTICS AND STUDY DESIGN Eligible patients were selected according to the following inclusion and exclusion criteria: male and female patient aged
≥18 years, chemotherapy naive, metastatic, with histologically confirmed GEA, with a CPS < 5 (Supplementary Fig. 1) and no comorbidities that could potentially impair the analyses. This
study was designed with two cohorts: a retrospective one collecting 31 paraffin-embedded samples available for molecular analyses from January 2004 to January 2019, and a second
prospectively collected cohort in which fresh frozen tissues from 23 patients were obtained from January 2020 until September 2021. In both cohorts, chromosomal instability (CIN) cases were
defined as MSS/EBV-negative gastric adenocarcinomas, and genomic stable (GS) cases were defined as MSS/EBV-negative diffuse-type gastric cancers [13]. Blood samples in the second cohort were
collected prior to any oncological treatment. All participants provided written informed consent. The study protocol was approved by our Institutional Review Board. Samples were stored at
the Incliva biobank. An external third cohort was used to validate our findings [14]. This study included 45 patients who after progressing to at least a first-line platinum-based regimen
were treated with a checkpoint-inhibitor as a second or third line. SAMPLE PREPARATION AND TRANSCRIPTOMIC ANALYSES To perform the nCounter analysis, RNA was isolated from five 10-µm-thick
FFPE slides using the RNeasy FFPE Kit (cat. no. 73504, Qiagen) following the manufacturer’s instructions. Its integrity and concentration were evaluated by RNA ScreenTape (Agilent).
Appropriate input was used according to the NanoString protocol, and we conducted the nCounter® PanCancer Immune Profiling panel v1.1 which included 770 genes covering both the adaptive and
innate immune response (NanoString Technologies, Inc., Seattle, WA). To perform RNA-sequencing analysis, RNA from fresh-frozen tissues was extracted by RNeasy micro kit (cat. no. 74004,
Qiagen). Qualities of total RNA samples were determined using an RNA ScreenTape (Agilent technologies). Polyadenylated (poly(A)) RNA was purified using the NEBNext Poly(A) messenger RNA
(mRNA) Magnetic Isolation Module (E7490L, NEB). First-strand and second-strand cDNA was synthesised following the NEBNext Ultra II RNA Library Prep Kit (E7770). The library quality was
assessed using the HSD1000 ScreenTape (Agilent technologies) and quantification was performed using a QuantiFluor dsDNA Kit (Promega) on a Glomax Discovery fluorometer (Promega). Libraries
were then pooled and size-selected to adjust the final library molar concentration for sequencing. Finally, paired-end sequencing was performed in a NextSeq 550 platform (Illumina) using
v2.5 chemistry to a length of 150×2. PATHOLOGICAL ANALYSIS AND TUMOUR MICROENVIRONMENT EVALUATION BY IMMUNOHISTOCHEMISTRY (IHC) IHC staining was performed on the formalin-fixed
paraffin-embedded tissue of 54 GEA using the automated Autostainer Link 48 system (Dako, Glostrup, Denmark). The following antibodies were used: MLH1 (monoclonal mouse, ES05, prediluted,
Dako), MSH2 (monoclonal mouse, FE11, prediluted, Dako), MSH6 (monoclonal rabbit, EP49, prediluted, Dako), PMS2 (monoclonal rabbit, EP51, prediluted, Dako), CD3 (polyclonal, rabbit anti-human
prediluted, Dako), CD8 (monoclonal mouse, C8/144B, prediluted, Dako), CD163 (monoclonal mouse, diluted 1/100, BioCare Medical), HER2 (4B5, prediluted, Ventana-Roche), FOXP3 (D6O8R, 1/100,
Cell signaling), and PD-L1 (monoclonal mouse anti-PD-L1, 22C3, prediluted, Dako) [15, 16]. For MSS/MSI, only complete loss of nuclear staining with positive internal control was considered
loss of mismatch repair (MMR) protein expression. For PD-L1, the combined positive score (CPS) was assessed, as previously described [17]. The percentage of expression in neoplastic and
inflammatory cells was also recorded independently. For CD163, the number and percentage of positive cells in one hotspot 40× field was assessed. The number and percentage of CD3, CD8 and
FOXP3 positive cells were studied in an area of 600 µm by applying the automated artificial intelligence algorithm for “positive cell count” developed by the Qupath software application
(https://qupath.github.io). For EBER evaluation, ISH was performed and interpreted as described in our previous work [18]. HER2 was assessed following consensus recommendations for
gastro-oesophageal neoplasms [16]. All results were confirmed by two dedicated pathologists. TRANSCRIPTOMIC BIOINFORMATIC ANALYSES NanoString gene expression data was log2-transformed and
normalised using the housekeeping genes as control. Tumour immune infiltrate was assessed by immune cell scores defined by NanoString using nSolver v3.0 analysis software (NanoString
Technologies, Inc.). Each functional signature, also predefined by NanoString, was studied by an unsupervised hierarchical clustering heatmap and patients were classified as high function or
low function according to the cluster corresponding to each patient. Heatmaps were performed using Heatmap.plus R package. For RNA-sequencing analyses, raw RNA expression data of the
external CPI-exposed cohort (PRJEB25780) were downloaded from Tumour Immune Dysfunction and Exclusion (http://tide.dfci.harvard.edu/). The same procedure was conducted for both this external
dataset and our prospective cohort. Raw RNAseq reads were processed with fastp v0.20.1 [19] to remove low quality bases and adaptor sequences. Transcript abundance was calculated with
kallisto 0.46.1 [20]. Gene count matrices were built with tximport v1.22 [21]. ComBat-seq [22] was used on the raw counts in order to correct for batch effects. The corrected counts per gene
were then normalised by the variance stabilising transformation (VST) method included in the DESeq2 v1.34.0 package [23]. To identify the presence of infiltration of immune cells, the
Immune score from the ESTIMATE package was calculated [24] using the TPM values obtained with ComBat-Seq. Differential expression analysis was conducted with the DESeq2 v1.34.0 [23] package,
using an adjusted _p_ value cutoff of 0.05 and an absolute log2 fold change over 1. Functional enrichment analysis on differentially expressed genes was done with clusterProfiler v4.2.2
[25], using a hypergeometric (one sided) test with a Benjamini–Hochberg adjusted _p_ value of 0.05. Unsupervised clustering heatmaps were performed using Heatmap.plus R package. BLOOD
CYTOKINE PROFILE BY LUMINEX TECHNOLOGY Blood was drawn by peripheral venipuncture into an EDTA tube and processed to obtain plasma as previously described [26]. Samples were tested as
duplicate. Detection of cytokine levels was performed using MILLIPLEX® MAP Human Cytokine/Chemokine/Growth Factor Panel A (HCYTA-60K, Merck Millipore), following the manufacturer’s
instructions. STATISTICAL DATA ANALYSIS All analyses were carried out using the R software version 4.0.1 [27]. Continuous variables were described using mean and standard deviation if
normality assumptions hold true, median and interquartile range was used otherwise. Qualitative variables are presented in frequencies and percentages. The effect of IIL-FL, IIL-FH, IIH-FL
and IIH-FH in transcriptomic data was studied using Kruskal–Wallis test and _p_ value was adjusted for multiple comparisons using the false discovery rate proposed by Benjamini and Hochberg
[28]. To explore association between tumour immune microenvironment and PFS across platinum-exposed patients, LASSO-Cox regression was carried out using glmnet package [29]. Tenfold
cross-validation was used to estimate lambda value with minimum mean cross-validated error. Selected variables were then dichotomised into “High” and “Low” using maximally selected rank
statistics [30] from the _maxstat_ package [31]. The association of our signature with response to immunotherapy was calculated using Fisher’s exact test and model comparison between PD-L1
alone and PD-L1 plus our signature was evaluated using Chi-square approximation. _p_ Values were considered significant if _p_ < 0.05 based on two-sided testing. RESULTS IDENTIFICATION OF
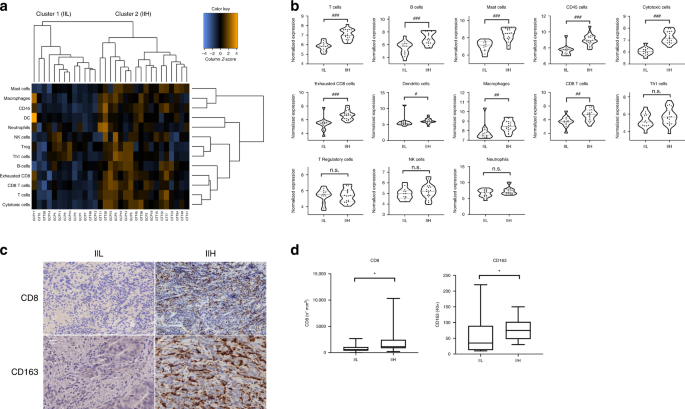
TWO PRINCIPAL IMMUNE TRANSCRIPTOMIC AND IHC PROFILES IN ADVANCED GEA To evaluate GEA microenvironment features, we performed a transcriptomic analysis of the primary tumour of 31
consecutive retrospective patients. Clinicopathological characteristics are provided in Supplementary Table 1. First, an unsupervised hierarchical clustering heatmap considering tumour
immune microenvironment features defined by both the immune infiltrate and its immune cells subsets led us to identify two different immune subtypes of GEA: the first, characterised by a low
immune infiltrate (IIL, low immune infiltrate) and the second, with a high immune infiltrate (IIH, high immune infiltrate) (Fig. 1a). A specific population analysis of several immune cells
detected by the transcriptomic panel was then performed. As expected, the IIH group showed a higher representation of the immune cells (_p_ < 0.05) (Fig. 1b). To validate our findings, we
carried out IHC staining of all the primary tumour samples using a customised in house immune panel to evaluate the presence of CD3+, CD8+, CD163+, FOXP3+ and PD-L1+ cells. The IHC
confirmed an increase in the immune infiltrate in those tumours belonging to the transcriptomic IIH subgroup. We observed that the IHC positivity for lymphocytes CD8+ (_p_ = 0.03) and
macrophages CD163+ (_p_ = 0.03) was associated with the IIH subgroup (Fig. 1c, d). The relevance of CD8+ and CD163+ cells independently from the other markers in determining the IIH group
was also remarked by our transcriptomic results (Fig. 1b). In contrast, no statistical differences were found in IIH versus IIL groups when CD3 and FOXP3 were studied by IHC (data not
shown), which is also in line with what we saw at the gene expression level (Fig. 1b). IMMUNE FUNCTIONAL DIFFERENCES ACROSS GEA TRANSCRIPTOMIC SUBTYPES As tumour microenvironment represents
a dynamic and complex system, beyond identifying two groups based on the amount of immune infiltrate (IIL and IIH), our patients were also classified by the immune function of the cells
composing the immune microenvironment. We performed an unsupervised hierarchical clustering heatmap to study T, NK, macrophages, leucocytes, and B cell functions, as well as functional
signatures for cytokines, complement, chemokines, and interleukins, which clustered GEA tumours into a high or low function group for every single signature (Supplementary Fig. 2). When all
the functional signatures were integrated, our cohort could be divided into two major groups: one presenting high function of cells belonging to the tumour infiltrate (_high function_, FH)
and another characterised by the lack of these functions (_low function_, FL). (Fig. 2a). To better characterise these two groups, a differential gene expression analysis with a Volcano plot
was performed (Fig. 2b), showing that FL tumours expressed the most proliferative genes, such as MAPK and E3 ubiquitin ligase (Supplementary Table 2), which suggested a more aggressive
tumoural phenotype. As expected, low expression of immune response-related genes was found within this subgroup. On the other hand, FH tumours were enriched in immune-related genes pathways,
mostly suggesting a pro-inflammatory profile. These tumours showed hyper-expression of genes related to immune cell recruitment, adaptive and innate immunity, antigen presentation, immune
suppression, and inflammation (Supplementary Table 2). INFILTRATE AND FUNCTIONAL TRANSCRIPTOMIC INTEGRATION TO IDENTIFY FOUR DISTINCT TUMOUR IMMUNE MICROENVIRONMENT PROFILES By using
integrative bioinformatics assessment of both the tumour infiltrate (IIL, IIH) and the function of its component cells (FL, FH), we were able to identify 4 different tumour immune
microenvironment profiles in our cohort, namely, IIL-FL, IIL-FH, IIH-FL and IIH-FH (Fig. 3a). We observed that CIN tumours mostly belonged to groups with FH while the GS subgroup presented
with FL. As expected, MSI-H patients had a IIH and FH profile (Fig. 3a). Next, studying gene expression of the major check-point molecules (_PD1_, _PD-L1_, _CTLA4_) across the identified 4
subgroups, we found that PD1 and PDL1 were significantly more expressed in IIH-FH tumours than in those defined as IIL-FL, while no differences in CTLA-4 were detectable (Fig. 3b). In
addition, we studied a list of relevant immunomodulatory genes such as _HAVCR2, IDO-1, LAG3, TIGIT_ and _TNFRSF4_, observing that they were again overexpressed in the IIH-FH subgroup (Fig.
3c). Intriguingly, another target commonly associated with immune cells, Bruton’s tyrosine kinase (_BTK_), which is associated with lymphocyte activation, was highly expressed among the
IIH-FH group (Fig. 3d). These results suggest that patients belonging to the IIH-FH group could potentially benefit from treatment with a CPI. In addition, several studies have focused on
the relationship between epithelial–mesenchymal transition (EMT) and tumour microenvironment features [32, 33], prompting us to explore the correlation of the EMT with immune infiltrate and
function in our cohort. In this context, IIH-FH tumours presented reduced _CDH1_ expression, suggesting an involvement of the EMT in determining this phenotype (Fig. 3e). Moreover,
expression of _TGF_-_β_, which also plays an important role in the EMT process [34], was higher in the IIH-FH group, supporting this hypothesis (Fig. 3c). TUMOUR IMMUNE MICROENVIRONMENT
INFLUENCE ON PLATINUM-BASED CHEMOTHERAPY RESISTANCE We also studied the potential role of the immune microenvironment in determining chemotherapy response. As platinum-based chemotherapy
represents the gold standard for these patients, we analysed the PFS of all our patients treated with this therapy (81%). Log-rank test stratifying the population by immune infiltrate and
immune function showed no differences in survival curves between the four groups (Supplementary Fig. 3A). To explore the potential relationship between any tumour immune microenvironment
component and PFS across platinum-exposed patients, we performed a multivariable LASSO–Cox analysis with tenfold cross-validation, yielding a lambda value of 0.33. Variables were then
dichotomised using maximally selected rank statistics. We observed that _HLA-DQA1_ expression was related to worse prognosis (_p_ = 0.00059) (Supplementary Fig. 3B). Conversely, high
expression of _DUSP4_, _IRF4_, and _CCRL2_ was associated with better response to platinum-based CT (Supplementary Fig. 3C). VALIDATION OF NCOUNTER RESULTS ACROSS A PROSPECTIVELY COLLECTED
COHORT COMBINING RNASEQ AND PLASMA CYTOKINE PROFILE To validate the nCounter results, we studied immune microenvironment features of 23 consecutive patients belonging to another GEA cohort,
using wider RNA sequencing analysis to overcome the limitations of the predefined panel. Clinicopathological characteristics are provided in Supplementary Table 3. The gene expression
profile of the immune cells present in the tumour infiltrate dichotomises our patients into two groups, IIH (cluster 1 and cluster 2.2) and IIL (cluster 2.1) (Fig. 4a), as previously
obtained with the nCounter analysis. As expected, evaluation of the immune cell scores underlined that the IIH group, has the highest total immune infiltrate (Fig. 4b). To complete the
analysis, we next used a computational algorithm (the immune score of ESTIMATE) [24] for each tumour sample. Finally, it was confirmed that IIH tumours presented a high immune population
(_p_ = 0.028) (Fig. 4c). Furthermore, to overcome the limitation of a descriptive-only evaluation of cellular infiltrate, we added assessment of immune cell function to our study, and were
subsequently able to classify our cohort into FH and FL groups (Fig. 4d). Interestingly, patients belonged to different clusters within the IIH group, suggesting a different functional
profile between them. Patients belonging to Cluster 1 (Fig. 4a) were FH while FL tumours belonged to Cluster 2.2 (Fig. 4a). These results support our hypothesis that cellular function has an
importance beyond infiltrate component evaluation. In this context, to explore whether tumour microenvironment function could be related to cytokine plasma levels, we also studied the
plasma samples of our prospective cohort with a multi-cytokine panel. We found that patients belonging to the FH group presented higher levels of IL-18 (_p_ = 0.042), a pro-inflammatory
cytokine involved in Th1 response as well as in inducing IFN-γ production (Fig. 4e). This result suggests that IL-18 plasma analysis could be useful for monitoring the systemic immune
response. No differences in other cytokines were detectable in our cohort. Finally, considering the immune infiltrate and its function, we were able to classify our patients into the same
four groups as previously described in our retrospective cohort. However, due to the limited sample size, only one patient belonged to the IIL-FH, thus limiting the value of the results in
this group. IIH-FH IMMUNE MICROENVIRONMENT PROFILE AND IMMUNOTHERAPY BENEFIT As previously proposed in our nCounter cohort, patients belonging to the IIH-FH group could potentially benefit
from immunotherapy. Using our second cohort as validation, RNA-seq technology was performed to evaluate immune gene sets that have been associated with CPIs response, such as the HLA and IFN
signatures, and the gene expression of the major checkpoint molecules, overcoming the limitations of the nCounter panel. As expected, all the previously mentioned signatures were highly
expressed in the IIH-FH group (Fig. 5a and Supplementary Fig. 4A–C). Immunomodulatory genes and _BTK_ expression was also studied, and it was possible to confirm their higher expression in
the IIH-FH versus the IIL-FL group (Supplementary Fig. 4D, E). A further analysis of the CXCR5+CD8+ T signature, which has been proposed as a possible biomarker of immunotherapy response in
gastric cancer [35], showed high expression in IIH-FH tumours, while tumours belonging to the IIL-FL presented reduced expression (Fig. 5a and Supplementary Fig. 4F). To analyse further
differences between the IIH-FH and IIL-FL groups, we studied the 50-hallmark gene set signature through the GSEA (Gene Set Enrichment Analysis) [36]. Across the IIH-FH phenotype, we found 30
upregulated gene sets, 18 of them with an FDR < 25% (_q_-value: <0.25) (Supplementary Table 4). Among them, the inflammatory response signature, the IFN-γ and IFN-α responses, and
IL-2-STAT5 signalling pathway were significantly enriched (Fig. 5b). Notably, the EMT signature was newly highly represented among the IIH-FH subgroup, highlighting the potential relation
between microenvironment and tumour mesenchymal phenotype. Conversely, in the IIL-FL group we found 20 upregulated gene sets, 18 of which had an FDR < 25% (_q_-value: <0.25)
(Supplementary Table 5). Among them, the E2F, MYC and G2M checkpoint targets signatures were enriched, highlighting a more proliferative phenotype (Fig. 5b). To understand the differences
between IIH-FH and IIL-FL tumours we analysed the differential gene expression profile between these two groups. 626 genes were found to be differentially expressed between them (adjusted
_p_ value <0.05; |log2FC| > 1; Fig. 5c). A Gene Ontology biological process enrichment analysis showed that Cytokine-mediated signalling pathways, T cell activation and leucocyte
migration were differentially expressed among the two profiles (Fig. 5d), suggesting a potentially key role for the immune phenotype in determining which group a tumour belongs to.
Interestingly, the chemokine and IL-18 signalling pathways were significantly enriched in a functional enrichment analysis (Fig. 5e). This result suggests that IL-18 may contribute to
differential functional states of the tumour immune microenvironment. IMMUNE TRANSCRIPTOMIC PROFILE FOR PREDICTION OF IMMUNOTHERAPY RESPONSE BEYOND CPS IN A CPI-EXPOSED COHORT OF ADVANCED
GEA Our previous analyses support a role for transcriptomics in potentially identifying CPI-sensitive tumours. To further evaluate the predictive value of our immune classification, we
tested it by in silico analysis in an external CPI-exposed cohort [14]. Among the CPS < 5 population, only 9.7% achieved a response from pembrolizumab (anti-PD1), while most patients with
CPS ≥ 5 benefitted from immunotherapy, underlining the importance of additional biomarkers in the population with CPS < 5. When we tested our transcriptomic classification in this
external cohort, we identified three immune microenvironment profiles: IIL-FL, IIH-FL and IIH-FH. In particular, 67% of immunotherapy responders belonged to the IIH-FH group. Furthermore,
our classification was significantly associated with response to immunotherapy (_p_ = 0.003). A logistic regression model combining CPS and our immune transcriptomic classification increased
the model fit compared to CPS alone (_p_ = 0.043). Beyond PD-L1 expression, therefore, our model was able to predict response in patients with CPS < 5. DISCUSSION Our study describes
four distinct immune microenvironment profiles according to immune infiltrate and its function (IIL-FL, IIL-FH, IIH-FL and IIH-FH), using multifactorial assessment of transcriptomic and
pathological features in patients with advanced GEA. This subclassification is of interest to potentially detect sensitivity or resistance to CPIs. Intriguingly, tumours belonging to the
IIH-FH subgroup expressed the most gene signatures related to immunomodulatory pathways and immunotherapy response. These results were confirmed with an internal second cohort and finally
validated “in silico” in an external CPI-exposed population, where 67% of immunotherapy responders belonged to the IIH-FH group. Furthermore, our signature was associated with response to
immunotherapy (_p_ = 0.003) and a logistic regression model combining CPS and our transcriptomic analyses showed that using both tools allowed more precise detection of patients who could
benefit from immunotherapy than using CPS alone (_p_ = 0.043). Transcriptomic analyses are improving our knowledge of immune tumour microenvironment [37,38,39]. Most research has focused on
studying immune infiltrate composition to understand resistance to CPIs [12, 40, 41], while there is growing evidence that the functional status of the immune microenvironment marks the
difference in immunotherapy response [42,43,44]. Analysis of immune function could therefore help in determining sensitivity or resistance to immunotherapy. In this regard, our gene
expression analysis showed that FH tumours were mostly enriched in immune-related genes, while FL tumours principally expressed genes involved in cell proliferation. Further, by examining
both the infiltrate composition and its function we were able to describe distinct immune microenvironment profiles: IIL-FL, IIL-FH, IIH-FL and IIH-FH. Of interest, it was confirmed that
tumours belonging to the IIH-FH subgroup expressed the most immunomodulatory genes, such as _TIM3, IDO-1, LAG3, TIGIT_ and _OX40_, making them potential candidates for classic CPI (anti
PD-L1, PD1, CTLA4) or novel immunotherapy combinations such as anti-LAG3 and anti-TIM3 bispecific antibodies which could overcome primary or secondary resistance [45]. To complete our study,
we also evaluated intrinsic tumour features, such as EMT. The bilateral dynamical interaction between EMT and microenvironment in determining a pro- or anti-inflammatory profile has been
recently described in several tumour models [46]. Our results showed that IIH-FH tumours presented reduced expression of _CDH1_ and higher expression of _TGF_-β, suggesting a mesenchymal
phenotype. The prognostic role of tumour microenvironment in predicting response to chemotherapy has been investigated in several studies [47, 48]. In our cohort, the aim was to assess
whether belonging to any of the four previously identified immune groups could have a prognostic role with respect to PFS with first line platinum-based chemotherapy. Cox regression analysis
showed no differences between the 4 groups, although with LASSO-Cox analysis HLA-DQA1 expression was related to worse prognosis (_p_ = 0.00059). The association between this HLA and
platinum resistance has already been observed in other relevant research, even at a single cell level [49]. The NCounter allowed us to identify the four previously mentioned immune
microenvironment profiles, based on population and functional analysis. To validate this immune classification and overcome the limitation of the number of genes included in an array panel,
we used RNA sequencing to analyse the transcriptome of a prospective cohort of advanced GEA patients, who shared the same clinic and pathological characteristics as the first retrospective
cohort. In this case, we were able to divide the population into the same four subgroups. As proposed, the function of those cells composing the tumour immune microenvironment could play a
key role in determining sensitivity or resistance to CPIs. In this regard, we found that patients belonging to the FH group presented higher plasma levels of IL-18 (_p_ = 0.042) than those
defined as FL. IL-18 is a pro-inflammatory cytokine involved in Th1 response as well as in inducing IFN-γ production [50]. This result suggests that regardless of immune infiltrate, FH
tumours may exhibit high antitumoural activity and a systemic pro-inflammatory profile. Furthermore, differential gene expression analysis showed that IL-18 signalling pathway was
significantly more enriched in IIH-FH tumours than IIL-FL ones. The role of IL-18 in relation to immune activity and immunotherapy warrants further studies in a larger cohort of GEA
patients. As expected, IIH-FH exhibits EMT and an inflamed phenotype, with high expression of genes related to HLAs, interferon-γ activation and immune checkpoints. In particular, the
inflammatory response signature, IFN-γ and IFN-α responses and the IL-2-STAT5 signalling pathways were significantly enriched among the IIH-FH subgroup, as shown in GSEA analysis. These
results confirmed the previous ones observed in the retrospective nCounter cohort. Finally, to evaluate whether this transcriptomic classification could help identify patients who would
potentially benefit from CPI, we studied a cohort of GEA patients treated with pembrolizumab as second or third line. Interestingly, 67% (8/12) of immunotherapy responders belonged to the
IIH-FH group. Across this cohort, our signature was associated with response to immunotherapy (_p_ = 0.003). Moreover, the logistic regression model combining CPS and our transcriptomic
analysis showed that use of both tools increased the ability to detect patients who could benefit from immunotherapy versus CPS alone (_p_ = 0.043). An important finding in our study is that
all patients belonging to the first and second cohorts had CPS < 5, potentially indicating a marginal benefit of adding immunotherapy. However, CPI sensitivity was found when an active,
highly functional immune microenvironment was confirmed in our transcriptomic analysis. This study presents some limitations derived from its exploratory design, such as the small sample
size for both retrospective and prospective cohorts without previous exposure to immunotherapy, and the validation of our results performed in silico in a public cohort. In conclusion, our
work allows the identification of an immune-enriched subtype of advanced GEA, characterised by high immune cell activation, which could potentially help achieve a more precise immunotherapy
approach beyond CPS. Further evaluation of the capabilities of this transcriptomic classification are needed in wider cohorts of CPI-exposed patients. DATA AVAILABILITY All data relevant to
the study are included in the article or uploaded as supplementary material. The data sets redacted, the statistical analysis plan and individual participants’ data supporting the results
reported in this article will be made available from the corresponding author on reasonable request. REFERENCES * Sung H, Ferlay J, Siegel RL, Laversanne M, Soerjomataram I, Jemal A, et al.
Global Cancer Statistics 2020: GLOBOCAN estimates of incidence and mortality worldwide for 36 cancers in 185 countries. CA Cancer J Clin. 2021;71:209-49. * Smyth EC, Verheij M, Allum W,
Cunningham D, Cervantes A, Arnold D. Gastric cancer: ESMO Clinical Practice Guidelines for diagnosis, treatment and follow-up. Ann Oncol. 2016;27:v38–49. Article CAS PubMed Google Scholar
* Chao J, Fuchs CS, Shitara K, Tabernero J, Muro K, Van Cutsem E, et al. Assessment of pembrolizumab therapy for the treatment of microsatellite instability–high gastric or
gastroesophageal junction cancer among patients in the KEYNOTE-059, KEYNOTE-061, and KEYNOTE-062 clinical trials. JAMA Oncol. 2021;7:895–902. Article PubMed PubMed Central Google Scholar
* Boku N, Ryu MH, Oh D-Y, Oh SC, Chung HC, Lee K-W, et al. LBA7_PR - Nivolumab plus chemotherapy versus chemotherapy alone in patients with previously untreated advanced or recurrent
gastric/gastroesophageal junction (G/GEJ) cancer: ATTRACTION-4 (ONO-4538-37) study. Ann Oncol. 2020;31:S1142–215. 101016/annonc/annonc325. Article Google Scholar * Sun JM, Shen L, Shah MA,
Enzinger P, Adenis A, Doi T, et al. Pembrolizumab plus chemotherapy versus chemotherapy alone for first-line treatment of advanced oesophageal cancer (KEYNOTE-590): a randomised,
placebo-controlled, phase 3 study. Lancet. 2021;398:759–71. Article CAS PubMed Google Scholar * Janjigian YY, Shitara K, Moehler M, Garrido M, Salman P, Shen L, et al. First-line
nivolumab plus chemotherapy versus chemotherapy alone for advanced gastric, gastro-oesophageal junction, and oesophageal adenocarcinoma (CheckMate 649): a randomised, open-label, phase 3
trial. Lancet. 2021;398:27–40. Article CAS PubMed PubMed Central Google Scholar * Kelly RJ, Ajani JA, Kuzdzal J, Zander T, Van Cutsem E, Piessen G, et al. Adjuvant nivolumab in resected
esophageal or gastroesophageal junction cancer. N Engl J Med. 2021;384:1191–203. Article CAS PubMed Google Scholar * Zhao JJ, Yap DWT, Chan YH, Tan BKJ, Teo CB, Syn NL, et al. Low
programmed death-ligand 1–expressing subgroup outcomes of first-line immune checkpoint inhibitors in gastric or esophageal adenocarcinoma. J Clin Oncol. 2022;40:392–402. Article CAS PubMed
Google Scholar * Jenkins RW, Barbie DA, Flaherty KT. Mechanisms of resistance to immune checkpoint inhibitors. Br J Cancer. 2018;118:9–16. Article CAS PubMed PubMed Central Google
Scholar * Smyth EC, Gambardella V, Cervantes A, Fleitas T. Checkpoint inhibitors for gastroesophageal cancers: dissecting heterogeneity to better understand their role in first-line and
adjuvant therapy. Ann Oncol. 2021;32:590–9. Article CAS PubMed Google Scholar * Derks S, de Klerk LK, Xu X, Fleitas T, Liu KX, Liu Y, et al. Characterizing diversity in the tumor-immune
microenvironment of distinct subclasses of gastroesophageal adenocarcinomas. Ann Oncol. 2020;31:1011–20. Article CAS PubMed Google Scholar * Gambardella V, Castillo J, Tarazona N,
Gimeno-Valiente F, Martínez-Ciarpaglini C, Cabeza-Segura M, et al. The role of tumor-associated macrophages in gastric cancer development and their potential as a therapeutic target. Cancer
Treat Rev. 2020;86:102015. Article CAS PubMed Google Scholar * Cancer Genome Atlas Research Network. Comprehensive molecular characterization of gastric adenocarcinoma. Nature.
2014;513:202–9. Article Google Scholar * Kim ST, Cristescu R, Bass AJ, Kim KM, Odegaard JI, Kim K, et al. Comprehensive molecular characterization of clinical responses to PD-1 inhibition
in metastatic gastric cancer. Nat Med. 2018;24:1449–58. Article CAS PubMed Google Scholar * Smolińska M, Grzanka D, Antosik P, Kasperska A, Neska-Długosz I, Jóźwicki J, et al. HER2,
NFκB, and SATB1 expression patterns in gastric cancer and their correlation with clinical and pathological parameters. Dis Markers. 2019;2019:6315936. Article PubMed PubMed Central Google
Scholar * Bartley AN, Washington MK, Ventura CB, Ismaila N, Colasacco C, Benson AB 3rd, et al. HER2 testing and clinical decision making in gastroesophageal adenocarcinoma: guideline from
the College of American Pathologists, American Society for Clinical Pathology, and American Society of Clinical Oncology. Am J Clin Pathol. 2016;146:647–69. Article PubMed Google Scholar
* Ahn S, Kim K-M. PD-L1 expression in gastric cancer: interchangeability of 22C3 and 28-8 pharmDx assays for responses to immunotherapy. Mod Pathol. 2021;34:1719–27. Article CAS PubMed
Google Scholar * Martinez-Ciarpaglini C, Fleitas-Kanonnikoff T, Gambardella V, Llorca M, Mongort C, Mengual R, et al. Assessing molecular subtypes of gastric cancer: microsatellite unstable
and Epstein-Barr virus subtypes. Methods for detection and clinical and pathological implications. ESMO Open. 2019;4:e000470. Article PubMed PubMed Central Google Scholar * Chen S, Zhou
Y, Chen Y, Gu J. fastp: an ultra-fast all-in-one FASTQ preprocessor. Bioinformatics. 2018;34:i884–90. Article PubMed PubMed Central Google Scholar * Bray NL, Pimentel H, Melsted P,
Pachter L. Near-optimal probabilistic RNA-seq quantification. Nat Biotechnol. 2016;34:525–7. Article CAS PubMed Google Scholar * Soneson C, Love MI, Robinson MD. Differential analyses
for RNA-seq: transcript-level estimates improve gene-level inferences. F1000Res. 2015;4:1521. Article PubMed Google Scholar * Zhang Y, Parmigiani G, Johnson WE. ComBat-seq: batch effect
adjustment for RNA-seq count data. NAR Genom Bioinform. 2020;2:lqaa078. * Love MI, Huber W, Anders S. Moderated estimation of fold change and dispersion for RNA-seq data with DESeq2. Genome
Biol. 2014;15:550. Article PubMed PubMed Central Google Scholar * Yoshihara K, Shahmoradgoli M, Martínez E, Vegesna R, Kim H, Torres-Garcia W, et al. Inferring tumour purity and stromal
and immune cell admixture from expression data. Nat Commun. 2013;4:2612. Article PubMed Google Scholar * Yu G, Wang LG, Han Y, He QY. clusterProfiler: an R package for comparing
biological themes among gene clusters. Omics. 2012;16:284–7. Article CAS PubMed PubMed Central Google Scholar * Henriksen TV, Tarazona N, Frydendahl A, Reinert T, Gimeno-Valiente F,
Carbonell-Asins JA, et al. Circulating tumor DNA in stage III colorectal cancer, beyond minimal residual disease detection, toward assessment of adjuvant therapy efficacy and clinical
behavior of recurrences. Clin Cancer Res. 2022;28:507–17. Article CAS PubMed Google Scholar * R Core Team. R: a language and environment for statistical computing. Vienna: R Foundation
for Statistical Computing; 2021. Google Scholar * Benjamini Y, Hochberg Y. Controlling the false discovery rate: a practical and powerful approach to multiple testing. J R Stat Soc: Ser B
(Methodol). 1995;57:289–300. Google Scholar * Friedman J, Hastie T, Tibshirani R. Regularization paths for generalized linear models via coordinate descent. J Stat Softw. 2010;33:1–22.
Article PubMed PubMed Central Google Scholar * Lausen B, Schumacher M. Maximally selected rank statistics. Biometrics. 1992;48:73–85. Article Google Scholar * Hothorn T. maxstat:
Maximally selected rank statistics. R package version 0.7-25. 2017. * Terry S, Savagner P, Ortiz-Cuaran S, Mahjoubi L, Saintigny P, Thiery JP, et al. New insights into the role of EMT in
tumor immune escape. Mol Oncol. 2017;11:824–46. Article PubMed PubMed Central Google Scholar * Dongre A, Weinberg RA. New insights into the mechanisms of epithelial-mesenchymal
transition and implications for cancer. Nat Rev Mol Cell Biol. 2019;20:69–84. Article CAS PubMed Google Scholar * Pickup M, Novitskiy S, Moses HL. The roles of TGFβ in the tumour
microenvironment. Nat Rev Cancer. 2013;13:788–99. Article CAS PubMed PubMed Central Google Scholar * Wang J, Li R, Cao Y, Gu Y, Fang H, Fei Y, et al. Intratumoral CXCR5(+)CD8(+)T
associates with favorable clinical outcomes and immunogenic contexture in gastric cancer. Nat Commun. 2021;12:3080. Article CAS PubMed PubMed Central Google Scholar * Subramanian A,
Tamayo P, Mootha VK, Mukherjee S, Ebert BL, Gillette MA, et al. Gene set enrichment analysis: a knowledge-based approach for interpreting genome-wide expression profiles. Proc Natl Acad Sci
USA. 2005;102:15545–50. Article CAS PubMed PubMed Central Google Scholar * Bagaev A, Kotlov N, Nomie K, Svekolkin V, Gafurov A, Isaeva O, et al. Conserved pan-cancer microenvironment
subtypes predict response to immunotherapy. Cancer Cell. 2021;39:845.e7–65.e7. Article Google Scholar * Davis-Marcisak EF, Deshpande A, Stein-O’Brien GL, Ho WJ, Laheru D, Jaffee EM, et al.
From bench to bedside: single-cell analysis for cancer immunotherapy. Cancer Cell. 2021;39:1062–80. Article CAS PubMed PubMed Central Google Scholar * Zheng L, Qin S, Si W, Wang A,
Xing B, Gao R, et al. Pan-cancer single-cell landscape of tumor-infiltrating T cells. Science. 2021;374:abe6474. Article PubMed Google Scholar * Liu D, Lin JR, Robitschek EJ, Kasumova GG,
Heyde A, Shi A, et al. Evolution of delayed resistance to immunotherapy in a melanoma responder. Nat Med. 2021;27:985–92. Article CAS PubMed PubMed Central Google Scholar * Sundar R,
Huang KK, Qamra A, Kim KM, Kim ST, Kang WK, et al. Epigenomic promoter alterations predict for benefit from immune checkpoint inhibition in metastatic gastric cancer. Ann Oncol.
2019;30:424–30. Article CAS PubMed PubMed Central Google Scholar * Gajewski TF, Schreiber H, Fu YX. Innate and adaptive immune cells in the tumor microenvironment. Nat Immunol.
2013;14:1014–22. Article CAS PubMed PubMed Central Google Scholar * Joyce JA, Fearon DT. T cell exclusion, immune privilege, and the tumor microenvironment. Science. 2015;348:74–80.
Article CAS PubMed Google Scholar * Spranger S, Gajewski TF. Tumor-intrinsic oncogene pathways mediating immune avoidance. Oncoimmunology. 2016;5:e1086862. Article PubMed Google
Scholar * Waldman AD, Fritz JM, Lenardo MJ. A guide to cancer immunotherapy: from T cell basic science to clinical practice. Nat Rev Immunol. 2020;20:651–68. Article CAS PubMed PubMed
Central Google Scholar * Aggarwal V, Montoya CA, Donnenberg VS, Sant S. Interplay between tumor microenvironment and partial EMT as the driver of tumor progression. iScience.
2021;24:102113. Article CAS PubMed PubMed Central Google Scholar * Wu T, Dai Y. Tumor microenvironment and therapeutic response. Cancer Lett. 2017;387:61–8. Article CAS PubMed Google
Scholar * Roma-Rodrigues C, Mendes R, Baptista PV, Fernandes AR. Targeting tumor microenvironment for cancer therapy. Int J Mol Sci. 2019;20:840. * Gay CM, Stewart CA, Park EM, Diao L,
Groves SM, Heeke S, et al. Patterns of transcription factor programs and immune pathway activation define four major subtypes of SCLC with distinct therapeutic vulnerabilities. Cancer Cell.
2021;39:346.e7–60.e7. Article Google Scholar * Garlanda C, Dinarello CA, Mantovani A. The interleukin-1 family: back to the future. Immunity. 2013;39:1003–18. Article CAS PubMed PubMed
Central Google Scholar Download references ACKNOWLEDGEMENTS We gratefully acknowledge the support of the INCLIVA BioBank (PT17/0015/0049; B.000768 ISCIII) as part of the Valencian
Biobanking Network and the Spanish National Biobanks Network, and especially wish to thank all patients and families for their participation in this study. Spacial thanks go to Zahara
Garzón, Pablo Navarro, Andrés Peña, the Precision Medicine Unit, the Bioinformatics and Biostatistics Units from INCLIVA for their support in this project. FUNDING This work was supported by
grants from the Carlos III Health Institute [grant number PI18/01508 and PI21/0693] to TF, [grant number PI18/01909 and PI21/00689] to AC and NT and [grant number PI21/00695] to CM. MC-S
was supported with a predoctoral grant PRDVA19006CABE by Asociación Española Contra el Cáncer AECC. TF was supported by Joan Rodés contract JR17/00026 from the Carlos III Health Institute.
VG was funded by a Joan Rodés contract JR21/00042 from the Carlos III Health Institute; FG-V was founded by a post doc grant by Generalitat Valenciana Grant APOSTD/2021/168; NT was funded by
Joan Rodés contract JR20/00005 from the Carlos III Health Institute. DR was funded by Joan Rodés contract JR16/00040 from the Carlos III Health Institute. JC was granted with a VLC
Bioclinic grant 2021/257 from the University of Valencia. SZ-T was granted by a grant CA18/00042 contract for bioinformaticians from Carlos III. Part of the equipment used in this study has
been funded by Generalitat Valenciana and co-financed with ERDF funds (OP ERDF of Comunitat Valenciana 2014–2020). INCLIVA BioBank PT17/0015/0049 B.000768 ISCIII Valencian Biobanking Network
Spanish National Biobanks Network. NanoString and Illumina equipment are co-financed by the European Union through the Operational Program of the European Regional Development Fund (ERDF)
of the Valencian Community 2014–2020. AUTHOR INFORMATION Author notes * These authors contributed equally: Manuel Cabeza-Segura, Valentina Gambardella. * These authors jointly supervised
this work: Andrés Cervantes, Tania Fleitas. AUTHORS AND AFFILIATIONS * Department of Medical Oncology, Hospital Clínico Universitario, INCLIVA, Biomedical Research Institute, University of
Valencia, Valencia, Spain Manuel Cabeza-Segura, Valentina Gambardella, Francisco Gimeno-Valiente, Marisol Huerta, Susana Roselló, Desamparados Roda, Noelia Tarazona, Josefa Castillo, Andrés
Cervantes & Tania Fleitas * CIBERONC, Instituto de Salud Carlos III, Madrid, Spain Valentina Gambardella, Susana Roselló, Desamparados Roda, Noelia Tarazona, Carolina
Martínez-Ciarpaglini, Josefa Castillo, Andrés Cervantes & Tania Fleitas * Cancer Evolution and Genome Instability Laboratory, UCL Cancer Institute, London, UK Francisco Gimeno-Valiente *
Department of Bioinformatics and Biostatistics. INCLIVA, Biomedical Research Institute, Valencia, Spain Juan Antonio Carbonell-Asins, Arturo González-Vilanova & Sheila Zuñiga-Trejos *
Department of Pathology, INCLIVA, Biomedical Research Institute, University of Valencia, Valencia, Spain Lorena Alarcón-Molero & Carolina Martínez-Ciarpaglini * Department of Precision
Medicine, INCLIVA, Biomedical Research Institute, Valencia, Spain Pilar Rentero-Garrido * Department of Gastroenterology and Hepatology, Hospital Clínico Universitario de Valencia, Valencia,
Spain Rosana Villagrasa * Department of Medical Oncology, Hospital General Universitario, Valencia, Spain Mireia Gil * Department of Gastroenterology and Hepatology, Hospital General
Universitario, Valencia, Spain Ana Durá * Department of Medical Oncology, Hospital Universitario y Politécnico La Fe, Valencia, Spain Paula Richart * Department of Gastroenterology and
Hepatology, Hospital Universitario y Politécnico La Fe, Valencia, Spain Noelia Alonso * Department of Biochemistry and Molecular Biology, University of Valencia, Valencia, Spain Josefa
Castillo Authors * Manuel Cabeza-Segura View author publications You can also search for this author inPubMed Google Scholar * Valentina Gambardella View author publications You can also
search for this author inPubMed Google Scholar * Francisco Gimeno-Valiente View author publications You can also search for this author inPubMed Google Scholar * Juan Antonio Carbonell-Asins
View author publications You can also search for this author inPubMed Google Scholar * Lorena Alarcón-Molero View author publications You can also search for this author inPubMed Google
Scholar * Arturo González-Vilanova View author publications You can also search for this author inPubMed Google Scholar * Sheila Zuñiga-Trejos View author publications You can also search
for this author inPubMed Google Scholar * Pilar Rentero-Garrido View author publications You can also search for this author inPubMed Google Scholar * Rosana Villagrasa View author
publications You can also search for this author inPubMed Google Scholar * Mireia Gil View author publications You can also search for this author inPubMed Google Scholar * Ana Durá View
author publications You can also search for this author inPubMed Google Scholar * Paula Richart View author publications You can also search for this author inPubMed Google Scholar * Noelia
Alonso View author publications You can also search for this author inPubMed Google Scholar * Marisol Huerta View author publications You can also search for this author inPubMed Google
Scholar * Susana Roselló View author publications You can also search for this author inPubMed Google Scholar * Desamparados Roda View author publications You can also search for this author
inPubMed Google Scholar * Noelia Tarazona View author publications You can also search for this author inPubMed Google Scholar * Carolina Martínez-Ciarpaglini View author publications You
can also search for this author inPubMed Google Scholar * Josefa Castillo View author publications You can also search for this author inPubMed Google Scholar * Andrés Cervantes View author
publications You can also search for this author inPubMed Google Scholar * Tania Fleitas View author publications You can also search for this author inPubMed Google Scholar CONTRIBUTIONS
Conceptualisation—MC-S, VG, FG-V, JC and TF. Data curation—MC-S, VG, FG-V, JAC-A, AG-V, SZ-T, PR-G, CM-C, JC and TF. Formal analyses—MC-S, VG, FG-V, JAC-A, AG-V, JC and TF. Funding
acquisition—DR, NT, CM-C, JC, AC and TF. Investigation— MC-S, VG, FG-V, JC and TF. Methodology—MC-S, VG, FG-V, JAC-A, LA-M, AG-V, SZ-T, PR-G, CM-C, JC and TF. Project administration—TF.
Resources—RV, MG, AD, PR, NA, MH, SR, DR, NT and TF. Software—MC-S, VG, FG-V, AG-V and SZ-T. Supervision—JC, AC and TF. Validation— RV, MG, AD, PR, NA, MH, SR, DR, NT and TF.
Visualisation—All. Writing—Original draft—MC-S, VG, FG-V, JC, AC and TF. Writing—Review and editing— MC-S, VG, FG-V, JC, AC and TF. CORRESPONDING AUTHOR Correspondence to Tania Fleitas.
ETHICS DECLARATIONS COMPETING INTERESTS AC declares institutional research funding from Genentech, Merck Serono, BMS, MSD, Roche, Beigene, Bayer, Servier, Lilly, Novartis, Takeda, Astellas,
Takeda, Natera and Fibrogen and advisory board or speaker fees from Amgem, Merck Serono, Roche, Bayer, Servier and Pierre Fabre in the last 5 years. All remaining authors have declared no
conflict of interest. ETHICS APPROVAL AND CONSENT TO PARTICIPATE The study was approved by the institutional review board of INCLIVA (Approval ID: CEIC-2018.054). The study was conducted in
accordance with the declaration of Helsinki, and was approved by the institutional review board. Written informed consent was obtained from all patients to perform the molecular analysis.
CONSENT FOR PUBLICATION Not applicable. ADDITIONAL INFORMATION PUBLISHER’S NOTE Springer Nature remains neutral with regard to jurisdictional claims in published maps and institutional
affiliations. SUPPLEMENTARY INFORMATION SUPPLEMENTARY TABLES AND FIGURES WITH LEGENDS RIGHTS AND PERMISSIONS OPEN ACCESS This article is licensed under a Creative Commons Attribution 4.0
International License, which permits use, sharing, adaptation, distribution and reproduction in any medium or format, as long as you give appropriate credit to the original author(s) and the
source, provide a link to the Creative Commons license, and indicate if changes were made. The images or other third party material in this article are included in the article’s Creative
Commons license, unless indicated otherwise in a credit line to the material. If material is not included in the article’s Creative Commons license and your intended use is not permitted by
statutory regulation or exceeds the permitted use, you will need to obtain permission directly from the copyright holder. To view a copy of this license, visit
http://creativecommons.org/licenses/by/4.0/. Reprints and permissions ABOUT THIS ARTICLE CITE THIS ARTICLE Cabeza-Segura, M., Gambardella, V., Gimeno-Valiente, F. _et al._ Integrative immune
transcriptomic classification improves patient selection for precision immunotherapy in advanced gastro-oesophageal adenocarcinoma. _Br J Cancer_ 127, 2198–2206 (2022).
https://doi.org/10.1038/s41416-022-02005-z Download citation * Received: 09 May 2022 * Revised: 18 September 2022 * Accepted: 27 September 2022 * Published: 17 October 2022 * Issue Date: 07
December 2022 * DOI: https://doi.org/10.1038/s41416-022-02005-z SHARE THIS ARTICLE Anyone you share the following link with will be able to read this content: Get shareable link Sorry, a
shareable link is not currently available for this article. Copy to clipboard Provided by the Springer Nature SharedIt content-sharing initiative