- Select a language for the TTS:
- UK English Female
- UK English Male
- US English Female
- US English Male
- Australian Female
- Australian Male
- Language selected: (auto detect) - EN
Play all audios:
ABSTRACT Personalized cancer treatments using combinations of drugs with a synergistic effect is attractive but proves to be highly challenging. Here we present an approach to uncover the
efficacy of drug combinations based on the analysis of mono-drug effects. For this we used dose-response data from pharmacogenomic encyclopedias and represent these as a drug atlas. The drug
atlas represents the relations between drug effects and allows to identify independent processes for which the tumor might be particularly vulnerable when attacked by two drugs. Our
approach enables the prediction of combination-therapy which can be linked to tumor-driving mutations. By using this strategy, we can uncover potential effective drug combinations on a
pan-cancer scale. Predicted synergies are provided and have been validated in glioblastoma, breast cancer, melanoma and leukemia mouse-models, resulting in therapeutic synergy in 75% of the
tested models. This indicates that we can accurately predict effective drug combinations with translational value. SIMILAR CONTENT BEING VIEWED BY OTHERS ADDITIVITY PREDICTS THE EFFICACY OF
MOST APPROVED COMBINATION THERAPIES FOR ADVANCED CANCER Article 16 November 2023 MUSYC IS A CONSENSUS FRAMEWORK THAT UNIFIES MULTI-DRUG SYNERGY METRICS FOR COMBINATORIAL DRUG DISCOVERY
Article Open access 29 July 2021 HARNESSING MACHINE LEARNING TO FIND SYNERGISTIC COMBINATIONS FOR FDA-APPROVED CANCER DRUGS Article Open access 29 January 2024 INTRODUCTION Personalized
therapies against tumor-driving targets are being used effectively in the clinic, but in many cases drug resistance occurs giving rise to inevitable relapses1,2,3,4,5,6,7. Since tumors are
dependent on a limited number of molecular mechanisms for their survival/proliferation, combination therapy enables simultaneous targeting of these crucial mechanisms and is expected to
decrease therapy resistance8,9,10,11,12. Many positive effects of drug combinations in the clinic are reflective of the best response to either one of the two drugs13. Therefore,
combinations of drugs are commonly more effective because each drug compensates for the drawback of the other drug. Currently, only a fraction of these combinations provide synergistic
(i.e., more than additive) effects13. Therefore, the identification of crucial mechanisms that lead to synergistic drug effects is highly desirable. However, the identification of these drug
combinations has so far only been possible using an empirical setting (i.e., high-throughput testing of all combinations for each cell line), followed by identification of molecular
features such as genetic mutations and transcriptome, methylome, and proteome genomic data to predict the therapy response (reviewed14,15,16). This showed that synergy prediction is
possible17, although with a limited overall probability and only applicable on a defined lineage background. The recent pan-cancer DREAM community effort of the Drug Combination Prediction
Challenge confirmed these previous findings on a pan-cancer scale18. Drug combination therapies where drugs work synergistically are expected to be particularly useful for tumor types for
which chemotherapeutic and targeted approaches have failed or show frequent cases of therapy resistance. Among these are Glioblastoma (GBM) but also triple-negative breast tumor patients19,
BRAF-driven melanoma20, and BCR-ABL-driven chronic myeloid leukemias21. Given that not all possible drug combinations can be tested onto each patient-specific mutation profile, a major
challenge is to orchestrate the most effective combination therapies to a large range of genetic mutation profiles of patients. Here, we use an approach to identify synergistic drug pairs
based on a method that we call the drug atlas. This method enables us to predict drug vulnerabilities based on single drug-response data on a pan-cancer scale and link this to personalized
features. Our methodology forms a generalizable strategy to identify personalized multidrug therapies and enabled us to identify novel and unexpected combination therapies. RESULTS A DRUG
ATLAS ALLOWS VISUALIZATION OF COMPLEX SYNERGISTIC DRUG INTERACTIONS The number of possible effective combinations of existing anticancer drugs is enormous and calls for a rational approach
to select the most potential combinations, also taking into account the genetic background of the individual case. We reasoned that relations between cancer processes can be reflected by the
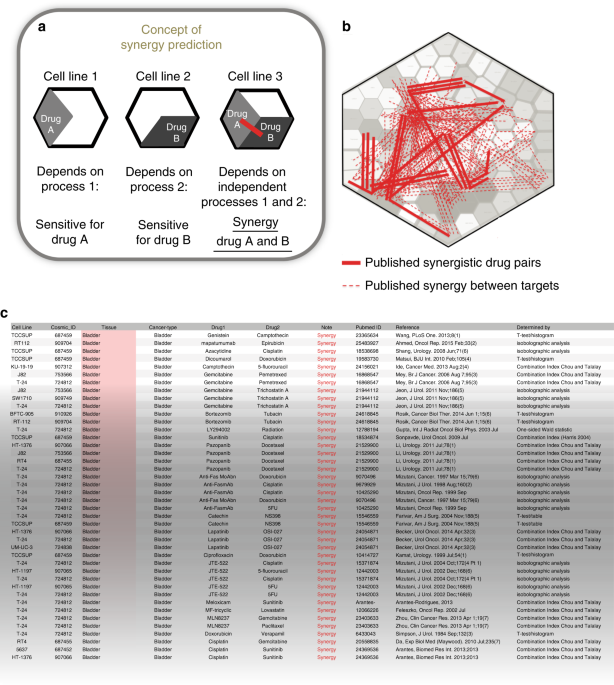
relations between drug effects. Therefore, drug-response data might guide us towards combination therapies that affect tumor-driving processes simultaneously. Our approach is exemplified in
Fig. 1a: if a cell line is sensitive to drug A and not to drug B, or vice versa, then the underlying processes are apparently working independently by showing exclusive vulnerabilities. If
a third cell line is, however, sensitive to both drug A and B, then these independent processes can be targeted simultaneously and form a co-vulnerability. We argued that we can use this
concept to identify commonly occurring co-vulnerabilities in cancer cell lines, and when these are treated with the right combination therapies, then more than additive (synergistic) drug
effects can be expected. To determine which processes work independently, we calculated the level of dissimilarity of single-drug effects over many cell lines. For this, we used 60,000
previously published drug dose–response curves obtained from the Sanger GDSC1000 and Novartis/Broad CCLE drug-encyclopedias (all sources, including hyperlinks, are summarized in
Supplementary Data 1). The area under the curve from these data, representative for the drug effect, was subsequently clustered using Ward or average hierarchical clustering (details are
provided in the Methods section). Drugs that have similar responses over many cell lines will end up in the same cluster while drugs that have dissimilar responses over many cell lines will
cluster relatively further away. To visualize these cluster-distance relations, the cluster tree was projected as a 2D Voronoi diagram which we call the drug atlas. This drug atlas provides
an intuitive overview of drug-effect relations over many cell lines. The atlas method was validated in parallel using world map coordinate relations (Supplementary Fig. 1a, see also
Supplementary Fig. 1b–d). To investigate how drug combinations with a synergistic effect relate to drug-effect similarities, we curated all published and peer reviewed synergy data matching
the cell line data that were used to create the drug atlas. This resulted in identification of 483 drug pairs that showed a synergistic effect in 156 cell lines (Supplementary Data 2,
references are given in the Supplementary References). These synergistic interactions are visualized onto the drug atlas by drawing a line between the respective drugs (Fig. 1b, a more
detailed view on drug targets22 is given in Supplementary Fig. 1e). An example from the list of curated data is shown in Fig. 1c. Consistent with our concept, most synergistic drug
interactions span a large distance on the atlas, showing in qualitative way that the corresponding drug pairs affect unrelated processes. DRUG DISTANCE, DRUG SENSITIVITY, AND TARGETED
THERAPY CORRELATE TO DRUG SYNERGY Based on our concept, we expect that inhibition of unrelated processes will result in synergistic effects since they represent independent survival
mechanisms. To quantify this, we calculated the level of dissimilarity of drug effects using the drug distance. For this, we selected the GDSC (MGH) data22, which showed the most consistent
clustering (unlike the combined MGH and GDSC1000 data, Supplementary Fig. 1f, see also Haibe-Kains et al.23). As independent benchmark data, we used the DREAM drug-synergy challenge data,
consisting of 11,173 synergy measurements24. Drug effects were already clustered to generate the drug atlas and were used to calculate the cophenetic distances between the clusters. The
larger the cophenetic distance, the more unrelated the drug effects and the higher the drug distance is. As a reference, the drug distance of the full spectrum of possible interactions
between all drugs was used as well as the distance within known pathways/gene ontologies25. In agreement with our concept, the average drug distance of drug pairs with synergistic effect
significantly exceeded the average overall drug distance Fig. 2a, _P_ = 4 × 10⁻⁴), confirming our initial hypothesis. Other distance models (average clustering) showed a similar outcome (see
Supplementary Fig. 2a). Similarly as we determined the drug distance, we could calculate the target distance since every drug has a defined target22. For this, we used the already clustered
drugs and then calculated the cluster distance based on the average of each target (since more drugs have the same target). This also showed that target distances of drug combinations with
a synergistic effect commonly exceeded the average target distance of all possible pairs for the GDSC data (Fig. 2b, _P_ = 4.5 × 10⁻¹⁵), which was confirmed for another clustering method
(Supplementary Fig. 2b) and for the DREAM data (Fig. 2c) as well. The identified distance–synergy relationship was independent of the within-pathway versus between-pathway distance25,
supporting the concept that distance, whether within or between known pathways, determines the chance of observing synergy. Consistently, given that most (80%) possible interactions occur
between processes, synergies are mostly found between processes (Fig. 2d; Supplementary Fig. 2c). Since we identified synergistic drug pairs for cell lines that are present in the GDSC data,
we were able to match drug-sensitivity data to the cell lines that showed synergy in that particular case. From our model, we expect a higher sensitivity in case synergy occurs. We
therefore tested whether the occurrence of synergy correlates to drug sensitivity. This analysis indeed showed that the cell lines that show synergy with particular drugs were significantly
more sensitive to these respective drugs than control cell lines from the matching tumor type (Fig. 2e, _P_overall = 1 × 10⁻⁴, Supplementary Fig. 2d, _P_ = 6 × 10⁻⁴). Similar results were
obtained by using the DREAM dataset (_P_ < 1 × 10⁻⁴, Fig. 2f). Since the cell lines used to build the drug atlas have been characterized on a genetic level by Novartis/Broad CCLE and
Sanger GDSC1000 which is matched to drug-sensitivity profiles (confirmed by others26,27; CCLE data is now fully available28), we could analyze the role of mutations in relation to drug
sensitivity upon presence of synergy, which showed that high sensitivity significantly corresponded to the presence of driver mutations, both by direct targeting of the protein, linking our
synergy model to driver mutations (Fig. 2e, f, indicated by ‘targeted’). Also, when cases of matched tumor drivers and their targeting drugs were excluded, a significantly increased
sensitivity was seen for synergistic drugs (Fig. 2e, f, indicated by ‘non-targeted’). For breast tumors, synergy with HER2-Neu/EGFR inhibitors correlated significantly with
HER2-Neu/EGFR-activating mutations (_P_ = 1 × 10⁻⁴, Fig. 3a). DRUG DISTANCE AND SENSITIVITY CAN PREDICT SYNERGY LINKED TO TUMOR-DRIVING MUTATIONS To independently provide evidence for our
hypothesis, we performed an independent drug-synergy screen in GBM cell lines. For this, drugs were chosen to have a high drug distance as well as a high sensitivity in GBM cell lines
(Supplementary Figs. 1d and 3a (showing sensitivity and distance, respectively)). We tested a total of 30 different combinations (Supplementary Data 1) onto 9 glioblastoma cell lines (which
are part of the GDSC dataset). Drugs were titrated up to an IC50 (Supplementary Fig. 3b, Supplementary Data 3a), and the synergy between drugs was determined by studying the combined drug
effect in a 6 × 6 matrix where each drug was titrated using a twofold dilution in each step (Fig. 3b). The viability was measured using CellTiter Glo 3D after 72 h of exposure to the drugs
as examined in triplicate experiments. Based on these viabilities, the combination index was calculated using the median effect principle by Chou and Tallalay29. A substantial number of
tested combinations showed synergy, i.e., up to 18 out of 30 pairs (60%) showed synergy over multiple cell lines and 116 out of 270 drug pairs (43%) showed synergy over all cell lines (i.e.,
having a combination index less than 0.8). Based on the curated synergy data, we could set a threshold that distinguishes synergistic drug pairs from randomly chosen drug pairs. Around 8%
of randomly picked drug combinations meet these synergy criteria, indicating that we have a strong enrichment over the background (Fig. 3c, _P_ < 1 × 10⁻⁵). The full list of determined
combination therapies is given in Supplementary Data 3b. Chou and Talalay Combination Index synergy significantly correlated (_P_ < 1 × 10⁻⁴) to other synergy/additivity metrics (Loewe,
BLISS or HSA method), see Supplementary Fig. 3c and Supplementary Data 3c, where each model interprets weak interactions differently (Supplementary Fig. 3d). Improvement of the
interpretation of synergy data could become more robust by taking more complex interactions into account according to Wicha et al.30). We generated a synergy predictor based on the (1) the
individual drug sensitivities, (2) their target information, and (3) the drug distance (see Methods and Code Availability). We analyzed whether the sensitivity and drug distance contributed
to the predicted power which was the case for both data sources (Fig. 3d). The predictive power of our model of this logistic correlation model was analyzed using receiver operator curve
(ROC) analysis, which showed an area under the curve (AUC) of 0.858 (Fig. 3e). The best-ranking drug combinations predicted by the model are provided in Supplementary Data 3d. When the model
was applied to the independent DREAM benchmark data, the AUC was 0.735 showing that our model can be applied to external data (Fig. 3e). Synergies were relatively more often observed in the
literature and predicted for breast cancer and less often observed and predicted for lung tumors (both _P_ < 1 × 10⁻⁵; Supplementary Fig. 3e). Together, these analyses show a clear
positive correlation between drug distance and the occurrence of synergy between the corresponding drugs. In addition, cell lines that show synergy are commonly relatively sensitive to these
drugs, especially in cases where tumor-driver mutations are targeted. We were able to generate a prediction model for the occurrence of synergy which showed a good performance, also when
applied to external DREAM data. We could validate our model in a drug-synergy screen showing a significant enrichment over the background. These data support our hypothesis and link our
concept to personalized features. THE DRUG ATLAS ENABLES IDENTIFICATION OF MULTI-DRUG SYNERGY IN VITRO Multi-drug (>2) combinations are difficult to identify given the enormous numbers of
possible combinations of more than two drugs. For example: for 600 FDA approved cancer drugs there are 54 × 106 possible combinations of three drugs per cell line/patient. We noticed that
multiple identified synergy pairs show connections on the drug atlas. In the cell lines U251, T98, and U87-MG, connected triangles can be observed where each pair of each axis has
individually shown synergy between the drugs Torin1, Erlotinib, and Docetaxel (Fig. 4a). Given that sensitivity and distance predicts synergy, we argued that dual synergies might predict
synergies of multidrug combinations. We therefore experimentally validated a potential synergistic effect of Torin1, Erlotinib, and Docetaxel (Fig. 4b, all data are shown in Supplementary
Data 4). We calculated the secondary synergy (see Methods), to make sure that each drug contributed to the synergy. We tested a panel of 21 cell lines for the putative synergy which resulted
in a strong synergistic effect overall with combination indexes up to 0.18 (strong synergy shown by strong red color, cell line H4 and T98) leading to a loss of viability below 10% of the
control (greyscale in Fig. 4b, lower panel of Supplementary Data 4). Glioma Sphere Cultures (GSC), i.e., primary cultures that faithfully resemble GBM tumors in their genetic and
transcriptomic make-up, showed similar effects. The effective potency of each drug was increased 8–16-fold in the combination, and in some cases up to 64-fold (T98, U251). These data show
that we have identified a synergistic multidrug combination where each drug enhances the effect of the other, leading to a strong synergy (average combination index of 0.46) with a severe
loss of viability (average 92% reduction). Since we argued that the effectiveness of dual synergy might be predictive for the effectiveness of multi-drug synergy, we therefore analyzed
whether the magnitude of dual-therapy synergies correlated to the occurrence of multi-drug synergy. For all dual treatments, we correlated the corresponding dual combination index to the
independently obtained multi-drug combination index. This clearly showed a significant correlation between dual synergies and the multi-drug synergy (Pearson correlation between 0.679 and
0.812, _P_ < 1.4 × 10⁻³, Fig. 4c). Therefore, our methodology might be used to identify more multi-drug therapies based on dual-therapy effects. Before we can apply the identified
multidrug combination to a mouse model, it might be useful to focus on clinically relevant drugs for GBM patients, also taking toxicity and blood brain barrier transfer into account. We
therefore chose to test a new panel of drugs that have overlapping targets with the previous set, but have better blood brain barrier crossing potential. We selected Osimertinib (Targrisso,
AZD9291; targets EGFR), AZD2014 (MTOR1/2) and Docetaxel (Microtubules, molecular structures are shown in Supplementary Fig. 4a) which, based on literature research, can reach concentrations
in the brain that match effective in vitro conditions. When applied to a panel of cell lines/ primary cultures that previously showed a response to the previous set of drugs, this led to
strong synergies in vitro as expected (Supplementary Fig. 4b). Together, by using our drug-atlas approach, we are able to identify a drug synergy between three drugs that would otherwise be
difficult to achieve. DRUG ATLAS IDENTIFIED COMBINATIONS SHOW SYNERGY IN VIVO We analyzed whether our prediction model to predict synergy can be validated in relevant orthotopic mouse
models. We selected the previously identified therapy of three drugs as well as the best-ranking drug combinations (see highlighted pairs in Supplementary Data 3d) for GBM, triple-negative
breast cancer, melanoma, and leukemia models, and tested whether their respective predicted drugs showed synergy in vivo. No obvious toxicity was observed in these experiments (except for
the triple combination, see below). The combination of three drugs (Osimertinib, AZD2014, and Docetaxel) was tested in an U87-MG-FM (Fluc-Mcherry) orthotopic glioblastoma model, which showed
a clear synergistic effect leading to 10–100 reduction of the tumor volume as measured from the luciferase levels (Fig. 5a, RLU average, combination index between 0.21 and 0.60) in vivo
around days 14–18. The treatment resulted in a significant better survival (_P_ = 0.04, Fig. 5f). All cross group significances are given in Supplementary Data 5. Some mice (_n_ = 3 out of
7) experienced constipation due to toxicity of docetaxel with/without the other drugs (Fig. 5a). Progression occurred after day 14, either because the drugs were administered too shortly or
because therapy resistance occurred. We subsequently applied a predicted combination in GBM consisting of a combination of two drugs: the PI3K/MTOR/microtubule inhibitor GNE-317 and
docetaxel. This drug combination came out of the logistic multiple regression model as a top-ranking combination. GNE-317 has been shown to pass the blood brain barrier31. When these drugs
were co-administered, a good synergy was observed (combination index between 0.56 and 0.80, Fig. 5b). The survival of the mice was significantly better (_P_ < 0.04, Fig. 5f). We also
applied a predicted combination in the triple-negative breast cancer cell model MDA-MD-231-FM. We choose the BRAF inhibitor AZD628 in combination with the nucleoside analog Gemcitabine as
top-ranking drug combination. After orthotopic transplantation and start of the treatment, a strong synergistic effect was seen (combination index between 0.08 and 0.11, Fig. 5c), resulting
in a significant better survival (_P_ < 1 × 10⁻⁴, Fig. 5f). We then tested a predicted combination for the Melanoma model CHL1-FM. For this, we used the CDK4 inhibitor GCP-082996 and the
nucleoside analog Gemcitabine, again the top-ranking drug combination. After orthotopic transplantation and treatment, a clear synergistic effect was seen (combination index between 0.62 and
0.68, Fig. 5d), resulting in a significant better survival (_P_ < 1 × 10⁻⁴, Fig. 5f). We finally tested a predicted combination for the Leukemia model BV-173-Gluc. Due to the metastatic
nature of these experiments, the cancer cells were tagged with soluble Gluc which can be measured in the blood of the mice. We used the BCR-ABL inhibitor Imatinib in combination with the
BCR-ABL inhibitor Dasatinib because this was the top-ranking drug combination. After orthotopic transplantation and treatment a synergistic effect was seen after 14 days (combination index
<0.25, Fig. 5e), resulting in a significant better survival (_P_ < 1 × 10⁻⁴, Fig. 5f). Synergy might, in this case, be driven by a combination of optimal on-target (BCR-ABL) and
off-target effects (Imatinib inhibits PDGFR and Dasatinib inhibits Src32,33) of these drugs resulting in complementing polypharmacology. One more model showed a significant survival effect
as well as synergy of the combination (Supplementary Fig. 5a, b, MDA-MD-231 triple-negative breast cancer model) and two models showed a weak survival advantage without showing significance
synergy (HT-29 colorectal cancer model and NCI-H460 non-small cell lung cancer model (see Supplementary Fig. 5c, d). Together, the outcome of these in vivo experiments confirm the validity
of our synergy prediction model in five independent mouse models and indicate that the prediction model has a translational value. DISCUSSION Selections of combinations of drugs that
optimally match personalized features are pivotal for an efficient therapy. Since the number of possible combinations of drugs is enormous, we have used a rational approach to identify
synergistic drugs rather than a high-throughput drug-screen and biomarker-based approaches that are common practice in the field12,17,24,34. In particular, a long sought approach to discover
multidrug (_n_ > 3) synergies has so far been lacking in the field given the practical difficulties in experimental setup and capacity needed. Our drug atlas approach enables to identify
these multidrug combinations which could increase therapy combination efficacy, reduce therapy resistance and could aid in designing optimal polypharmacological (i.e., multi-targeted)
therapies. We used single drug dose–response data to construct the drug atlas. Since this drug atlas is based on normalized drug sensitivities, it can be seen as a quantifiable model of the
relations between drugs. The validation of our hypothesis that unrelated processes might be important for occurrence of drug synergy came from curated synergistic interactions among 156
human cancer cell lines. These drugs were matched, when possible, to genetic mutations (i.e., oncogenic drivers). This showed that both drug distance and the drug sensitivity positively
correlate to the occurrence of synergy. Independent validation of our model by in vitro drug screening of GBM cell lines confirmed our predictions. In addition, testing our model on the
DREAM synergy benchmark dataset, additionally showed its value. Both closely related as well as unrelated processes have been considered accountable for drug synergies: they result from
intimate process connections (causing maximal target, pathway or feedback inhibition35,36,37,38,39) to less related parallel pathway connections that can cause synthetic lethal
interactions36,40,41,42. Gayvert et al.12 showed that synergistic combinations in mutant BRAF cell lines had a trend toward lower correlation of sensitivity over multiple cell lines, hence a
drug-distance effect. Our method, that is based on common exclusive effects of drugs, is relevant for processes that are commonly only weakly connected. When these processes are
simultaneously active in tumor cells, they offer a particular strong vulnerability given their independence. Thus, this provides a way to move from an already beneficial mutual exclusive
action13 to an even more beneficial synergistic mode of action. Our model therefore complements previous findings and concepts and provides a framework for understanding the relations of
survival mechanisms. Based on our distance model, we could generate a drug-synergy predictive model. As a proof of concept, we validated the synergistic effect of five drug combinations in
vivo for GBM, triple-negative breast cancer, melanoma, and CML models in mice. The identified combination of three drugs also resulted in a synergistic response in vivo, resulting in a
10–100-fold reduction in tumor size in vivo. The other models showed a similar performance including an additional triple negative breast cancer model. Together with a lung and colorectal
cancer model that did not show synergy, the success rate of synergy identification is six out of eight cases (75%, _P_ = 2.3 × 10⁻⁹ over an estimated 8% background synergy). A major obstacle
for implementing combination treatment in the clinic is the occurrence of synergistic toxicities. In many cases, these toxicities are a result of additive toxicities because targets are
shared between the combined drugs37,43,44,45. Although we noticed only minor toxicity during the in vivo experiments, the combination of three drugs led to toxicity, probably through
epithelial damage of the colon. To enable to proceed with this therapy, a scheduling strategy might important to reduce toxicity without compromising the efficacy. For both independent
action as well as for synergistic interactions of drug combinations, therapy resistance might occur. This could be due to various compensation and independence mechanisms that can occur on a
cellular level46. Drug independence and synergy do therefore not preclude therapy resistance but when optimally aligned, stronger and more lasting effects of drug combinations can be
expected. In conclusion, by using single-drug dose–response data we could predict combination therapies and have found that independent (parallel) vulnerabilities represent an important
class of drug combination targets. We have developed a method to identify these vulnerabilities which enabled us to predict multidrug combinations which could be validated in vivo with a
high success rate. The atlas concept provides an important insight in how to predict effective combination therapies. Our method is scalable and forms a resource for future translational
validation of our results. METHODS MOLECULAR FEATURES OF THE CELL LINES AND DRUG TARGETS Datasets used in this study are described in Supplementary Data 1 and refer to Sanger GDSC cancer
cell lines (as well as Novartis/Broad CCLE data). For expression analysis, data of the Cosmic consortium were used (Gene expression analysis of 789 cancer cell lines using the Affymetrix HT-
HG-U133A v2 platform, Source: EBI ID: E-MTAB-78322). GENERATION OF THE DRUG ATLAS Since drug dose–response datasets can be seen as collections of _n_-dimensional vectors, the similarity
between these nonzero vectors (has at least one nonzero component) can be determined by calculating the cosine alpha of the inner product space, or in other words, the angle the
drug-response vector for a specific drug has to all other drug-response vectors47,48. For all calculations, the relation between drug dose–response data over all cell lines was calculated as
the cophenetic distance49,50. The cophenetic distance of two objects in a cluster tree is the depth of the branches separating both objects, and is defined by the following formula (Eq.
(1)): $$c = \frac{{\mathop {\sum}\nolimits_{i < j} {\left( {x\left( {i,j} \right) - \bar x} \right)\left( {t\left( {i,j} \right) - \bar t} \right)} }}{{\sqrt {\left[ {\mathop
{\sum}\nolimits_{i < j} {\left( {x\left( {i,j} \right) - \bar x} \right)^2} } \right]\left[ {\mathop {\sum}\nolimits_{i < j} {\left( {t\left( {i,j} \right) - \bar t} \right)^2} }
\right]} }},$$ (1) where C is the cophenetic correlation coefficient, which can be calculated from _x_(_i_, _j_) = | X_i_ − X_j_ | , the ordinary Euclidean distance between the ith and _j_th
observations. _t_(_i_, _j_) is the dendrogrammatic distance between the model points Ti and Tj. This distance is the height of the node at which these two points are first joined together.
\(\bar x\) is the average of the _x_(_i_, _j_), and \(\bar t\) is the average of the _t_(_i_, _j_) The script is available at
https://stat.ethz.ch/R-manual/R-devel/library/stats/html/cophenetic.html. AUC values of the GDSC Encyclopedia (MGH data only22, see also “Quality control: dataset quality” below) were stored
in sorted data vectors as 1-AUC per cell line. The value of the AUC fluctuates between 0 and 1; zero reflecting the highest response. The distance of drug A with respect to drug B was
calculated as 1 minus the similarity between the AUC data vectors. Dose–response data were clustered using Ward.D2 or average clustering. Within-pathway distances were calculated by using
the ontology groups according My Cancer Genome, see Supplementary Data 1 for sources. Drugs with known cross reactivity over multiple pathways were excluded to calculate the within-pathway
distance. To generate the drug atlas Vonoroi map, AUCs of GDSC-MGH dose–response experiments were converted into cosine alpha vectors. This distance matrix of all against all drugs was
clustered using a hierarchical clustering algorithm with a Euclidean distance metric and pairwise average linkage resulting in a cluster tree separating the drugs based on their responses to
drugs in different cell lines. This binary cluster tree was subsequently drawn as a flattened map using an adapted version of the Weighted Fast Voronoi Layout (WFVL) algorithm24. In a
Voronoi diagram, a plane is divided in regions based on a set of sites on the plane. The borders between the regions are drawn where the distances between two sites are equal. This results
in set of polygons. In a weighted Voronoi diagram, the distance to a site is calculated according to the weight of a site. A centroidal Voronoi diagram shifts sites to get an even
distribution of sites over the plane by taking the aspect ratios of the polygon sides into account. By recursively applying a weighted centroidal Voronoi diagram to a cluster tree of data we
can map this data structure onto a plane (see also Supplementary Fig. 1a). Since this is a non-deterministic algorithm thresholds need to be set to finalize calculation. Furthermore, these
calculations are computationally intensive, so heuristics are needed to compute this in acceptable time. Most important heuristic in the WFVL is the use of a “power diagram”; a
transformation of the 2D plane to a 3D convex hull that enables fast calculation of the centroidals. Additional heuristics that were used were developed in house and are described in the
pseudocode below: * 1. Calculate branch grouping threshold based on percentage clusters formed at tree depth d → branch threshold b Apply heuristics * 2. Group if branch distance below
threshold b * 3. Identify early split of genes to be placed in corners based on similarity → grouped clustertree Tg * 4. Recursively layout branches: Apply weighted Fast Voronoi Layout (FVL)
per branch → approximate Voronoi map Va * 5. Smoothen Va map by re-applying FVL while maintaining relative positions → evenly distributed Voronoi Map V Thickness of borders between regions
reflects the cutoff in the cluster tree (the cophenetic distance); higher up results in a thicker border. QUALITY CONTROL: DATASET QUALITY Initially data of the combined pharmacogenomic
encyclopedias of the Genomics of Drug Sensitivity in Cancer (Sanger GDSC29) consortia were used to generate the drug atlas, but the resulting clustering pattern showed that the difference
between the WTSI and MGH drugs within this dataset, which had a more pronounced effect on the clustering than the actual dose–response data itself23,51,52. GDSC100027 also clustered
independently from the WTSI and MGH data, probably because the coverage was much higher since all cell lines versus drugs were measured. However, within this data, similar as for the
original GDSC (WTSI) data, there were stronger clustering differences observed than for the GDSC (MGH) data. Given this bias, we selected the GDSC (MGH) dataset which showed the most robust
clustering (see Supplementary Fig. 1f). LITERATURE SYNERGY DATA CURATION: IN SILICO IDENTIFICATION AND VISUALIZATION In order to obtain control data for our approach, we retrieved
drug-synergy data from the literature. A systematic literature search to identify all published synergy data for all Sanger GDSC (MGH) cancer cell lines was performed to gain insight into
the usability of our drug atlas. Using GDSC (MGH) cell lines as a reference, we used Boolean operators to generate a full list all known synergistic drug combinations for these cell lines.
For this, we used the following steps: 1. Pubmed was searched for <CCLE/GDSC cell line name> to check whether the cell line is annotated at all (wild cards <*> were used to
identify alternative spelling of the cell line names). 2. If positive, pubmed was searched for < CCLE/GDSC cell line name > + <synerg*> (the wild card * ensures that both synergy
and synergistic are found). 3. For each positive case, the PDF manuscript was checked whether the cell line(s) used was correct and which method was used to calculate drug–drug synergy. The
following methods were allowed (of which the first two cover 92% of the cases): * Combination Index Chou and Talalay * isobologram analysis * _t_ test (in histogram or table) * z-score>3
* Bliss or Loewe synergy * Variants of the upper methods Additive or antagonistic interactions were also recorded using the PubmedID. 4. In addition, Google scholar was searched for <
CCLE/GDSC cell line name > + <synergy > ” using wild cards as above. When more than ~100 hits were found, <methods to determine synergy (see point 3)> were added in the search
term, and the provided text was manually checked for correctness. Only peer reviewed papers annotated in Pubmed were considered. No ligand treatments were included. Papers mentioning
synergy, but referring to biochemical or biophysical interactions were excluded. References for all found synergies are given in the Supplementary Referenes. Synergistic drug combination
targets were annotated onto the atlas for each tumor type either as drug relation or target relation. Pairs of identified synergy pairs were visualized using Sankey diagrams
(http://sankeymatic.com/build/). SYNERGY PREDICTION MODEL BASED ON SENSITIVITY, DISTANCE, AND MUTATIONS The objective of the model is to predict drug synergy by using not only sensitivity
data of different cell lines to individual drugs but also the drug atlas distance. Predictions with and without using the drug atlas distance were performed as to demonstrate its added
value. For the data preparation, each row in the data corresponds to values for one cell line and a pair of drugs. As such, there is a lot of structure in the data, via the drug pairs. In
addition to the distance between the two drugs from the drug atlas, the data include individual drug-sensitivity value as well as target information relating to each drug of the pair, where
target information indicates whether or not the drug targets a gene known to be affected/mutated in the cell line at hand. Finally, it includes an indicator variable if the two drugs are
known to display synergy. Per drug pair and cell line, the objective function first proposed (Eq. (2)) $$C\left[ { - s\bar S + dD_{12} + t\mathop {\sum}\nolimits_{i = 1}^2 {T_i} } \right],$$
(2) where C is a binary variable indicating whether sensitivity information about the cell line is available for at least one drug _(C_ = 1_)_ or not _(C_ = 0_)_, _S_ is the average of the
sensitivities _S_1_,S_2 of the cell line for drugs 1 and 2, respectively, _D_12 is the distance between the two drugs in the pair, and _T_1,_T_2 represent the value of the targeted variable
for drugs 1 and 2, relative to the cell line. Specifically, _T__I_ is equal to 1 if the drug targets a gene known to be affected (e.g., mutated) in the cell line, and 0.01 otherwise. In the
above, _C,S_1_,S_2_,D_12_,T_1_,T_2 are given, while _s_, _d_, _t_ need to be estimated. We minimized this function for all cell lines relating to the same tissue. OPTIMIZATION OF THE MODEL
The objective being to predict whether or not two drugs display synergy, we analyzed the logistic regression model with the synergy indicator as response when the covariates consisting of
(1) the individual drug sensitivities, (2) their target information and (3) the drug distance, were taken along, per cell line. Note that rows where drug-synergy information is left as 0 may
be unknown or no synergy. We know that the synergy variable _θ__ij_ depends on the distance _d__ij_ between the drug pair _(i,j)_ on the drug atlas, and on the target information _t__ijk_,
which indicates if at least one of the drugs targets a gene mutated in the cell line _k_. We could write the synergy between the two drugs indexed by _i,j_ as (Eq. (3)): $$\theta _{ijk} =
\frac{{t_{ijk}e^{d_{ij}}}}{{1 + t_{ijk}e^{d_{ij}}}},$$ (3) which yields a positive correlation between the synergy _θ__IJK_ and the drug atlas distance _d__IJ_ and that, if none of the drugs
_i,j_ targets a mutation of cell line k, the synergy is close to zero. We can compute _θ__IJK_ per pair (_i,j_) for all available cell lines, then average them out. This simplistic approach
does not involve a logistic regression. Alternatively, we can fit per tissue a logistic model (Eq. (4)): $${\mathrm{logit}}( {\theta _{ij}} ) = \alpha + \beta t_{ijk} + \delta d_{ij} +
e_{ijk},$$ (4) where now _θ__IJ_ indicates synergy between drugs _i_ and _j_ irrespective of the cell line, _e__IJK_ represents a normally distributed error with mean 0 and variance _σ__2_,
and _i_ ≠ _j_. The above does not involve the individual drug sensitivities. These could be included simply as covariates, as in (Eq. (5)): $${\mathrm{logit}}( {\theta _{ij}} ) = \alpha +
\beta t_{ijk} + \delta d_{ij} + \gamma _{ik}S_{ik} + \gamma _{jk}S_{jk} + e_{ijk}.$$ (5) Note that the above do not make use of any model for the combined sensitivity, which is not observed
in this case. APPLICATION The idea is to fit the model to the cell lines for which synergy is known. Note that there is no information if no synergy is also known. We will only use the cell
lines for which sensitivity is available for both drugs. At this point, the other ones are not informative. LOGISTIC REGRESSION The data contain an indicator variable Label that is 1 for
cases where the two drugs display synergy, and 0 otherwise. Per tissue, we fit a logistic regression using all rows for which Label is 1, and then choosing at random the same number of cell
lines (observations) for that tissue for which Label is 0. TESTING COVARIATES: DRUG TARGETS We compared four model fits. Model IA relates only the target information (at least one drug
targets the cell line modification) is (Eq. (6)): $${\mathrm{logit}}( {\theta _{ij}} ) = \alpha + \beta t_{ijk} + e_{ijk}.$$ (6) TESTING COVARIATES DRUG TARGETS AND DISTANCE Model IB relates
both target information and the drug atlas distance (Eq. (7)): $${\mathrm{logit}}( {\theta _{ij}} ) = \alpha + \beta t_{ijk} + \delta d_{ij} + e_{ijk}.$$ (7) This model can be used to
assess the added value of the distance by comparing its results to those using model IA. TESTING COVARIATES DRUG TARGETS AND SENSITIVITY The second pair of models involves the target
information, as well as the individual sensitivities of the cell line to the drugs. Model IIA is (Eq. (8)): $${\mathrm{logit}}( {\theta _{ij}} ) = \alpha + \beta t_{ijk} + \gamma _{ik}S_{ik}
+ \gamma _{jk}S_{jk} + e_{ijk}.$$ (8) TESTING COVARIATES DRUG TARGETS, SENSITIVITY, AND DISTANCE Finally, model IIB is the same as model IIA, but also includes the drug atlas distance (Eq.
(9)): $${\mathrm{logit}}( {\theta _{ij}} ) = \alpha + \beta t_{ijk} + \delta d_{ij} + \gamma _{ik}S_{ik} + \gamma _{jk}S_{jk} + e_{ijk}.$$ (9) This model can be used to assess the added
value of the distance by comparing its results to those using model IIA. CORRELATIONS BETWEEN DRUG SENSITIVITY AND SYNERGY To correlate the occurrence of synergy with the drug sensitivity,
we normalized the drug sensitivity per drug per tissue type to correct for the tissue specific dynamic range. For this, sensitivity per tissue type per drug was shifted to the normalized
average value, which was set to 1 (average 2log IC50 concentration per tissue per drug). All sensitivities shown are the delta 2log IC50 compared to the normalized value. GBM CELL LINES AND
PRIMARY CULTURES The glioblastoma cell lines used for this study are listed in Supplementary Data 1. Cell lines were cultured in Dulbecco’s Modified Eagle’s Medium (Gibco™, Life
Technologies) supplemented with penicillin/streptomycin (Gibco™, Life Technologies) and 10% fetal bovine serum (Gibco™, Life Technologies) and maintained at 37 °C with 5% CO2 in a humidified
environment. Cells were grown strictly in the log phase between and during experiments. Glioma Sphere Cultures (GSCs) were obtained from single patient surgical specimens at MD Anderson
(procedure is described in Bhat et al.53) or at the Vrije Universiteit medical center (VUmc) Amsterdam. At the VUMC, tumors were washed twice with phosphate-buffered saline (PBS) in a Petri
dish. The tumor was cut into small pieces and treated with Accutase, containing 5% sterile filtered EDTA (0.5 M, [pH 8]) and 4.5% DNAse I (10 mg/ml diluted in Hanks’ balanced salt solution
(HBSS), Roche Life Science). The tumor material was incubated for 30 min at 37 °C, and dissociated every 10 min by pipetting up and down. Next, the tumor material was passed through a 100-μm
cell strainer to obtain a near-single-cell suspension. The suspension was centrifuged for 5 min at 1000 rpm, and supernatant was discarded. To lyse erythrocytes, 1 ml of E-lysis buffer was
added and incubated for 5 min at 37 °C, followed by centrifugation for 5 min at 1000 rpm to remove the supernatant. Glioma Sphere Culture (GSC) cell lines were grown in Neurobasal-A Medium
(NBM; supplemented with 1× N-2 supplement, 1× B-27 supplement, 0.1% heparin, 20 ng/ml EGF, and 20 ng/ml bFGF (Peprotech) and primocin (Gibco). The medium was refreshed at least once a week
including 20–50% old medium, depending on the growth rate of the GSCs. Spheroids were dissociated with Accutase (PBS containing 0.5 mM EDTA·4Na and 3 mg/L Phenol Red, Sigma-Aldrich) and kept
up to a maximal size to prevent occurrence of a necrotic core. Spheres were centrifuged for 5 min at 200×_g_, and the supernatant was discarded. Spheroids were resuspended in Accutase and
incubated for 3–5 min at 37 °C, again centrifuged for 5 min at 200×_g_ and afterwards plated in a flask. DRUG SCREENS Drug screens were performed using the following drugs of which the drug
itself or its target was previously shown to be active against glioblastoma: Gemcitabine54 (Selleckchem), Rapamycin55 (Sigma-Aldrich), Docetaxel56 (Selleckchem), Erlotinib57 (Selleckchem),
JNK inhibitor VIII58 (EMD Millipore), Akt inhibitor VIII59,60 (Sigma-Aldrich), Crizotinib61 (LC laboratories), Torin162 (LC laboratories), Pac-163 (Sigma-Aldrich), Embelin59 (Sigma-Aldrich),
AZD648258 (Tocris Bioscience), AS60124564 (EMD Millipore). Drugs were dissolved in DMSO. SCREEN OPTIMIZATION Plating density of cell lines was determined to obtain ~90% confluency after 96
h. Cells were counted with Coulter Counter (Beckman Coulter), and cells were seeded in hexplo in 96-wells plate with a density of 5000, 4000, 3000, 2000, or 1000 cells per well in 200 μl
DMEM complete medium (+10% FBS and 1% P/S). Cell viability was determined 96 h post seeding using CellTiter-Glo® 3D (Promega) viability assay (which uses ATP quantification as a readout for
metabolically active cells). In total, 150 μl medium was removed from the wells, where after 50 μl CellTiter-Glo® 3D was added. Luminescence was captured at OD1, 400-ms integration time from
Greiner 96 Flat Bottom White Polystyrene (GRE96fw_chimney) plates. After 20–30 min of incubation, the total lysates were transferred to white polystyrene 96-wells plates (Greiner), and
relative light units were determined by Infinite® 200 Microplate Reader with a CONNECT plate stacker system (Tecan). Cell viability for these optimizations was confirmed by the amount of
attached growing cells and by Crystal Violet staining. Cells were seeded as described previously and 96 h post seeding all medium was removed by pipetting. The cells were fixated with 100 μl
3.7% formaldehyde in PBS for 20 min and stained with 100 μl Crystal Violet solution (0.1% Crystal Violet, dissolved in 25% Methanol) for 30 min. Subsequently, the Crystal Violet was
discarded, and the plates were rinsed with demi water and tapped onto a dry tissue, until no dye appeared on the tissue. Plates were air dried at room temperature for at least 4 h. Crystal
Violet staining was dissolved in 100 μl of 1% SDS in demi water, and after 5 min at shaking plate the OD was determined in Tecan reader at 540 nm. Experiments were performed in triplicate,
and were independently confirmed in replicate experiments. Toxicity of the chosen drug pairs was taken into account by using normal human astrocytes, fibroblasts, and neural stem cells. For
plating of glioma organoid/sphere cultures, organoid/spheroids were dissociated into single cells using Accutase as described above. Cell counting was performed by using a coulter counter
(Beckman, US). Per cell line, two rows (per row six wells) of respectively 5.000 and 2.500 single cells diluted in 100 μl NBM were plated in non-coated round-bottom 96-well plates, in
triplicate. Formation of multicellular organoids took 4 days; consequently day four was indicated as “Day 0”. For optimizations, every 2 days, growth was measured by determining the spheroid
volume (mm3) and by measuring the viability using CellTiter-Glo® 3D as above. Cells were incubated for 30 min with CellTiter-Glo® 3D, and subsequently luminescence was measured.
Measurements were averaged, and ratios were calculated by day X/day 0. Viability was measured on days 0, 2, and 4. To determine drug toxicity for primary cultures from the VU Medical Center,
organoid cultures were generated using non-coated round-bottom 96-well plates in a 6 × 9 matrix. One row was used as control, whereas the other eight rows were used for drug titration in
triplo (8 × 3). Per well, 3000 single cells in 100 μl NBM were plated. After organoid formation, drugs were added. Drugs were diluted 1:2 in NBM per row. Three days after addition of drugs
cell viability was determined using CellTiter-Glo® 3D, using the same procedure as described above. For analysis, the average cell viability of the controls and the different drug
concentrations was determined. Next, the cell viability in percentages was calculated (average cell viability drug concentration X/average cell viability control*100). IC50 concentrations
were determined using GraphPad software, plotting nonlinear regression curves and defining the absolute IC50 concentration or area under the curve (AUC) surface. IC50/AUC DETERMINATIONS
Inhibitory concentrations leading to 50% viability (IC50) were determined before synergy testing was performed. Optimal seeding densities and drug concentrations were determined by titration
in 100 µl DMEM complete medium according to a 6 × 8 format. Twenty-four hours after seeding, 100 µl of the diluted drug was added. Drugs were titrated from a high concentration down in a
nine step, threefold dilution series (up to 20,000-fold dilution). IC50 (and area under the curve [AUC]) concentrations were determined using Graphpad Prism software. DRUG–DRUG-SYNERGY
DETERMINATION Titrations to determine drug synergy were done by plating cells in optimal densities in a 6 × 7 format in 96-wells plate in 100 µl DMEM complete medium. After 24 h, cells
received treatments of 50 µl of drug 1 and 50 µl of drug 2, which were serial diluted twofold diluted in each step, resulting in a non-treated control and an additional five concentrations
for each drug, together forming a matrix of 36 different concentration ratios for both drugs. For drug-synergy determination, drugs were titrated in a window where the IC50 concentration was
chosen as the highest concentration to prevent stochastic (low cell density) and off-target artifacts. Absolute IC50s were used, except in the case of Rapamycin where the relative IC50 was
used (absolute IC50 was never reached). For AZD6482 and JNK inhibitor VIII, it was in some cases not possible to determine the IC50. The negative control, that received no drug, was
replicated in sixfold to obtain a more balanced design of untreated versus treated wells. Assays were performed at least in triplicate in 96-wells plates (Nunc) for classical GBM cell lines
or in low-adhesion plates when primary cultures were used. Three days after, drug treatment cell viability was measured using CellTiter-Glo®. Per 96-wells plate the average cell viability of
each drug condition in percentages was calculated using DMSO-treated cells as controls. After data normalization, synergy calculations were performed (example shown in Fig. 2i). MULTI-DRUG
COMBINATIONS Drugs used for the multi-drug experiment were Erlotinib, Torin1, and Docetaxel. Cells were plated as described for dual-drug combinations and 24 h post seeding 50 µl of drug 1
and 2 were added in a five times twofold dilution series in two directions. In total, 18 × 96-wells plates were necessary for one multi-drug experiment: 50 µl of third drug was added per set
of three plates in one concentration over the whole 6 × 7 format. In total, five concentrations of third drug were added, and DMSO-treated cells served as control. For primary cultures,
four round-bottom 96-well plates were used, 3.000 cells per well were plated in a 6 × 9 matrix. After 4 days, drugs were added to the organoids/spheroids. Per drug, three different
concentrations were used (diluted 1:4 for, respectively, Erlotinib and Torin1, 1:2 for Docetaxel). After 72 h of treatment, 200 µl medium was removed from the wells, after which 50 µl
CellTiter-Glo® 3D was added. Read-out methods and data calculations were performed as described above. SYNERGY CALCULATION Synergy was determined using the median effect principle by Chou
and Tallalay29. The combination index of an amount of n drugs was be calculated by using an n-dimensional adapted formula, Eq. (10)). $${\mathrm{CI}}_{\left( {n\;{\mathrm{drugs}}} \right)} =
\frac{{\mathop {\sum}\nolimits_{k = 0}^n {\left( {\frac{1}{{V_n}}} \right) - \left( {\frac{{n - 1}}{{100}}} \right)} }}{{\left( {\frac{1}{{V_{1..n}}}} \right)}},$$ (10) where _Vn_ is the
normalized measured viability (in %) of each drug separately for _n_ drugs_. V1..n_ is the actually measured viability (in %) of the combination of 1.._n_ drugs. A combination index lower
than 0.8 is indicated as drug synergy, a combination index of 1 is indicated as additive and a value higher than 1 is indicated as drug antagonism. For each cell line, the combination index
(measured synergistic effect, % cell viability) was determined and subsequently the theoretical additive effect (% cell viability)—the effect of the drug combination when the drugs in theory
would not have worked synergistically—was calculated to compare the measured synergistic effect with the theoretical additive effect. Loewe65, Bliss66, and HSA (highest single agent)
calculations of synergy were performed using Combenefit67, software is available at the following website: https://sourceforge.net/projects/combenefit/). Thresholds for synergy were
determined by linear interpolation using the combination index of 0.8 resulting in the threshold for Loewe synergy at 7.8 and for Bliss additivity at 2.5. MULTI-DRUG EXPERIMENTS For _n_ = 3
drugs, synergy can be expressed either as the sum of all three drugs (primary CI) as well as the effect of the n (third) drug on top of n-1 (two) other drug combination; i.e., [DA+ DB] +
[DC], [DB + DC] + [DA], and [DA+ DC] + [DB] (secondary CI)68. The primary CI was used for all double-synergy experiments and the in vivo experiments. The secondary CI was used for all in
vitro multi-drug experiments. To calculate the secondary combination index, the combined effect of the first two drugs is taken as a single-drug effect and the synergistic effect of the
third drug is calculated on top of this combination (Eq. (11)). (11) INTERASSAY REPRODUCIBILITY For some synergy determinations, inter-experimental reproducibility in the dose responses was
observed. To solve this, the cultures were strictly cultured under log-expanding conditions between and during experiments. Experiments were repeated which resulted in proper window where
the maximal dose led to a 50% viability readout. STATISTICS All Statistical analyses were performed using Graphpad Prism 5 software, except distance models (performed in R). The survival
distributions were estimated using Kaplan–Meier methodology using the log-rank test. To enable to calculate the correlations between multiple drug sensitivities and the combination index,
the relative sensitivity for each drug was normalized over all tested cell lines (_n_ = 20) and expressed as 0 (most sensitive) to 1 (least sensitive). This enabled to calculate the average
sensitivity for two drugs for each cell line and to correlate these values to the CIs. ETHICAL APPROVAL AND MOUSE HOUSING Studies were performed in accordance with the European Community
Council Directive (2010/63/EU) for laboratory animal care and the Dutch Law on animal experimentation and when performed in a facility at Massachusetts General Hospital accredited by the
Association for the Assessment and Accreditation of Laboratory Animal Care (AAALAC). Studies were approved by the Animal Welfare Body (IVD) of the VU and VUMC (in Amsterdam) and
Institutional Animal Care and Use Committee (IACUC) in Boston. All experiments meet ARRIVE guidelines69. Four to 6-week-old female Athymic Nude-Foxn1nu mice were purchased from
Harlan/Envigo, and used after 1 week of acclimatization. All animals were housed in one cage and kept under filter top conditions, receiving ab libitum water and food. IN VIVO EFFICACY
TESTING For the GBM model, U87-MG cells were orthotopically injected into 8-week-old female Athymic Nude-Foxn1nu mice. Mice were anesthetized using isoflurane. The analgesic Temgesic was
used at 0.1 mg/kg. In all, 0.3 mg/ml stock (Reckit Benckiser) was diluted 15×, and 50 µl was used per 10 g s.c. In addition, paracetamol (Bayer 120 mg/5 ml) was added 8× diluted to drinking
water 1 day before the procedure. Lidocaine (VUMC Apotheek 13G15-001A, 1000 mg per 50 ml) was added to the skin surface. FM (Fluc-mCherry) tagged U87-GBM cells (_n_ = 400,000) were injected
using 5 µl PBS. Cells were injected using a stereotact injection device and injected in the striatum (0 = bregma) lr −2, tn 0.5, tb −3 mm. Injection speed was 2 µl per minute, followed by a
2 min lag time. One week after tumor engraftment, mice were treated as described under the sub-acute In vivo toxicity testing section. Luciferase activity was measured twice a week as
described before70. In case the mice had to be taken out of the experiment due to tumor growth and/or weight loss, the last observation carried forward method was used to compensate for the
loss of information in each group (defined at randomization). Progressive disease is defined as the last time point before disease progression (i.e., weight loss). For the GBM models, mice
were divided into four groups and treated with: vehicle (1% DMSO), Docetaxel (71; 5 mg/kg) and GNE-317 (40 mg/kg), and Docetaxel in combination with GNE-317. Drugs were administered
intraperitoneally 4 days per week for 3 weeks. In the multidrug experiment, the same conditions were used and for Osimertinib72, 12.5 mg/kg was given orally for two weeks together with
AZD201473 at 9 mg/kg, given intraperitoneally. Docetaxel (5 mg/kg) was given intraperitoneally every other day, i.e., at days 1, 3, and 5 of each of the 2 weeks. Drugs were given
individually or in combination. For the triple-negative breast cancer model, MDA-MB 231 cells (5 × 10⁶) were injected into the fat pad of 8-week-old female athymic mice. Briefly, animals
were restrained at upright position, and the needle was gently insert into the 4th mammary fat pad proximal to the nipple, bevel up, and 2–4 mm under the skin. When tumors were palpable,
mice were divided into four groups, and treated with: vehicle (1% DMSO), AZ628 10 mg/kg, Gemcitabine 50 mg/kg, and AZ628 in combination with Gemcitabine. Drugs were administered
intraperitoneally 4 days per week for 3 weeks. For the melanoma model, CHL-1 (5 × 10⁶) cells were injected intradermally into the rear flanks of 8-week-old female athymic mice in 50 μl of
PBS mixed with 50 μl Matrigel (Corning, NY). When tumors were palpable, mice were divided into four groups and treated with: vehicle (1% DMSO), CGP-082996 10 mg/kg, Gemcitabine 25 mg/kg, and
CGP-082996 in combination with Gemcitabine. Drugs were administered intraperitoneally 4 days per week for 3 weeks. Bioluminescence imaging was performed using the Xenogen IVIS 200 Imaging
System (PerkinElmer, Waltham, MA). The system is composed of an imaging chamber, gas anesthesia system which is connected to an oxygen cylinder and isoflurane tank, and a highly sensitive
cryogenically cooled charge-coupled device camera. Fresh luciferin solution is prepared by dissolving D-luciferin powder (Gold Biotech, St. Louis, MO) in PBS at 25 mg/mL. Mice were injected
intraperitoneally with 150 mg/kg body weight of luciferin and transferred into the image chamber. Imaging was acquired 10 min post-luciferin injection, and the image intensity was
quantitated using the Living Image software 4.3.1 from PerkinElmer. Measurements of tumor size were also taken every 3 days using digital calipers, and tumor volume was determined by the
following formula: volume = (length × width × height) × 0.52. For Leukemia model, 8-week-old nude mice were sub-lethally irradiated with 120 cGy 24 h before the intravenous (i.v.) injection
of 3 × 10⁶ BV-173 through the tail vein. Mice were treated with: vehicle (1% DMSO), Imatinib 2 mg/kg, Dasatinib 2 mg/kg, and Imatinib in combination with Dasatinib. Drugs were administered
intravenously 4 days per week for 3 weeks. At indicated time points, 5 µL of blood was withdrawn using a pipette Imaginib tip from a small incision at the tail tip of conscious mice and
immediately mixed with 1 μl of 20 mM EDTA. Gluc activity was then measured using a plate luminometer (BioTek instruments, Vinouski, VT) after injecting 100 µL of 100 µM coelenterazine and
acquiring signal over 10 s. HISTOPATHOLOGICAL, HEMATOLOGICAL, AND LIVER TOXICITY ANALYSIS After completion of the in vivo experiment (day 10), the brain, colon, and livers were fixed in 4%
formaldehyde/PBS for 24 h, dehydrated with alcohol, embedded in paraffin, and tissues were then sliced into 4-μm-thick sections. Hematoxylin–eosin (H&E) staining of the sections and
histopathological analyses were performed by Prof. Pieter Wesseling (department of Pathology, VUMC). Blood samples were collected in nonheparinized EDTA-coated Eppendorf tubes, and complete
blood counts were determined with a COULTER® Ac·T diff™ Analyzer (Beckman Coulter, Miami, FL, USA). Furthermore, blood smears were prepared and stained using a May-Grünwald-Giesma protocol.
Staining and the differential blood count (% of each type of white blood cell) were performed by the VUMC, department of hematology. The hematological parameters assessed were: hemoglobin
concentration (HB), red blood cells (RBC), white blood cells WBC, and differential leukocytes (neutrophils, lymphocytes, and monocytes). In case of suspected relavance, liver toxicity was
determined by measuring the liver enzymes Alanine aminotransferase (ALAT) and Aspartate Aminotransferase (ASAT) in plasma using an IFCC assay on the COBAS 8000 (Department of Clinical
Chemistry, VU Medical Center). Vendor reference values were obtained from Envigo. After the animals were sacrificed, organ damages were analyzed. In the present studies, mice tolerated the
treatment with no significant toxicity, except for the therapy of three drugs. We did not observe significant difference among the control and treatment groups at the evaluated dose/time
point. REPORTING SUMMARY Further information on research design is available in the Nature Research Reporting Summary linked to this article. DATA AVAILABILITY All public sources used for
the project are provided in Supplementary Data 1. All other relevant data that support the results of this study are available from the corresponding author upon reasonable request. CODE
AVAILABILITY Scripts are available through Github (https://github.com/bartwesterman/drug-atlas) together with a demo that runs the code/software in example data (NatComm model.csv) and
typical run time. The script to create the Vonoroi diagrams is available upon reasonable request. REFERENCES * Johannessen, C. M. et al. COT drives resistance to RAF inhibition through MAP
kinase pathway reactivation. _Nature_ 468, 968–972 (2010). Article ADS CAS PubMed PubMed Central Google Scholar * Emery, C. M. et al. MEK1 mutations confer resistance to MEK and B-RAF
inhibition. _Proc. Natl Acad. Sci. USA_ 106, 20411–20416 (2009). Article ADS CAS PubMed PubMed Central Google Scholar * Sequist, Lv. et al. Genotypic and histological evolution of lung
cancers acquiring resistance to EGFR inhibitors. _Sci. Transl. Med._ 3, 75ra26–75ra26 (2011). Article PubMed PubMed Central Google Scholar * Hatzivassiliou, G. et al. ERK inhibition
overcomes acquired resistance to MEK inhibitors. _Mol. Cancer Ther._ 11, 1143–1154 (2012). Article CAS PubMed Google Scholar * Nazarian, R. et al. Melanomas acquire resistance to
B-RAF(V600E) inhibition by RTK or N-RAS upregulation. _Nature_ 468, 973–977 (2010). Article ADS CAS PubMed PubMed Central Google Scholar * Poulikakos, P. I. et al. RAF inhibitor
resistance is mediated by dimerization of aberrantly spliced BRAF(V600E). _Nature_ 480, 387–390 (2011). Article ADS CAS PubMed PubMed Central Google Scholar * Virzì, A. R., Gentile,
A., Benvenuti, S. & Comoglio, P. M. Reviving oncogenic addiction to MET bypassed by BRAF (G469A) mutation. _Proc. Natl Acad. Sci. USA_ 115, 10058–10063 (2018). Article PubMed CAS
PubMed Central Google Scholar * Miller, C. A., Settle, S. H., Sulman, E. P., Aldape, K. D. & Milosavljevic, A. Discovering functional modules by identifying recurrent and mutually
exclusive mutational patterns in tumors. _BMC Medical Genomics_ 4, 34 (2011). Article PubMed PubMed Central Google Scholar * Ciriello, G., Cerami, E., Sander, C. & Schultz, N. Mutual
exclusivity analysis identifies oncogenic network modules. _Genome Res._ 22, 398–406 (2012). Article CAS PubMed PubMed Central Google Scholar * Zhang, J., Zhang, S., Wang, Y. &
Zhang, X.-S. Identification of mutated core cancer modules by integrating somatic mutation, copy number variation, and gene expression data. _BMC Syst. Biol._ 7 SUPPL 2, S4–S4 (2013).
Article PubMed Google Scholar * Sawyers, C. L. Perspective: combined forces. _Nature_ 498, S7–S7 (2013). Article ADS CAS PubMed Google Scholar * Gayvert, K. M. et al. A computational
approach for identifying synergistic drug combinations. _PLoS Comput. Biol._ 13, e1005308–e1005308 (2017). Article PubMed PubMed Central CAS Google Scholar * Palmer, A. C. &
Sorger, P. K. Combination cancer therapy can confer benefit via patient-to-patient variability without drug additivity or synergy. _Cell_ 171, 1678–1691.e13 (2017). Article CAS PubMed
PubMed Central Google Scholar * Bulusu, K. C. et al. Modelling of compound combination effects and applications to efficacy and toxicity: state-of-the-art, challenges and perspectives.
_Drug Discov. Today_ 21, 225–238 (2016). Article CAS PubMed Google Scholar * Lopez, J. S. & Banerji, U. Combine and conquer: challenges for targeted therapy combinations in early
phase trials. _Nat. Rev. Clin. Oncol._ 14, 57–66 (2017). Article CAS PubMed Google Scholar * Lazo, J. S. Cutting down the time to identify challenging tumor therapeutic targets and drug
combinations using synthetic lethal approaches. _F1000Research_ 7, 308 (2018). Article PubMed PubMed Central Google Scholar * Bansal, M. et al. A community computational challenge to
predict the activity of pairs of compounds. _Nat. Biotechnol._ 32, 1213–1222 (2014). Article CAS PubMed PubMed Central Google Scholar * Menden, M. P. et al. Community assessment to
advance computational prediction of cancer drug combinations in a pharmacogenomic screen. _Nat. Commun._ 10, 1–17 (2019). * Anders, C. K. & Carey, L. A. Biology, metastatic patterns, and
treatment of patients with triple-negative breast cancer. _Clin. Breast Cancer_ 9 SUPPL 2, S73–S81 (2009). Article PubMed CAS Google Scholar * Long, Gv. et al. Adjuvant dabrafenib plus
trametinib in stage IIIBRAF-mutated melanoma. _N. England J. Med._ 377, 1813–1823 (2017). Article CAS Google Scholar * Druker, B. J. et al. Five-year follow-up of patients receiving
imatinib for chronic myeloid leukemia. _N. England J. Med._ 355, 2408–2417 (2006). Article CAS Google Scholar * Garnett, M. J. et al. Systematic identification of genomic markers of drug
sensitivity in cancer cells. _Nature_ 483, 570–575 (2012). Article ADS CAS PubMed PubMed Central Google Scholar * Haibe-Kains, B. et al. Inconsistency in large pharmacogenomic studies.
_Nature_ 504, 389–393 (2013). Article ADS CAS PubMed PubMed Central Google Scholar * Menden, M. P. et al. A cancer pharmacogenomic screen powering crowd-sourced advancement of drug
combination prediction. https://doi.org/10.1101/200451 (2017). * Levy, M. & Lovly, C. My Cancer Genome, www.mycancergenome.org (Vanderbilt University, 2019). * Pingle, S. C. et al. In
silico modeling predicts drug sensitivity of patient-derived cancer cells. _J. Transl. Med._ 12, 128 (2014). Article PubMed PubMed Central CAS Google Scholar * Iorio, F. et al. A
Landscape of Pharmacogenomic Interactions in cancer. _Cell_ 166, 740–754 (2016). Article CAS PubMed PubMed Central Google Scholar * Ghandi, M. et al. Next-generation characterization of
the Cancer Cell Line Encyclopedia. _Nature_ 569, 503–508 (2019). Article ADS CAS PubMed PubMed Central Google Scholar * Chou, T. C. & Talaly, P. A simple generalized equation for
the analysis of multiple inhibitions of Michaelis-Menten kinetic systems. _J. Biol. Chem._ 252, 6438–6442 (1977). CAS PubMed Google Scholar * Wicha, S. G., Chen, C., Clewe, O. &
Simonsson, U. S. H. A general pharmacodynamic interaction model identifies perpetrators and victims in drug interactions. _Nat. Commun._ 8, 2129 (2017). Article ADS PubMed PubMed Central
CAS Google Scholar * Salphati, L. et al. Targeting the PI3K pathway in the brain—efficacy of a PI3K inhibitor optimized to cross the blood-brain barrier. _Clin. Cancer Res._ 18,
6239–6248 (2012). Article CAS PubMed Google Scholar * Cheah, C. Y. et al. Patients with myeloid malignancies bearing PDGFRB fusion genes achieve durable long-term remissions with
imatinib. _Blood_ 123, 3574–3577 (2014). Article CAS PubMed PubMed Central Google Scholar * Araujo, J. & Logothetis, C. Dasatinib: a potent SRC inhibitor in clinical development for
the treatment of solid tumors. _Cancer Treat. Rev._ 36, 492–500 (2010). Article CAS PubMed PubMed Central Google Scholar * Sun, Y. et al. Combining genomic and network characteristics
for extended capability in predicting synergistic drugs for cancer. _Nat. Commun._ 6, 8481 (2015). Article ADS CAS PubMed Google Scholar * Dancey, J. E. & Chen, H. X. Strategies for
optimizing combinations of molecularly targeted anticancer agents. _Nat. Rev. Drug Discov._ 5, 649–659 (2006). Article CAS PubMed Google Scholar * Lehár, J. et al. Chemical combination
effects predict connectivity in biological systems. _Mol. Syst. Biol._ 3, 1–14 (2007). Article CAS Google Scholar * Flaherty, K. T. et al. Combined BRAF and MEK inhibition in melanoma
with BRAF V600 mutations. _N. England J. Med._ 367, 1694–1703 (2012). Article CAS Google Scholar * Dickson, M. A. et al. Phase I study of XL281 (BMS-908662), a potent oral RAF kinase
inhibitor, in patients with advanced solid tumors. _Investig. New Drugs_ 33, 349–356 (2014). Article CAS Google Scholar * Ricordel, C., Friboulet, L., Facchinetti, F. & Soria, J.-C.
Molecular mechanisms of acquired resistance to third-generation EGFR-TKIs in EGFR T790M-mutant lung cancer. _Ann. Oncol._ 29, i28–i37 (2018). Article CAS PubMed Google Scholar * Srivas,
R. et al. A network of conserved synthetic lethal interactions for exploration of precision cancer therapy. _Mol. Cell_ 63, 514–525 (2016). Article CAS PubMed PubMed Central Google
Scholar * Thompson, J. M., Nguyen, Q. H., Singh, M. & Razorenova, Ov. Approaches to identifying synthetic lethal interactions in cancer. _Yale J. Biol. Med._ 88, 145–155 (2015). CAS
PubMed PubMed Central Google Scholar * Shen, J. P. & Ideker, T. Synthetic lethal networks for precision oncology: promises and pitfalls. _J. Mol. Biol._ 430, 2900–2912 (2018). Article
CAS PubMed PubMed Central Google Scholar * Baselga, J. et al. Everolimus in postmenopausal hormone-receptor-positive advanced breast cancer. _N. England J. Med._ 366, 520–529 (2012).
Article CAS Google Scholar * Tolcher, A. W. et al. Phase I study of the MEK inhibitor trametinib in combination with the AKT inhibitor afuresertib in patients with solid tumors and
multiple myeloma. _Cancer Chemother. Pharmacol._ 75, 183–189 (2014). Article PubMed CAS Google Scholar * Larkin, J. et al. Combined nivolumab and ipilimumab or monotherapy in untreated
melanoma. _N. England J. Med._ 373, 23–34 (2015). Article CAS Google Scholar * Saleem, H. et al. The TICking clock of EGFR therapy resistance in glioblastoma: target independence or
target compensation. _Drug Resist. Updates_ 43, 29–37 (2019). * Bajusz, D., Rácz, A. & Héberger, K. Why is Tanimoto index an appropriate choice for fingerprint-based similarity
calculations? _J. Cheminform._ 7, 20 (2015). Article PubMed PubMed Central CAS Google Scholar * Tan, P.-N., Steinbach, M., Karpatne, A. & Kumar, V. _Introduction to Data Mining,_
2nd edn (Pearson, 2005). * Sokal, R. R. & Rohlf, F. J. The comparison of dendrograms by objective methods. _TAXON_ 11, 33–40 (1962). Article Google Scholar * Schlee, D., Sneath, P. H.
A., Sokal, R. R. & Freeman, W. H. Numerical Taxonomy. The principles and practice of numerical classification. _Syst. Zool._ 24, 263 (1975). Article Google Scholar * Safikhani, Z. et
al. Assessment of pharmacogenomic agreement. _F1000Research_ 5, 825 (2016). Article PubMed PubMed Central Google Scholar * Cancer Cell Line Encyclopedia Consortium, and Genomics of Drug
Sensitivity in Cancer Consortium. Pharmacogenomic agreement between two cancer cell line data sets. _Nature_ 528, 84–87 (2015). * Bhat, K. P. L. et al. Mesenchymal differentiation mediated
by NF-κB promotes radiation resistance in glioblastoma. _Cancer Cell_ 24, 331–346 (2013). Article CAS PubMed Google Scholar * Shin, D. H., Lee, S.-J., Kim, J. S., Ryu, J.-H. & Kim,
J.-S. Synergistic effect of immunoliposomal gemcitabine and bevacizumab in glioblastoma stem cell-targeted therapy. _J. Biomed. Nanotechnol._ 11, 1989–2002 (2015). Article CAS PubMed
Google Scholar * Xu, W. et al. Combination of an anti-EGFRvIII antibody CH12 with Rapamycin synergistically inhibits the growth of EGFRvIII+PTEN-glioblastoma in vivo. _Oncotarget_ 7,
24752–24765 (2016). Article PubMed PubMed Central Google Scholar * Shi, K. et al. Arginine-glycine-aspartic acid-modified lipid-polymer hybrid nanoparticles for docetaxel delivery in
glioblastoma multiforme. _J. Biomed. Nanotechnol._ 11, 382–391 (2015). Article CAS PubMed Google Scholar * Prados, M. D. et al. Phase II study of erlotinib plus temozolomide during and
after radiation therapy in patients with newly diagnosed glioblastoma multiforme or gliosarcoma. _J. Clin. Oncol._ 27, 579–584 (2009). Article CAS PubMed Google Scholar * van Vo, A. et
al. Inhibition of JNK potentiates temozolomide-induced cytotoxicity in U87MG glioblastoma cells via suppression of Akt phosphorylation. _Anticancer Res._ 34, 5509–5515 (2014). CAS PubMed
Google Scholar * Hosni-Ahmed, A. et al. EDL-360: a potential novel antiglioma agent. _J. Cancer Sci. Ther._ 6, 370–377 (2014). CAS PubMed PubMed Central Google Scholar * Lin, F. et al.
PI3K–mTOR pathway inhibition exhibits efficacy against high-grade glioma in clinically relevant mouse models. _Clin. Cancer Res._ 23, 1286–1298 (2016). Article ADS PubMed CAS Google
Scholar * Nehoff, H., Parayath, N. N., McConnell, M. J., Taurin, S. & Greish, K. A combination of tyrosine kinase inhibitors, crizotinib and dasatinib for the treatment of glioblastoma
multiforme. _Oncotarget_ 6, 37948–37964 (2015). Article PubMed PubMed Central Google Scholar * Jhanwar-Uniyal, M. et al. Distinct signaling mechanisms of mTORC1 and mTORC2 in
glioblastoma multiforme: a tale of two complexes. _Adv. Biol. Regul._ 57, 64–74 (2015). Article CAS PubMed Google Scholar * Danciu, O. & Russell, M. Human trials of cancer drug PAC-1
continue with new investment (Clinicaltrials.gov Identifier NCT02355535), retrieved from https://www.clinicaltrials.gov/ct2/show/NCT02355535 (2015). * Gupta, P., Dixit, D. & Sen, E.
Oncrasin targets the JNK-NF-κB axis to sensitize glioma cells to TNFα-induced apoptosis. _Carcinogenesis_ 34, 388–396 (2012). Article PubMed CAS Google Scholar * Loewe, S. &
Muischnek, H. Über Kombinationswirkungen. _Naunyn-Schmiedebergs Archiv für experimentelle Pathologie und Pharmakologie_ 114, 313–326 (1926). Article CAS Google Scholar * Bliss, C. I. The
toxicity of poisons applied jointly 1. _Ann. Appl. Biol._ 26, 585–615 (1939). Article CAS Google Scholar * di Veroli, G. Y. et al. Combenefit: an interactive platform for the analysis and
visualization of drug combinations. _Bioinformatics_ 32, 2866–2868 (2016). Article PubMed PubMed Central CAS Google Scholar * Chou, T.-C. & Talalay, P. Generalized equations for
the analysis of inhibitions of Michaelis-Menten and higher-order kinetic systems with two or more mutually exclusive and nonexclusive inhibitors. _Eur. J. Biochem._ 115, 207–216 (2005).
Article Google Scholar * Kilkenny, C., Browne, W. J., Cuthill, I. C., Emerson, M. & Altman, D. G. Improving bioscience research reporting: the ARRIVE guidelines for reporting animal
research. _PLoS Biol._ 8, e1000412–e1000412 (2010). Article PubMed PubMed Central CAS Google Scholar * Caretti, V. et al. WEE1 kinase inhibition enhances the radiation response of
diffuse intrinsic pontine gliomas. _Mol. Cancer Ther._ 12, 141–150 (2012). Article PubMed CAS Google Scholar * Engels, F. Pharmacokinetic Optimization of Docetaxel Dosing, PhD thesis,
Erasmus University, Amsterdam (2004). * Human medicines European public assessment report (EPAR): Tagrisso, osimertinib, Carcinoma, Non-Small-Cell Lung. _Case Medical Res._ Retrieved from
www.ema.europa.eu/en/medicines/human/EPAR/tagrisso, https://doi.org/10.31525/cmr-5871ad (2018). * Basu, B. et al. First-in-human pharmacokinetic and pharmacodynamic study of the dual m-TORC
1/2 inhibitor AZD2014. _Clin. Cancer Res._ 21, 3412–3419 (2015). Article CAS PubMed PubMed Central Google Scholar Download references ACKNOWLEDGEMENTS This project was supported by the
Dutch Brain Cancer Society (Stichting StopHersentumoren) grants 2014-006 and 2015-009, the Dutch Cancer Society grants KWF-4874 and KWF-11038, Brain Tumour Charity Grant 488097 and
APCA-PoC-2017. We remember first co-author Piet Molenaar who sadly passed away during the final stages of publishing this collaborative project. Sjors van Heuveln is kindly thanked for
providing the multi-drug identification algorithm. Beheshta Haydari and Louise de Vos Klootwijk are kindly thanked for their contributions to the data curation effort and the in vivo
validations. Requests regarding applications of the drug atlas can be sent to B.A.W. AUTHOR INFORMATION Author notes * These authors contributed equally: Ravi S. Narayan, Piet Molenaar, Jian
Teng. * Deceased: Piet Molenaar. * These authors jointly supervised this work: Jan Koster, Bart A. Westerman. AUTHORS AND AFFILIATIONS * Department of Radiation Oncology, Amsterdam UMC,
location VUMC, Cancer Center, Amsterdam, the Netherlands Ravi S. Narayan, Rogier Dik, Eelke Brands, Ben J. Slotman & Peter Sminia * Department of Oncogenomics, Academic Medical Center,
Amsterdam, the Netherlands Piet Molenaar, Rogier Versteeg & Jan Koster * Experimental Therapeutics and Molecular Imaging Lab, Neuroscience Center, Neuro-Oncology Unit, Massachusetts
General Hospital and Harvard Medical School, Boston, MA, USA Jian Teng & Bakhos A. Tannous * Department of Neurosurgery, Amsterdam UMC, location VUMC, Cancer Center, Amsterdam, the
Netherlands Fleur M. G. Cornelissen, Irene Roelofs, Tonny Lagerweij, Yoran Broersma, Naomi Petersen, Jhon Alexander Marin Soto, Philip van Kuiken, Sjors G. J. G. In ‘t Veld, David Noske, Tom
Wurdinger & Bart A. Westerman * Department of Psychosocial Research and Epidemiology, Netherlands Cancer Institute, Amsterdam, the Netherlands Renee Menezes * Department of Medical
Oncology, Amsterdam UMC, location VUMC, Cancer Center, Amsterdam, the Netherlands Naomi Petersen * Department of Hematology, Amsterdam UMC, location VUMC, Cancer Center, Amsterdam, the
Netherlands Jhon Alexander Marin Soto * Center for Experimental Molecular Medicine (CEMM), Laboratory for Experimental Oncology and Radiobiology (LEXOR), Amsterdam UMC, location AMC, Cancer
Center, Amsterdam, the Netherlands Maria C. Lecca, Kristiaan J. Lenos & Louis Vermeulen * Department of Epidemiology and Biostatistics, Amsterdam UMC, location VUMC, Amsterdam, the
Netherlands Wessel van Wieringen * Department of Neurosurgery, Division of Surgery, The University of Texas MD Anderson Cancer Center, Houston, TX, USA Frederick F. Lang * Department of
Radiation Oncology, NYU Langone Health, New York, NY, 10016, USA Erik Sulman * Department of Computational Biology, The Jackson Laboratory for Genomic Medicine, Farmington, CT, USA Roel
Verhaak * Department of Radio-Oncology, Kantonsspital Graubünden, Loëstrasse 170, CH-7000, Chur, Switzerland Brigitta G. Baumert * Radiation Oncology, Academic Medical Center, Amsterdam, the
Netherlands Lucas J. A. Stalpers * Neurosurgery, Institute of Cancer and Genomic Sciences, University of Birmingham, Edgbaston, Birmingham, B15 2TT, UK Colin Watts * IOTA Pharmaceuticals
Ltd, St Johns Innovation Centre, Cowley Road, Cambridge, UK David Bailey Authors * Ravi S. Narayan View author publications You can also search for this author inPubMed Google Scholar * Piet
Molenaar View author publications You can also search for this author inPubMed Google Scholar * Jian Teng View author publications You can also search for this author inPubMed Google
Scholar * Fleur M. G. Cornelissen View author publications You can also search for this author inPubMed Google Scholar * Irene Roelofs View author publications You can also search for this
author inPubMed Google Scholar * Renee Menezes View author publications You can also search for this author inPubMed Google Scholar * Rogier Dik View author publications You can also search
for this author inPubMed Google Scholar * Tonny Lagerweij View author publications You can also search for this author inPubMed Google Scholar * Yoran Broersma View author publications You
can also search for this author inPubMed Google Scholar * Naomi Petersen View author publications You can also search for this author inPubMed Google Scholar * Jhon Alexander Marin Soto View
author publications You can also search for this author inPubMed Google Scholar * Eelke Brands View author publications You can also search for this author inPubMed Google Scholar * Philip
van Kuiken View author publications You can also search for this author inPubMed Google Scholar * Maria C. Lecca View author publications You can also search for this author inPubMed Google
Scholar * Kristiaan J. Lenos View author publications You can also search for this author inPubMed Google Scholar * Sjors G. J. G. In ‘t Veld View author publications You can also search for
this author inPubMed Google Scholar * Wessel van Wieringen View author publications You can also search for this author inPubMed Google Scholar * Frederick F. Lang View author publications
You can also search for this author inPubMed Google Scholar * Erik Sulman View author publications You can also search for this author inPubMed Google Scholar * Roel Verhaak View author
publications You can also search for this author inPubMed Google Scholar * Brigitta G. Baumert View author publications You can also search for this author inPubMed Google Scholar * Lucas J.
A. Stalpers View author publications You can also search for this author inPubMed Google Scholar * Louis Vermeulen View author publications You can also search for this author inPubMed
Google Scholar * Colin Watts View author publications You can also search for this author inPubMed Google Scholar * David Bailey View author publications You can also search for this author
inPubMed Google Scholar * Ben J. Slotman View author publications You can also search for this author inPubMed Google Scholar * Rogier Versteeg View author publications You can also search
for this author inPubMed Google Scholar * David Noske View author publications You can also search for this author inPubMed Google Scholar * Peter Sminia View author publications You can
also search for this author inPubMed Google Scholar * Bakhos A. Tannous View author publications You can also search for this author inPubMed Google Scholar * Tom Wurdinger View author
publications You can also search for this author inPubMed Google Scholar * Jan Koster View author publications You can also search for this author inPubMed Google Scholar * Bart A. Westerman
View author publications You can also search for this author inPubMed Google Scholar CONTRIBUTIONS B.A.W., J.K., and P.M. developed the conceptual framework. R.S.N., J.T., F.M.G.C., I.R.,
R.D., T.L., Y.B., N.P., J.A.M.S., E.B., M.C.L., and K.L. conducted all laboratory experiments. P.M., R.M., S.V., P.K., W.W., J.K., and B.A.W. performed the bioinformatics analyses. B.A.W.,
J.K., P.S., T.W., D.N., R. Verhaak, and R. Versteeg, F.F.L., E.S., B.G.B., L.J.A.S., L.V., C.W., B.A.T., D.B., B.J.S., and B.T. enabled the project by providing resources and supervision.
B.A.W., R.S.N., J.K., P.M., and J.T. wrote the paper. F.M.G.C. and I.R. contributed equally. All authors reviewed the paper. CORRESPONDING AUTHOR Correspondence to Bart A. Westerman. ETHICS
DECLARATIONS COMPETING INTERESTS The authors declare no competing interests. ADDITIONAL INFORMATION PEER REVIEW INFORMATION _Nature Communications_ thanks Sebastian Wicha and the other,
anonymous, reviewer(s) for their contribution to the peer review of this work. Peer reviewer reports are available. PUBLISHER’S NOTE Springer Nature remains neutral with regard to
jurisdictional claims in published maps and institutional affiliations. SUPPLEMENTARY INFORMATION SUPPLEMENTARY INFORMATION PEER REVIEW FILE DESCRIPTION OF ADDITIONAL SUPPLEMENTARY FILES
SUPPLEMENTARY DATA 1 SUPPLEMENTARY DATA 2 SUPPLEMENTARY DATA 3 SUPPLEMENTARY DATA 4 SUPPLEMENTARY DATA 5 REPORTING SUMMARY RIGHTS AND PERMISSIONS OPEN ACCESS This article is licensed under a
Creative Commons Attribution 4.0 International License, which permits use, sharing, adaptation, distribution and reproduction in any medium or format, as long as you give appropriate credit
to the original author(s) and the source, provide a link to the Creative Commons license, and indicate if changes were made. The images or other third party material in this article are
included in the article’s Creative Commons license, unless indicated otherwise in a credit line to the material. If material is not included in the article’s Creative Commons license and
your intended use is not permitted by statutory regulation or exceeds the permitted use, you will need to obtain permission directly from the copyright holder. To view a copy of this
license, visit http://creativecommons.org/licenses/by/4.0/. Reprints and permissions ABOUT THIS ARTICLE CITE THIS ARTICLE Narayan, R.S., Molenaar, P., Teng, J. _et al._ A cancer drug atlas
enables synergistic targeting of independent drug vulnerabilities. _Nat Commun_ 11, 2935 (2020). https://doi.org/10.1038/s41467-020-16735-2 Download citation * Received: 12 April 2019 *
Accepted: 06 May 2020 * Published: 10 June 2020 * DOI: https://doi.org/10.1038/s41467-020-16735-2 SHARE THIS ARTICLE Anyone you share the following link with will be able to read this
content: Get shareable link Sorry, a shareable link is not currently available for this article. Copy to clipboard Provided by the Springer Nature SharedIt content-sharing initiative