- Select a language for the TTS:
- UK English Female
- UK English Male
- US English Female
- US English Male
- Australian Female
- Australian Male
- Language selected: (auto detect) - EN
Play all audios:
ABSTRACT DNA replication stress, a feature of human cancers, often leads to instability at specific genomic loci, such as the common fragile sites (CFSs). Cells experiencing DNA replication
stress may also exhibit mitotic DNA synthesis (MiDAS). To understand the physiological function of MiDAS and its relationship to CFSs, we mapped, at high resolution, the genomic sites of
MiDAS in cells treated with the DNA polymerase inhibitor aphidicolin. Sites of MiDAS were evident as well-defined peaks that were largely conserved between cell lines and encompassed all
known CFSs. The MiDAS peaks mapped within large, transcribed, origin-poor genomic regions. In cells that had been treated with aphidicolin, these regions remained unreplicated even in late S
phase; MiDAS then served to complete their replication after the cells entered mitosis. Interestingly, leading and lagging strand synthesis were uncoupled in MiDAS, consistent with MiDAS
being a form of break-induced replication, a repair mechanism for collapsed DNA replication forks. Our results provide a better understanding of the mechanisms leading to genomic instability
at CFSs and in cancer cells. SIMILAR CONTENT BEING VIEWED BY OTHERS GENOME-WIDE HIGH-RESOLUTION MAPPING OF MITOTIC DNA SYNTHESIS SITES AND COMMON FRAGILE SITES BY DIRECT SEQUENCING Article
19 June 2020 MISTIMED ORIGIN LICENSING AND ACTIVATION STABILIZE COMMON FRAGILE SITES UNDER TIGHT DNA-REPLICATION CHECKPOINT ACTIVATION Article 06 April 2023 GENOME-WIDE MEASUREMENT OF DNA
REPLICATION FORK DIRECTIONALITY AND QUANTIFICATION OF DNA REPLICATION INITIATION AND TERMINATION WITH OKAZAKI FRAGMENT SEQUENCING Article 18 January 2023 INTRODUCTION The accurate
duplication of the genome is fundamental for cell viability. In eukaryotes, DNA replication initiates at specific genomic locations called replication origins. Origin firing generates two
replication forks that advance bidirectionally along the parental DNA template until they each encounter a converging replication fork.1 Although, in principle, the above process can ensure
complete replication of the genome, several obstacles can be encountered that have the potential to arrest or perturb ongoing fork progression. These include atypical structures formed in
the DNA template, such as hairpins and G-quadruplexes, or encounters with the machineries carrying out other DNA metabolic processes, such as transcription.2,3,4,5 Curiously, many eukaryotic
genomes harbor evolutionarily conserved regions that appear intrinsically difficult to replicate. The most extensively studied of these regions are the so-called common fragile sites
(CFSs).6,7,8,9,10,11 These sites are of broad interest, because they very frequently correspond to sites of genomic rearrangements in human cancers; indeed, six of the ten most common loci
for recurrent focal deletions in human cancers lie within CFSs.12 CFSs, so named because they are present in the genome of all individuals, are expressed as breaks or gaps on mitotic
chromosomes of cells treated with the DNA polymerase inhibitor aphidicolin.6 Around 86 aphidicolin-induced CFSs have been mapped at low resolution by cytogenetic methods.9,13 A handful of
these have also been mapped at higher resolution by in situ hybridization analysis of chromosomes with YAC and BAC probes.9,14,15,16,17,18 Many CFSs map within large genes14,15,19,20 that
are transcriptionally active13 and that replicate in late S phase.21,22,23 Additionally, some CFSs correspond to regions with a low replication origin density,24 while others may have a
normal origin density, but lack dormant origins that can fire under conditions of DNA replication stress.25 What makes CFSs sensitive to DNA replication stress is still a matter of
debate.9,11,26,27,28,29 The fragile loci visible on metaphase chromosomes may correspond to regions of the genome that have failed to complete replication prior to mitotic entry. One
attractive model proposes that CFSs require a substantial time to replicate because they correspond to large, late-replicating, origin-poor genomic regions.24 An alternative model, based on
the observation that CFSs often map within transcribed genes,13,17,20,24,30,31 proposes that the transcription machinery either induces fork collapse or that it displaces origin recognition
complexes preventing these origins from firing. In either case, the result would be a failure to complete replication of the locus during interphase. Yet another possibility is that the DNA
sequences present within the CFSs may be inherently difficult to replicate due to their propensity to adopt atypical secondary structures.16,32,33,34,35,36 Interestingly, treatment of cells
with aphidicolin leads not only to breaks and gaps on mitotic chromosomes, but also to foci of nascent DNA synthesis that decorate these chromosomes.37 These foci represent sites of
so-called mitotic DNA synthesis (MiDAS), and generally colocalize with FANCD2 foci and with ultrafine anaphase bridges, which mark the chromosomal positions of CFSs in cells exposed to
aphidicolin.37,38,39 MiDAS shares features with break-induced DNA replication (BIR), a homologous recombination-based pathway for repair and restart of collapsed DNA replication
forks.40,41,42 MiDAS is dependent on genes that function in BIR, such as _POLD3_, _RAD52_, _FANCD2_ and _SLX4_.37,43,44,45,46,47,48 In addition, some, but not all, of the MiDAS foci on
mitotic chromosomes involve only one of the two sister chromatids, which is consistent with conservative DNA replication, a feature of BIR.37,49,50,51 Nevertheless, the precise biological
function of MiDAS is unclear. MiDAS might help complete replication of genomic loci that had not been replicated prior to mitotic entry. Alternatively, MiDAS might be involved in repair of
DNA double-strand breaks and other forms of DNA damage in mitotic cells. Here, we studied aphidicolin-treated cells using EdUseq52 to map the genomic regions that remain under-replicated
prior to mitotic entry and the genomic sites undergoing MiDAS. Our analysis revealed that the main function of MiDAS is to help complete replication of the genome. The genomic regions
replicated by MiDAS encompass all known CFSs, as well as a repertoire of other CFS-like sites, all of which are now mapped at high resolution. We also provide evidence supporting the
hypothesis that MiDAS is mediated by BIR, as well as mechanistic insights that help explain why CFSs are prone to genomic instability in human cancers and in cells treated with DNA
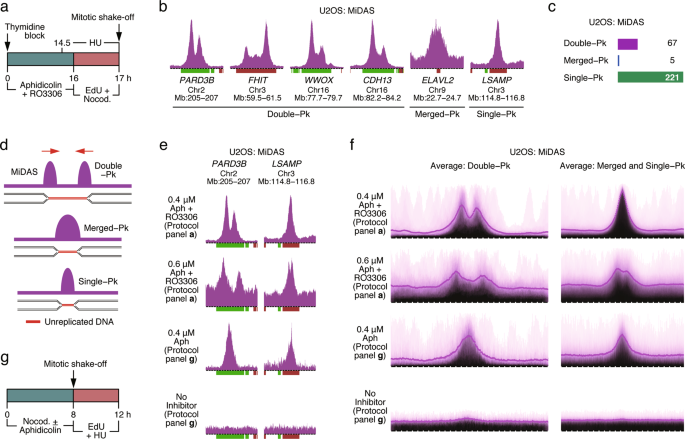
replication inhibitors. RESULTS MIDAS INITIATES FROM THE BORDERS OF REPLICATED/UNREPLICATED GENOMIC REGIONS We established a protocol to sequence the genomic regions undergoing MiDAS (Fig.
1a). Briefly, cells were synchronized with thymidine at the G1/S boundary and then released into S phase in the presence of aphidicolin and RO3306. Aphidicolin slows down DNA replication,
while RO3306, a CDK1 inhibitor, prevents entry into mitosis. Sixteen hours later, aphidicolin and RO3306 were removed, and EdU and nocodazole were added to the media. EdU labels nascent DNA,
while nocodazole arrests cells in prometaphase and prevents mitotic exit. One hour later, the prometaphase-arrested cells were collected by mitotic shake-off and their EdU-labeled genomic
DNA was affinity-purified and subjected to high throughput sequencing (Fig. 1a). At the time that the mitotic cells were harvested, a small fraction of the cells in the population were still
in S phase, and hence were incorporating very high levels of EdU that could contaminate the EdU signal from the mitotic cells (Supplementary information, Fig. S1a). To avoid this,
hydroxyurea (HU) was added to the medium 2.5 h prior to the mitotic shake-off (Fig. 1a). HU reduces the nucleotide pool to levels unable to support DNA synthesis of cells in S phase, but has
little impact on the low levels of DNA synthesis occurring in mitotic cells (see below). First, we examined MiDAS in U2OS human osteosarcoma cells (Fig. 1b). Using a custom script, a total
of 293 MiDAS regions were identified and these could be divided into three types: double-peak (_n_ = 67), merged-peak (_n_ = 5) and single-peak (_n_ = 221) (Fig. 1c; Supplementary
information, Fig. S1b). Examples of double-peak MiDAS regions mapping to the genes _PARD3B_, _FHIT_, _WWOX_ and _CDH13_, respectively, are shown in Fig. 1b. The merged-peak MiDAS regions
resembled double-peak regions, except that there was little or no space between the two peaks (Fig. 1b, region mapping to the _ELAVL2_ gene), whereas the single-peak MiDAS regions had a peak
width similar to that of one peak of the double-peak regions (Fig. 1b, region mapping to the _LSAMP_ gene). One interpretation for the existence of three types of MiDAS regions is that DNA
synthesis in mitosis initiates from collapsed DNA replication forks present at the border of the replicated/unreplicated genomic regions (Fig. 1d). According to this interpretation, when the
unreplicated genomic region is above a certain size, the two peaks of nascent DNA synthesis at each end of the unreplicated region would be well-separated (Fig. 1d, double-peak region). For
shorter unreplicated genomic regions, the two peaks would be less well-resolved, resulting in little or no space between them (Fig. 1d, merged-peak), or may completely overlap and appear as
a single-peak (Fig. 1d, single-peak). To explore the above interpretation, we performed various permutations of the MiDAS protocol. In the first permutation, we increased the dose of
aphidicolin during S phase from 0.4 to 0.6 μM (Fig. 1a). We anticipated that this would lead to an increase in the length of the unreplicated genomic regions, a prediction confirmed by
inspection of individual MiDAS regions (Fig. 1e) and the genome-wide averages of all MiDAS regions (Fig. 1f). Under these conditions, most of the single-peak MiDAS regions were transformed
into double-peak regions (Fig. 1e, f). In a second permutation, we modified the MiDAS protocol to label nascent DNA in cells that had already advanced into prophase/prometaphase prior to the
addition of EdU. In this second protocol, unsynchronized U2OS cells were treated with aphidicolin and nocodazole for 8 h, and then the prophase/prometaphase cells were isolated and EdU and
HU were added to the media (Fig. 1g). Under these conditions, all double-peak MiDAS regions were transformed into single-peak regions (Fig. 1e, f). In a variation of this second protocol,
when no aphidicolin was added to the cells, little or no MiDAS was observed (Fig. 1e, f), suggesting that MiDAS is observed mostly when DNA replication is perturbed and only rarely under
normal growth conditions. Finally, since the width of the MiDAS regions varied according to the experimental protocol used, it appears that there are no site-specific roadblocks to DNA
replication within the MiDAS regions. To further strengthen the model that MiDAS corresponds to regions of the genome that remain under-replicated prior to mitotic entry, we monitored DNA
replication during S phase. The cells were released from a thymidine block and allowed to progress through S phase in the presence or absence of low dose aphidicolin and/or RO3306. At
various timepoints after release from the thymidine block, EdU was added to the medium and 30 min later the cells were harvested and the nascent DNA sequenced. Using the genomic region
mapping to the _WWOX_ gene as an example, we observed that the last segment of the genome to be replicated in aphidicolin-treated cells corresponded precisely to the region defined by
MiDAS-associated EdU peaks (Fig. 2a, b; Supplementary information, Fig. S2a, b). In the absence of aphidicolin, the same region was again the last one to be replicated, but DNA replication
was completed prior to mitotic entry (Fig. 2a, 12 h timepoint after release from the thymidine block; Supplementary information, Fig. S2a). Genome-wide averages of all the MiDAS regions
confirmed the observation that the genomic regions undergoing MiDAS had failed to complete replication prior to mitotic entry (Fig. 2c, d; Supplementary information, Fig. S2c, d). As
expected, the average length of the unreplicated regions was significantly larger for the double-peak MiDAS regions than for the single-peak regions. Importantly, in all cases, the MiDAS
peaks mapped at the border of the replicated/unreplicated genomic segments. Thus, these results are consistent with MiDAS originating from the collapsed DNA replication forks, where DNA
replication stopped upon mitotic entry (Fig. 1d). The double-peak pattern further argues that, at least in these regions, MiDAS does not involve firing of dormant origins within the center
of the unreplicated genomic segment. DNA REPLICATION DIRECTIONALITY IN MIDAS To explore the generality of these observations, we examined a second cell line, HeLa, which is derived from a
different tissue type than U2OS cells (epithelial, rather than mesenchymal). Using the same protocol as applied for U2OS cells (Fig. 1a; Supplementary information, Fig. S3a), we again
observed MiDAS regions that could be classified as double-peak (_n_ = 16), merged-peak (_n_ = 8) and single-peak (_n_ = 182) (Fig. 3a, b). Nascent DNA sequencing in late S phase cells,
confirmed that the MiDAS regions corresponded to the genomic domains that had not completed replication prior to mitotic entry (Supplementary information, Fig. S3b, c). In addition to the
standard analysis of the sequencing data, we also examined the directionality of the sequencing reads. High throughput sequencing of double-stranded DNA fragments should reveal no
directionality, as either end of the DNA fragment can initiate first-strand synthesis (Fig. 3c, left panel). However, if one of the two DNA strands systematically bears nicks or gaps, then
this strand would be underrepresented because it cannot be amplified (Fig. 3c, right panel). Strikingly, the MiDAS reads from HeLa cells revealed sequencing directionality (Fig. 3d). In the
double-peak regions, the left peak was overrepresented by forward reads, while the right peak was overrepresented by reverse reads. Genome-wide averages of all the double-peak MiDAS regions
confirmed the generality of this observation (Fig. 3e). Directionality was also evident when the merged-peak MiDAS regions were averaged, whereas the averages of the single-peak regions
showed no directionality (Fig. 3e), consistent with the hypothesis that the latter regions harbor two peaks that are not resolved from each other (Fig. 1d). A second independent experiment
confirmed the directionality of DNA synthesis associated with MiDAS in HeLa cells (Supplementary information, Fig. S3d). We interpret the observed directionality to indicate that lagging
strand synthesis is often delayed compared to leading strand synthesis, since delays in lagging strand synthesis could result in gaps between the Okazaki fragments and an inability to
amplify these fragments during library preparation. The directionality is also consistent with the model that MiDAS begins at the ends of the unreplicated genomic regions and proceeds toward
the center (Fig. 1d). Interestingly, a similar analysis of the U2OS sequencing data did not reveal directionality, suggesting that U2OS cells couple mitotic leading and lagging strand
synthesis more efficiently than HeLa cells (see “Discussion”). Finally, we studied MiDAS in HS68 human fibroblasts, which are not cancer-derived. In these cells, we identified 36 MiDAS
regions, which were classified as merged-peak (_n_ = 7) and single-peak (_n_ = 29) (Fig. 4a–c; Supplementary information, Fig. S4a). No double-peak MiDAS regions were evident in HS68 cells.
Thus, the MiDAS regions that were double-peak in U2OS or HeLa cells, were single-peak or even absent in HS68 cells (compare Figs. 3a and 4a). The MiDAS regions that were single-peak in U2OS
and HeLa cells were mostly absent in HS68 cells, which explains the much smaller number of MiDAS regions in HS68 cells. We interpret these observations to indicate that HS68 cells generally
entered mitosis only after the vast majority of the genome had been replicated. It was not possible to accurately assess directionality of sequencing reads in the HS68 cells because this is
best assessed in the context of double-peak MiDAS regions, which were absent in HS68 cells. SIZE AND GENIC COMPOSITION OF MIDAS REGIONS Next, we set out to characterize the MiDAS regions
identified in all three cell lines (Supplementary information, Table S1) with regard to size, genic composition and overlap with CFSs. Plotting the size of the MiDAS regions, as determined
by our peak-finding algorithm, revealed that the double-peak MiDAS regions were larger than the merged-peak regions, which, in turn, were larger than the single-peak regions (Fig. 4d). In
the three cell lines that we studied, the median sizes of the double-peak regions ranged between 1.1 and 1.2 Mb, whereas the median sizes of the single-peak regions ranged between 0.5 and
0.6 Mb (Fig. 4d). With regard to genic composition, about two-thirds of the MiDAS regions mapped to one gene; very few mapped to two adjacent genes with a small intergenic sequence between
them; and the remaining one-third mapped to intergenic regions (Supplementary information, Fig. S4b). The single genes associated with MiDAS regions were unusually large; in the three cell
lines that we studied, their median length ranged between 630 and 930 kb (Fig. 4e). By comparison, the median human gene length is about 55 kb. OVERLAP OF MIDAS REGIONS WITH CFSS AND
RELATION TO MIDAS FOCI The number of MiDAS regions identified by high throughput sequencing ranged from 293 and 206 in U2OS and HeLa cells, respectively, to 36 in HS68 cells. Interestingly,
the number of MiDAS foci visualized by microscopy in mitotic cells showed a similar distribution with more foci present in U2OS cells, slightly fewer in HeLa cells and significantly fewer in
HS68 cells (Supplementary information, Fig. S4c, d). As mentioned above, adding HU to the media had no impact on the number or intensity of MiDAS foci (Supplementary information, Fig. S4c,
d). At the genome level, the MiDAS regions identified in the three cell lines overlapped to a significant degree. Of the 206 MiDAS regions present in HeLa cells, 127 (62%) were also present
in U2OS cells. Moreover, of the 36 MiDAS regions identified in HS68 cells, 35 (97%) were present in U2OS and/or HeLa cells (Fig. 4f). To monitor the overlap of the MiDAS regions with CFSs,
we used a comprehensive list of cytogenetically-defined CFSs.13 We focused on 73 CFSs that map to defined genes, since we could assign the position of these CFSs on the genome. A merged list
of the MiDAS regions identified in the three cell lines in our study, encompassed all the known 73 CFSs cited above (Fig. 4g). Interestingly, of the 70 MiDAS regions identified in U2OS
cells that mapped to known CFSs, 39% were double-peak MiDAS regions. In contrast, of the 223 MiDAS regions identified in U2OS cells that did not map to known CFSs, only 18% were double-peak
regions. Thus, the known CFSs correspond preferentially to the larger, double-peak MiDAS regions. Since size is likely to be a factor in identifying CFSs, this may explain why some of the
single-peak MiDAS regions have not been identified previously as CFSs. CFS-LIKE PROPERTIES OF THE MIDAS REGIONS CFSs map to large, late-replicating, transcribed genes,13,14,15,19,20,21
prompting us to examine the DNA replication and transcription profiles of MiDAS regions. For replication timing, we used our previously-generated, genome-wide data derived from untreated
U2OS cells.53 For transcriptional activity, we sequenced the nascent transcripts of unsynchronized U2OS, HeLa and HS68 cells. In all three cell lines, the MiDAS regions mapped to either mid
S or late S phase replicating genomic domains (Fig. 5; Supplementary information, Fig. S5). In addition, all the MiDAS regions, even those that did not map to genes, corresponded to actively
transcribed genomic domains. Importantly, there was a strong concordance between the size of the MiDAS region and the length of the transcribed domain (Fig. 5; Supplementary information,
Fig. S5). To further probe the link between MiDAS and transcriptional activity, we took advantage of the fact that certain genomic regions exhibited MiDAS in U2OS, but not in HeLa cells
(Fig. 4f). These regions were transcriptionally active in U2OS cells, but not in HeLa cells (Supplementary information, Fig. S6a), providing a very strong correlation between MiDAS and
transcriptional activity. We also focused on the intergenic genomic regions that exhibited MiDAS in U2OS cells. All these regions were transcriptionally active in U2OS cells, but in HS68
cells most of these regions were transcriptionally inactive and did not exhibit MiDAS (Supplementary information, Fig. S6b). These data are consistent with there being a causative role for
transcriptional activity in triggering MiDAS and also revealed that transcriptional activity in intergenic regions is more prevalent in cancer cells, than in normal cells, possibly linked to
cancer-associated genomic rearrangements and/or epigenetic changes. PAUCITY OF REPLICATION ORIGIN FIRING WITHIN MIDAS REGIONS Previous analysis of a very small number of CFSs has suggested
that few if any DNA replication origins fire within CFSs.22,24 We examined whether the same applied for MiDAS regions. For this analysis, we were unable to use our recently described method
to monitor origin firing,52 since this method can only interrogate firing of early S origins, whereas the MiDAS regions map to mid S- and late S-replicating genomic domains. In both lower
and higher eukaryotes, inactivation of the RIF1 protein deregulates the timing of origin firing, such that mid S and late S origins fire prematurely.54,55,56 Hence, we depleted RIF1 in U2OS
cells (Supplementary information, Fig. S7a) and monitored origin firing genome-wide. As reported previously, RIF1 depletion induced premature origin firing in mid S- and late S-replicating
domains (Fig. 6a, b; Supplementary information, Fig. S7b). However, origin firing was generally lacking within MiDAS regions, as shown by the example of the _EXOC4_ locus and, also,
genome-wide (Fig. 6a, b). Reduced firing of replication origins within MiDAS regions means that their replication would be dependent on flanking origins; hence, DNA replication forks would
have to travel very long distances to complete replication. We propose that this can help explain why the MiDAS regions are not fully replicated prior to mitotic entry in cells treated with
aphidicolin. MAPPING OF CANCER GENOME REARRANGEMENT BREAKPOINTS TO MIDAS REGIONS CFSs are frequently the sites of chromosomal rearrangements in cancer,9,12,19,29,57,58,59,60,61,62 which
prompted us to examine whether cancer genome rearrangement breakpoints map to MiDAS regions. We interrogated a dataset of approximately half a million genomic rearrangements identified in
five thousand cancers across twelve different cancer types.61 From this dataset, we retained only the simple genomic deletions and amplifications, for which both breakpoint termini mapped
within 1 Mb of the center of a MiDAS region. This allowed us to examine the focal genomic rearrangements that mapped within MiDAS regions. We performed this analysis using the list of MiDAS
regions identified in U2OS cells. The MiDAS regions were split into four groups: mid S-replicating double-peak regions (_n_ = 33); late S-replicating double-peak regions (_n_ = 34); mid
S-replicating merged-peak and single-peak regions (_n_ = 123); and late S-replicating merged-peak and single-peak regions (_n_ = 103). The replication timing in the above classification
refers to the replication timing at the center of the MiDAS region. For each of the above groups, we plotted the number of deletions and duplications that mapped to each genomic bin. The
number of deletions peaked at the center of the MiDAS regions (Fig. 7a), which is consistent with deletions arising from an inability to complete replication of these genomic domains. In
contrast, the number of duplications showed two peaks that flanked the MiDAS regions (Fig. 7a). We speculate that duplications arise when a converging fork replicates beyond the site of a
collapsed fork; in this case, a genomic segment would be replicated twice: once by the converging fork and once by the fork initiated by BIR repair of the collapsed fork (Supplementary
information, Fig. S8).41 Thus, duplications may not indicate a failure to complete replication, but rather an error in repair of collapsed DNA replication forks. Consistent with this
interpretation, deletions were more frequent than duplications in the late S-replicating, double-peak MiDAS regions, since in this case large genomic segments need to be replicated within a
short time window in late S phase. In contrast, duplications were more frequent than deletions in the mid S-replicating, merged-peak and single-peak regions, in which case there is a larger
time window to replicate a relatively shorter genomic segment (Fig. 7a). Since the formation of duplications cannot easily be explained by a failure to complete DNA replication, we infer
that some genomic rearrangements targeting MiDAS regions and CFSs in cancer are likely due to replication-transcription conflicts, rather than being simply due to delayed, but unperturbed,
replication of the locus. Indeed, oncogenes induce the firing of ectopic DNA replication origins within genes and, particularly, within large genes. We had previously identified sets of
large genes that harbor oncogene-induced DNA replication origins.53 These genes map to early (_n_ = 26) or mid (_n_ = 28) S-replicating genomic domains. We plotted the human cancer genomic
rearrangements that map to these genes and found that duplications were more frequent than deletions in the early S genes, whereas the inverse was true for the mid S genes (Fig. 7b). Not
unexpectedly, 25 of the 28 mid S-replicating large genes harboring oncogene-induced DNA replication origins also exhibited MiDAS, since large, transcriptionally active genomic domains favor
both firing of oncogene-induced origins and MiDAS (Fig. 7c). DISCUSSION MIDAS PERMITS CFSS TO BE MAPPED AT HIGH RESOLUTION ON THE HUMAN GENOME Previously, the study of MiDAS was limited to
inspection of EdU-positive foci on mitotic chromosomes.37,44 Using a variant of EdUseq,52 we mapped the genomic coordinates of MiDAS at high resolution. Depending on the cells studied, the
number of MiDAS regions ranged between 36 and 293. Merging of all the MiDAS regions across the three cell lines, led to the identification of a total of 373 unique loci undergoing MiDAS.
These loci included all the 73 human CFSs previously mapped to large genes.13 The remaining MiDAS regions also have features characteristic of CFSs, as they corresponded to large,
transcribed, origin-poor, mid S- or late S-replicating genomic domains. The larger number of MiDAS regions identified in our study compared to the known CFSs most likely reflects the much
higher sensitivity of the EdUseq method, as compared to observing chromosomal breaks or gaps on mitotic chromosomes. We suggest, therefore, that the list of MiDAS regions identified here
provides a more definitive and comprehensive resource of CFSs than has been available hitherto. MIDAS APPEARS TO BE A BIR REPAIR PATHWAY FOR COMPLETING DUPLICATION OF THE GENOME Previous
studies had established the presence of MiDAS in cells treated with aphidicolin, but had not determined the physiological role of such DNA synthesis.37,44 Our results strongly support the
hypothesis that MiDAS serves to complete genome duplication in cells that enter mitosis without having fully replicated their genomic DNA. Monitoring DNA synthesis genome-wide in late S
phase cells treated with aphidicolin revealed genomic regions that failed to be replicated even 24 h after the cells had entered S phase. These regions corresponded precisely to the genomic
regions that exhibited MiDAS upon mitotic entry. MiDAS is dependent on _POLD3_ and other genes that function in BIR.37,43,44,45,46,47,48 Accordingly, it has been proposed that MiDAS is a
form of BIR.44 Two observations from our current study support this premise. First, the MiDAS peaks map to the boundaries of the replicated/unreplicated genomic regions in late S cells. This
pattern is consistent with the ongoing DNA replication forks collapsing when cells enter mitosis, and then DNA replication re-initiating from the sites of the collapsed forks through BIR.
Indeed, high levels of mitotic cyclin-dependent kinases induce fork collapse, as shown in various experimental systems.63 The alternative scenario of MiDAS being driven by the firing of
dormant origins within the body of the unreplicated genomic regions would have resulted in DNA replication being more prominent at the center of the unreplicated segments, rather than at
their borders. The sequence directionality of the MiDAS-driven EdU incorporation in HeLa cells further supports the notion that MiDAS is a form of BIR. Although such sequencing
directionality has not, to our knowledge, been described previously, it is consistent with BIR, where leading and lagging strand synthesis can be dissociated.49,50 We did not observe
sequencing directionality in HS68 and U2OS cells. However, in HS68 cells, the MiDAS regions were single-peak, making it difficult to observe sequencing directionality. U2OS cells utilize the
alternative-lengthening of telomeres (ALT) pathway to maintain telomere length. Since ALT is mediated by BIR,51,64,65 it is possible that U2OS cells have become highly proficient in BIR,
thereby minimizing the temporal dissociation of leading and lagging strand synthesis. MECHANISMS FOR INDUCTION OF GENOMIC INSTABILITY AT CFSS A number of mechanisms have been proposed to
explain the presence of genomic instability at CFSs.9,11,26,27,28,29 One model posits that CFSs contain regions that are unusually hard to replicate due to their sequence composition,
thereby explaining why these regions remain unreplicated in cells entering mitosis.36 Our analysis is largely inconsistent with this model, as the position of the MiDAS peaks in cells
entering mitosis varied depending on the concentration of aphidicolin used. Nevertheless, it remains possible that sequences that are prone to secondary structure formation impede MiDAS
rather than conventional DNA replication, thereby resulting in chromosomal breaks and/or gaps. A second model posits that the genomic organization of CFSs is such that these regions require
a very long time to replicate.9,10,22,24 Our findings support this model. The MiDAS regions, which encompass the known CFSs, map to large, late-replicating, origin-poor genomic domains that
are, therefore, at risk of failing to complete DNA replication before cells enter mitosis.9,10 Indeed, replication of the MiDAS regions is mediated by two converging DNA replication forks,
each of which needs to travel distances of 200–700 kb. The reason MiDAS regions lack DNA replication origins can be attributed to the presence of transcriptional activity. Transcription
suppresses origin firing53 and the MiDAS regions are universally transcriptionally active. Thus, suppression of replication origin firing over large, late-replicating genomic regions by
transcription, could result in an inability to complete replication of these regions prior to mitotic entry and, hence, to genomic instability. This sequence of events explains why exposure
of cells to aphidicolin enhances dramatically the presence of genomic instability at CFSs, since aphidicolin slows down fork progression and makes it even less likely that CFSs will be
replicated prior to cell division. RELEVANCE TO CANCER Recently, we described a mechanism to explain how oncogenes induce genomic instability in cancer.53 Briefly, we observed that oncogenes
induce firing of DNA replication origins within transcribed genes, resulting in replication-transcription conflicts, formation of DNA double-strand breaks and genomic instability. In normal
cells, intragenic replication origins are inactivated by transcription during the G1 phase of the cell cycle. However, in cancer cells, the oncogene-induced shortening of the length of the
G1 phase leaves less time for transcription to inactivate all intragenic origins, particularly those origins that are present within very large genes. The genomic features associated with
oncogene-induced DNA replication origins and with MiDAS are similar; very large, transcribed genes. Accordingly, we view genomic instability at CFSs in cancer as being due to two mechanisms:
(i) replication-transcription conflicts due to the firing of oncogene-induced origins and (ii) failure to complete DNA replication prior to mitotic entry (Fig. 7c). The first mechanism
would lead to fork collapse and repair by BIR, which in turn could lead to genomic duplications at the borders of the CFSs (Supplementary information, Fig. S8). The second mechanism would
lead to genomic deletions at the central portions of the CFSs. Oncogene-induced DNA replication origins fire predominantly in the early S- and mid S-replicating genomic domains, whereas
failure to complete DNA replication prior to mitotic entry is more relevant in the context of mid S- and late S-replicating domains. Accordingly, in human cancers, focal genomic duplications
are more prevalent in mid S-replicating CFSs, whereas focal genomic deletions are more prevalent in late S-replicating CFSs (Fig. 7a). Given the high frequency of genomic instability at
CFSs in cancer, the mapping of MiDAS regions throughout the genome could help identify cancers that are experiencing DNA replication stress. There is clearly a need for the development of a
good biomarker for DNA replication stress in the clinic, particularly considering that several drugs that target DNA replication stress, including ATR and Chk1 inhibitors, are currently
being evaluated in clinical trials.66,67,68 Thus, the precise mapping of MiDAS regions, reported here and in an accompanying paper,69 will accelerate the development of reliable clinical
biomarkers. MATERIALS AND METHODS CELL CULTURE U2OS, HeLa and HS68 cells were maintained at 37 °C in Dulbecco’s modified Eagle’s medium (Invitrogen, Cat. No. 11960) supplemented with
penicillin-streptomycin-glutamine (Invitrogen, Cat. No. 10378-016) and either 10% fetal bovine serum (FBS; Invitrogen, Cat. No. 10500) for U2OS and HeLa cells, or 15% fetal bovine serum for
HS68 cells. For some experiments, a clone of U2OS cells that can inducibly overexpress cyclin E (U2OS-CE) was used. For this clone, the culture medium was additionally supplemented with 400
μg/mL G418 (Invitrogen, Cat. No. 10131-027), 1 μg/mL puromycin (Sigma, Cat. No. P8833) and 2 μg/mL tetracycline (Sigma, Cat. No. T7660). Under these conditions, ectopic cyclin E protein
levels are maintained at low levels and the cells behave as normal U2OS cells.41,45,57 ANTIBODIES USED FOR IMMUNOBLOTTING Immunoblotting were performed using the following antibodies: RIF1
(Bethyl, Cat. No. A300-569A) and α-Actinin (Millipore, Cat. No. 05–384). MIDAS MAIN PROTOCOL To synchronize the cells at the G1/S transition, asynchronously growing cell cultures, at 70%
confluency, were treated with 2 mM thymidine (Sigma-Aldrich, T1895). The thymidine block was maintained for 18 h in U2OS and HeLa cells and for 30 h in HS68 cells. The cells were then washed
four times with warm PBS and were released into warm medium containing aphidicolin (0.4 µM, unless specifically indicated otherwise) (Sigma-Aldrich, A0781) and RO3306 (9 µM) (APExBio,
A8885), to respectively expose the cells to replication stress and arrest them at the G2/M boundary. U2OS and HeLa cells were both released for 16 h, whereas HS68 cells were released for 30
h, as they needed a longer release period to complete S phase under these conditions. The G2-arrested cells were then thoroughly washed three times with warm medium for 5 min and were
released for 1 h into warm medium containing 200 ng/mL nocodazole (Tocris, Cat. No. 1228) and 10 µM EdU (Thermo Fisher, A10044) to label DNA synthesis in early mitosis and subsequently
arrest them in prometaphase. The nocodazole-arrested cells were then collected by mitotic shake-off and fixed with ice-cold 90% methanol overnight at −20 °C. Because a small proportion of
the cells had not yet reached G2 phase at the time of the EdU treatment, 2 mM hydroxyurea (Sigma-Aldrich, H8627) was also added to the cells for the last 1.5 h of the RO3306 treatment and
for the entire time of the EdU and nocodazole treatment, to suppress the EdU signal from any S phase cells that could potentially detach during the mitotic shake-off. Biotinylation and
isolation of EdU-labeled DNA was then performed as described previously.52,53 Briefly, after fixation, the cells were permeabilized with 0.2% Triton-X in PBS, and EdU was attached to a
cleavable biotin linker (Azide-PEG(3 + 3)-S-S-biotin) (Jena Biosciences, Cat. No. CLK-A2112-10) using the reagents of the Click-it Kit (Invitrogen, Cat. No. C-10424). The DNA was isolated by
phenol-chloroform extraction and ethanol precipitation and then sonicated to a size of 100–500 bp. Dynabeads MyOne streptavidin C1 (Invitrogen, Cat. No. 65001) were used to isolate the
EdU-labeled DNA fragments. The beads were washed three times with Binding and Washing Buffer 1× (5 mM Tris-HCl, pH 7.5, 0.5 mM EDTA, 1 M NaCl, 0.5% Tween-20) and then resuspended in twice
their original volume with an equal volume of Binding and Washing Buffer 2× containing the sonicated DNA. The DNA-bead mixture was incubated 15 min at room temperature with rotation, prior
to washing the beads three times with Binding and Washing Buffer 1× and once with TE buffer (10 mM Tris-HCl, pH 8.0, 10 mM EDTA). To elute the EdU-labeled DNA from the streptavidin beads, 2%
β-mercaptoethanol (Sigma, Cat. No. M6250) was added for 1 h at room temperature. The eluted DNA was finally used for library preparation. Sequencing libraries were made by the Genomics
Platform of the University of Geneva using the TruSeq ChIP Sample Prep Kit (Illumina, Cat. No. IP-202-1012). One hundred base pair single-or paired-end read sequencing reactions were then
performed on an Illumina Hi-Seq 4000 sequencer. ALTERNATE PROTOCOL For the alternate MiDAS protocol, a different synchronization strategy was used in order to study DNA synthesis in cells
that had already entered mitosis. Asynchronously growing cells, at 70% confluency, were treated for 8 h with 100 ng/mL nocodazole (Tocris, Cat. No. 1228) and 0.4 µM aphidicolin
(Sigma-Aldrich, A0781) to induce DNA replication stress in S phase cells before arresting them in prometaphase. Negative control cells were obtained by treating the cells with nocodazole but
omitting aphidicolin. After the 8 h treatment, mitotic cells were shaken-off, washed with PBS and released for 4 h into warm medium with 2 mM hydroxyurea (Sigma, Cat. No. H8627) and 25 µM
EdU (Invitrogen, Cat. No. A10044) to label DNA synthesis from prometaphase to early G1 phase. The cells were finally collected by trypsinization, fixed with 90% methanol overnight and
EdU-labeled DNA was isolated and sequenced as described in the main MiDAS protocol. LATE S PHASE DNA SYNTHESIS To map the genomic regions that replicate in late S phase, asynchronously
growing cells, at 70% confluency, were treated with 2 mM thymidine (Sigma-Aldrich, T1895) for 18 h, then washed four times with warm PBS and released for various time periods in warm medium
with or without low doses aphidicolin (0.4 µM) (Sigma-Aldrich, A0781) and with or without RO3306 (9 µM) (APExBio, A8885). EdU (25 µM) (Invitrogen, Cat. No. A10044) was added to the medium 30
min prior to harvesting and fixing the cells. The EdU-labeled DNA was then isolated and sequenced as described in the main MiDAS protocol. EUSEQ EU (5-Ethynyl-uridine; Jena Biosciences,
Cat. No. CLK-N002-10) was added to asynchronously growing U2OS, HeLa and HS68 cells for 30 min. The cells were then collected and RNA was extracted and purified using TRIzol (Invitrogen,
Cat. No. 15596) and isopropanol precipitation. EU-labeled RNA was attached to a cleavable biotin-azide linker (Azide-PEG(3 + 3)-S-S-biotin) (Jena Biosciences, Cat. No. CLK-A2112-10) using
the reagents of the Click-iT Nascent RNA Capture Kit (Invitrogen, Cat. No. C-10365) according to the manufacturer’s instructions. The purified RNA was heated at 70 °C and placed on ice to
remove secondary structures. EU-labeled RNA was then isolated using Dynabeads MyOne streptavidin C1 (Invitrogen, Cat. No. 65001) as described previously.53 The streptavidin beads were washed
three times with Binding and Washing Buffer 1× (5 mM Tris-HCl, pH 7.5, 0.5 mM EDTA, 1 M NaCl, 0.5% Tween-20) followed by two 2 min washes in Solution A (0.1 M NaOH, 0.05 M NaCl) and two
washes in Solution B (0.1 M NaCl). The beads were resuspended in twice their original volume with an equal volume of Binding and Washing Buffer 2× and the RNA. The mix was incubated for 30
min at room temperature with rotation and the beads were washed three times with Binding and Washing Buffer 1× and once with RNAse-free-water. The EU-labeled RNA was finally eluted by
incubating the streptavidin beads with 2% β-mercaptoethanol (Sigma, Cat. No. M6250) for 1 h at room temperature. Sequencing libraries were made by the Genomics Platform of the University of
Geneva using the TruSeq Stranded Total RNA with Ribo-Zero Gold (Illumina, Cat. No. RS-122-2301) omitting the ribo-depletion step. One hundred base pair single-end read sequencing reactions
were performed on an Illumina Hi-Seq 4000 sequencer. EDUSEQ IN RIF1-DEPLETED-CELLS U2OS-CE with normal levels of cyclin E were transfected with siRNAs targeting _RIF1_
(AAGAAUGAGCCCCUAGGGAAAdTdT)70 using the Amaxa® Cell Line Nucleofector® Kit V (Lonza) according to the manufacturer’s instructions. Two days later, nocodazole (Tocris, Cat. No. 1228) was
added to the cells at a concentration of 100 ng/mL for 8 h. Mitotic cells were shaken-off, washed with PBS and released into warm medium with 2 mM hydroxyurea (Sigma, Cat. No. H8627) and 25
µM EdU (Invitrogen Cat. No. A10044). The cells were collected 14 h later and fixed with 90% methanol overnight. EdU-labeled DNA was attached to a cleavable biotin linker (Azide-PEG(3 +
3)-S-S-biotin) (Jena Biosciences, Cat. No. CLK-A2112-10), isolated and subjected to high-throughput sequencing as described above. Sequencing libraries were made by the Genomics Platform of
the University of Geneva using the TruSeq ChIP Sample Prep Kit (Illumina, Cat. No. IP-202-1012). One hundred base pair single-end read sequencing reactions were then performed on an Illumina
Hi-Seq 2500 sequencer. SEQUENCING READ ALIGNMENT AND PROCESSING Sequencing reads were aligned and processed as described in detail previously.52 Briefly, the Burrows-Wheeler Aligner
software was used to align the reads on the masked human genome assembly (GRCh37/hg19) retaining only the reads with the highest quality score. Custom Perl scripts, all provided
previously,52 were then used to assign the aligned reads to 10 kb genomic bins; the data were normalized, sigma values were calculated and the data visualized, as described previously.52
IDENTIFICATION AND CLASSIFICATION OF MIDAS PEAKS A custom Perl script was used to identify genomic regions with sigma values that were significantly higher than the sigma values of the
background. Peak searching within these regions was then performed to identify the positions of the peaks and the number of peaks present in each genomic region. The genomic regions with
MiDAS signal were then classified as double-peak, merged-peak and single-peak, depending on the number of peaks present in each genomic region. The peaks were plotted using sigma values,
which takes into account systemic biases in high throughput sequencing data.52,53 These biases relate to some genomic regions being better substrates for NGS library preparation and to
differences in the extent to which highly repetitive sequences are present in various genomic bins. To correct for these biases, for each genomic bin we divided the number of EdUseq/EUseq
sequence reads by the number of reference reads for the same genomic bin (the reference was calculated from sequencing of genomic DNA from the same cell line, performed at very high
coverage). This gave the adjusted number of EdUseq/EUseq reads. We then calculated the standard deviation associated with each genomic bin. The sigma value is the adjusted number of
EdUseq/EUseq reads divided by its standard deviation. For plots of individual genomic regions, we presented the peak sigma values. For the plots showing averages of MiDAS peaks, we adjusted
the height of the peaks, so that each MiDAS peak contributed equally to the plot (to avoid a small number of very strong peaks dominating the average). Because each peak was scaled by a
different factor, it is not valid to calculate sigma values for the peak averages. DATA AVAILABILITY The fastq sequencing data and associated information described in this study have been
deposited in the Sequence Read Archive (SRA) as BioProject PRJNA588267. CODE AVAILABILITY Computer codes and data files used to process and plot the data are available from our previous
publications.52,53 Peak-finding scripts are available upon request. REFERENCES * Fragkos, M., Ganier, O., Coulombe, P. & Méchali, M. DNA replication origin activation in space and time.
_Nat. Rev. Mol. Cell Biol._ 16, 360–374 (2015). CAS Google Scholar * Zeman, M. K. & Cimprich, K. A. Causes and consequences of replication stress. _Nat. Cell Biol._ 16, 2–9 (2014). CAS
Google Scholar * Garcia-Muse, T. & Aguilera, A. Transcription-replication conflicts: how they occur and how they are resolved. _Nat. Rev. Mol. Cell Biol._ 17, 553–563 (2016). CAS
Google Scholar * Valton, A. L. & Prioleau, M. N. G-Quadruplexes in DNA replication: a problem or a necessity? _Trends Genet._ 32, 697–706 (2016). CAS Google Scholar * Gomez-Gonzalez,
B. & Aguilera, A. Transcription-mediated replication hindrance: a major driver of genome instability. _Genes Dev._ 33, 1008–1026 (2019). CAS Google Scholar * Glover, T. W., Berger, C.,
Coyle, J. & Echo, B. DNA polymerase alpha inhibition by aphidicolin induces gaps and breaks at common fragile sites in human chromosomes. _Hum. Genet._ 67, 136–142 (1984). CAS Google
Scholar * Durkin, S. G. & Glover, T. W. Chromosome fragile sites. _Annu. Rev. Genet._ 41, 169–192 (2007). CAS Google Scholar * Bhowmick, R. & Hickson, I. D. The “enemies within”:
regions of the genome that are inherently difficult to replicate. _F1000Res._ 12, 666 (2017). Google Scholar * Glover, T. W., Wilson, T. E. & Arlt, M. F. Fragile sites in cancer: more
than meets the eye. _Nat. Rev. Cancer_ 17, 489–501 (2017). CAS Google Scholar * Debatisse, M. & Rosselli, F. A journey with common fragile sites: From S phase to telophase. _Genes
Chrom. Cancer_ 58, 305–316 (2018). Google Scholar * Irony-Tur Sinai, M. & Kerem, B. Genomic instability in fragile sites-still adding the pieces. _Genes Chrom. Cancer_ 58, 295–304
(2018). Google Scholar * Macheret, M. & Halazonetis, T. D. DNA replication stress as a hallmark of cancer. _Annu. Rev. Pathol._ 10, 425–448 (2015). CAS Google Scholar * Wilson, T. E.
et al. Large transcription units unify copy number variants and common fragile sites arising under replication stress. _Genome Res._ 25, 189–200 (2015). CAS Google Scholar * Wilke, C. M.
et al. Multicolor FISH mapping of YAC clones in 3p14 and identification of a YAC spanning both FRA3B and the t(3;8) associated with hereditary renal cell carcinoma. _Genomics_ 22, 319–326
(1994). CAS Google Scholar * Paradee, W. et al. Precise localization of aphidicolin-induced breakpoints on the short arm of human chromosome 3. _Genomics_ 27, 358–361 (1995). CAS Google
Scholar * Boldog, F. et al. Chromosome 3p14 homozygous deletions and sequence analysis of FRA3B. _Hum. Mol. Genet._ 6, 193–203 (1997). CAS Google Scholar * Le Tallec, B. et al. Molecular
profiling of common fragile sites in human fibroblasts. _Nat. Struct. Mol. Biol._ 18, 1421–1423 (2011). Google Scholar * Mrasek, K. et al. BAC-probes applied for characterization of fragile
sites (FS). _Methods Mol. Biol._ 1227, 289–298 (2015). CAS Google Scholar * Smith, D. I., Zhu, Y., McAvoy, S. & Kuhn, R. Common fragile sites, extremely large genes, neural
development and cancer. _Cancer Lett._ 232, 48–57 (2005). Google Scholar * Le Tallec, B. et al. Common fragile site profiling in epithelial and erythroid cells reveals that most recurrent
cancer deletions lie in fragile sites hosting large genes. _Cell Rep._ 4, 420–428 (2013). Google Scholar * Le Beau, M. M. et al. Replication of a common fragile site, FRA3B, occurs late in
S phase and is delayed further upon induction: implications for the mechanism of fragile site induction. _Hum. Mol. Genet._ 7, 755–761 (1998). Google Scholar * Brison, O. et al.
Transcription-mediated organization of the replication initiation program across large genes sets common fragile sites genome-wide. _Nat. Commun._ 10, 5693 (2019). CAS Google Scholar *
Sarni, D. et al. Replication timing and transcription identifies a novel fragility signature under replication stress. _bioRxiv_ https://www.biorxiv.org/content/10.1101/716951v2 (2019). *
Letessier, A. et al. Cell-type-specific replication initiation programs set fragility of the FRA3B fragile site. _Nature_ 470, 120–123 (2011). CAS Google Scholar * Ozeri-Galai, E. et al.
Failure of origin activation in response to fork stalling leads to chromosomal instability at fragile sites. _Mol. Cell_ 43, 122–131 (2011). CAS Google Scholar * Debatisse, M., Le Tallec,
B., Letessier, A., Dutrillaux, B. & Brison, O. Common fragile sites: mechanisms of instability revisited. _Trends Genet._ 28, 22–32 (2012). CAS Google Scholar * Georgakilas, A. G. et
al. Are common fragile sites merely structural domains or highly organized “functional” units susceptible to oncogenic stress? _Cell. Mol. Life Sci._ 71, 4519–4544 (2014). CAS Google
Scholar * Le Tallec, B. et al. Updating the mechanisms of common fragile site instability: how to reconcile the different views? _Cell Mol. Life Sci._ 71, 4489–4494 (2014). Google Scholar
* Sarni, D. & Kerem, B. The complex nature of fragile site plasticity and its importance in cancer. _Curr. Opin. Cell Biol._ 40, 131–136 (2016). CAS Google Scholar * Murano, I.,
Kuwano, A. & Kajii, T. Fibroblast-specific common fragile sites induced by aphidicolin. _Hum. Genet._ 83, 45–48 (1989). CAS Google Scholar * Murano, I., Kuwano, A. & Kajii, T. Cell
type-dependent difference in the distribution and frequency of aphidicolin-induced fragile sites: T and B lymphocytes and bone marrow cells. _Hum. Genet._ 84, 71–74 (1989). CAS Google
Scholar * Toledo, F., Coquelle, A., Svetlova, E. & Debatisse, M. Enhanced flexibility and aphidicolin-induced DNA breaks near mammalian replication origins: implications for replicon
mapping and chromosome fragility. _Nucleic Acids Res._ 28, 4805–4813 (2000). CAS Google Scholar * Zlotorynski, E. et al. Molecular basis for expression of common and rare fragile sites.
_Mol. Cell Biol._ 23, 7143–7151 (2003). CAS Google Scholar * Zhang, H. & Freudenreich, C. H. An AT-rich sequence in human common fragile site FRA16D causes fork stalling and chromosome
breakage in _S. cerevisiae_. _Mol. Cell_ 27, 367–379 (2007). Google Scholar * Irony-Tur Sinai, M. et al. AT-dinucleotide rich sequences drive fragile site formation. _Nucleic Acids Res._
47, 9685–9695 (2019). Google Scholar * Kaushal, S. & Freudenreich, C. H. The role of fork stalling and DNA structures in causing chromosome fragility. _Genes Chrom. Cancer_ 58, 270–283
(2019). CAS Google Scholar * Minocherhomji, S. et al. Replication stress activates DNA repair synthesis in mitosis. _Nature_ 528, 286–290 (2015). CAS Google Scholar * Chan, K. L.,
Palmai-Pallag, T., Ying, S. & Hickson, I. D. Replication stress induces sister-chromatid bridging at fragile site loci in mitosis. _Nat. Cell Biol._ 11, 753–760 (2009). CAS Google
Scholar * Okamoto, Y. et al. Replication stress induces accumulation of FANCD2 at central region of large fragile genes. _Nucleic Acids Res._ 46, 2932–2944 (2018). CAS Google Scholar *
Llorente, B., Smith, C. E. & Symington, L. S. Break-induced replication: what is it and what is it for? _Cell Cycle_ 7, 859–864 (2008). CAS Google Scholar * Costantino, L. et al.
Break-induced replication repair of damaged forks induces genomic duplications in human cells. _Science_ 343, 88–91 (2014). CAS Google Scholar * Kramara, J., Osia, B. & Malkova, A.
Break-Induced Replication: The Where, The Why, And The How. _Trends Genet._ 34, 518–531 (2018). CAS Google Scholar * Lydeard, J. R., Jain, S., Yamaguchi, M. & Haber, J. E.
Break-induced replication and telomerase-independent telomere maintenance require Pol32. _Nature_ 448, 820–823 (2007). CAS Google Scholar * Bhowmick, R., Minocherhomji, S. & Hickson,
I. D. RAD52 facilitates mitotic DNA synthesis following replication stress. _Mol. Cell_ 64, 1117–1126 (2016). CAS Google Scholar * Sotiriou, S. K. et al. Mammalian RAD52 functions in
break-induced replication repair of collapsed DNA replication forks. _Mol. Cell_ 64, 1127–1134 (2016). CAS Google Scholar * Graber-Fees, C. L., Pederson, K. D., Aney, K. J. & Shima, N.
Mitotic DNA synthesis is differentially regulated between cancer and noncancerous cells. _Mol. Cancer Res._ 17, 1687–1698 (2019). Google Scholar * Verma, P. et al. RAD52 and SLX4 act
nonepistatically to ensure telomere stability during alternative telomere lengthening. _Genes Dev._ 33, 221–235 (2019). CAS Google Scholar * Zhang, J. M., Yadav, T., Ouyang, J., Lan, L.
& Zou, L. Alternative lengthening of telomeres through two distinct break-induced replication pathways. _Cell Rep._ 26, 955–968 (2019). CAS Google Scholar * Donnianni, R. A. &
Symington, L. S. Break-induced replication occurs by conservative DNA synthesis. _Proc. Natl. Acad. Sci. USA_ 110, 13475–13480 (2013). CAS Google Scholar * Saini, N. et al. Migrating
bubble during break-induced replication drives conservative DNA synthesis. _Nature_ 502, 389–392 (2013). CAS Google Scholar * Roumelioti, F. M. et al. Alternative lengthening of human
telomeres is a conservative DNA replication process with features of break-induced replication. _EMBO Rep._ 17, 1731–1737 (2016). CAS Google Scholar * Macheret, M. & Halazonetis, T. D.
Monitoring early S-phase origin firing and replication fork movement by sequencing nascent DNA from synchronized cells. _Nat. Protoc._ 14, 51–67 (2019). CAS Google Scholar * Macheret, M.
& Halazonetis, T. D. Intragenic origins due to short G1 phases underlie oncogene-induced DNA replication stress. _Nature_ 555, 112–116 (2018). CAS Google Scholar * Cornacchia, D. et
al. Mouse Rif1 is a key regulator of the replication-timing programme in mammalian cells. _EMBO J._ 31, 3678–3690 (2012). CAS Google Scholar * Hayano, M. et al. Rif1 is a global regulator
of timing of replication origin firing in fission yeast. _Genes Dev._ 26, 137–150 (2012). CAS Google Scholar * Yamazaki, S. et al. Rif1 regulates the replication timing domains on the
human genome. _EMBO J._ 31, 3667–3677 (2012). CAS Google Scholar * Bartkova, J. et al. DNA damage response as a candidate anti-cancer barrier in early human tumorigenesis. _Nature_ 434,
864–870 (2005). CAS Google Scholar * Gorgoulis, V. G. et al. Activation of the DNA damage checkpoint and genomic instability in human precancerous lesions. _Nature_ 434, 907–913 (2005).
CAS Google Scholar * Tsantoulis, P. K. et al. Oncogene-induced replication stress preferentially targets common fragile sites in preneoplastic lesions. A genome-wide study. _Oncogene_ 27,
3256–3264 (2007). Google Scholar * Bignell, G. R. et al. Signatures of mutation and selection in the cancer genome. _Nature_ 463, 893–898 (2010). CAS Google Scholar * Zack, T. I. et al.
Pan-cancer patterns of somatic copy number alteration. _Nat. Genet._ 45, 1134–1140 (2013). CAS Google Scholar * Miron, K., Golan-Lev, T., Dvir, R., Ben-David, E. & Kerem, B. Oncogenes
create a unique landscape of fragile sites. _Nat. Commun._ 6, 7094 (2015). CAS Google Scholar * Deng, L. et al. Mitotic CDK promotes replisome disassembly, fork breakage, and complex DNA
rearrangements. _Mol. Cell_ 73, 915–929 (2019). CAS Google Scholar * Dilley, R. L. et al. Break-induced telomere synthesis underlies alternative telomere maintenance. _Nature_ 539, 54–58
(2016). CAS Google Scholar * Min, J., Wright, W. E. & Shay, J. W. Alternative lengthening of telomeres mediated by mitotic DNA synthesis engages break-induced replication processes.
_Mol. Cell. Biol._ 37, e00226–17 (2017). CAS Google Scholar * Zhang, J., Dai, Q., Park, D. & Deng, X. Targeting DNA replication stress for cancer therapy. _Genes_ 7, 51 (2016). Google
Scholar * Rundle, S., Bradbury, A., Drew, Y. & Curtin, N. J. Targeting the ATR-CHK1 axis in cancer therapy. _Cancers_ 9, 41 (2017). Google Scholar * Lecona, E. &
Fernandez-Capetillo, O. Targeting ATR in cancer. _Nat. Rev. Cancer_ 18, 586–595 (2018). CAS Google Scholar * Ji, F. et al. Genome-wide high-resolution mapping of mitotic DNA synthesis
sites and common fragile sites by direct sequencing. _Cell Res._ https://doi.org/10.1038/s41422-020-0357-y (2020). * Silverman, J., Takai, H., Buonomo, S. B., Eisenhaber, F. & de Lange,
T. Human Rif1, ortholog of a yeast telomeric protein, is regulated by ATM and 53BP1 and functions in the S-phase checkpoint. _Genes Dev._ 18, 2108–2119 (2004). CAS Google Scholar Download
references ACKNOWLEDGEMENTS We thank Vasilis Dionellis for help with the data analysis. This study was supported by grants from the Swiss National Science Foundation (160734) to T.D.H. and
from the Danish National Research Foundation (DNRF115), the Nordea Foundation, and the Novo Nordisk Foundation to I.D.H. AUTHOR INFORMATION Author notes * These authors contributed equally:
Morgane Macheret, Rahul Bhowmick, Katarzyna Sobkowiak AUTHORS AND AFFILIATIONS * Department of Molecular Biology, University of Geneva, 1205, Geneva, Switzerland Morgane Macheret, Katarzyna
Sobkowiak, Laura Padayachy, Jonathan Mailler & Thanos D. Halazonetis * Center for Chromosome Stability and Center for Healthy Aging, Department of Cellular and Molecular Medicine,
University of Copenhagen, Blegdamsvej 3B, 2200, Copenhagen N, Denmark Rahul Bhowmick & Ian D. Hickson Authors * Morgane Macheret View author publications You can also search for this
author inPubMed Google Scholar * Rahul Bhowmick View author publications You can also search for this author inPubMed Google Scholar * Katarzyna Sobkowiak View author publications You can
also search for this author inPubMed Google Scholar * Laura Padayachy View author publications You can also search for this author inPubMed Google Scholar * Jonathan Mailler View author
publications You can also search for this author inPubMed Google Scholar * Ian D. Hickson View author publications You can also search for this author inPubMed Google Scholar * Thanos D.
Halazonetis View author publications You can also search for this author inPubMed Google Scholar CONTRIBUTIONS I.D.H. and T.D.H. conceived the study and supervised the project. M.M., R.B.,
K.S., L.P. and J.M. performed the experiments and analyzed data. M.M. and T.D.H. performed the bioinformatics analysis. T.D.H. wrote the computer scripts. All authors contributed to writing
and editing the manuscript. CORRESPONDING AUTHORS Correspondence to Ian D. Hickson or Thanos D. Halazonetis. ETHICS DECLARATIONS COMPETING INTERESTS The authors declare no competing
interests. SUPPLEMENTARY INFORMATION SUPPLEMENTARY FIGURE S1 SUPPLEMENTARY FIGURE S2 SUPPLEMENTARY FIGURE S3 SUPPLEMENTARY FIGURE S4 SUPPLEMENTARY FIGURE S5 SUPPLEMENTARY FIGURE S6
SUPPLEMENTARY FIGURE S7 SUPPLEMENTARY FIGURE S8 SUPPLEMENTARY TABLE S1 RIGHTS AND PERMISSIONS OPEN ACCESS This article is licensed under a Creative Commons Attribution 4.0 International
License, which permits use, sharing, adaptation, distribution and reproduction in any medium or format, as long as you give appropriate credit to the original author(s) and the source,
provide a link to the Creative Commons license, and indicate if changes were made. The images or other third party material in this article are included in the article’s Creative Commons
license, unless indicated otherwise in a credit line to the material. If material is not included in the article’s Creative Commons license and your intended use is not permitted by
statutory regulation or exceeds the permitted use, you will need to obtain permission directly from the copyright holder. To view a copy of this license, visit
http://creativecommons.org/licenses/by/4.0/. Reprints and permissions ABOUT THIS ARTICLE CITE THIS ARTICLE Macheret, M., Bhowmick, R., Sobkowiak, K. _et al._ High-resolution mapping of
mitotic DNA synthesis regions and common fragile sites in the human genome through direct sequencing. _Cell Res_ 30, 997–1008 (2020). https://doi.org/10.1038/s41422-020-0358-x Download
citation * Received: 09 January 2020 * Accepted: 31 May 2020 * Published: 19 June 2020 * Issue Date: November 2020 * DOI: https://doi.org/10.1038/s41422-020-0358-x SHARE THIS ARTICLE Anyone
you share the following link with will be able to read this content: Get shareable link Sorry, a shareable link is not currently available for this article. Copy to clipboard Provided by the
Springer Nature SharedIt content-sharing initiative


:max_bytes(150000):strip_icc():focal(999x0:1001x2)/ryan-gosling1-1-4076df19b3d644fba89933785f91bb6a.jpg)