- Select a language for the TTS:
- UK English Female
- UK English Male
- US English Female
- US English Male
- Australian Female
- Australian Male
- Language selected: (auto detect) - EN
Play all audios:
ABSTRACT OBJECTIVE To assess whether the role of selenium on pre-diabetes is differential by age, given comorbidities and decreased β-cell function in older adults. RESEARCH DESIGN AND
METHODS We evaluated the cross-sectional association of blood selenium with the homeostatic model assessment for insulin resistance (HOMA-IR) and β-cell function (HOMA-β) in middle-aged
(Aragon Workers Health Study [AWHS], _N_ = 1186), and older (Seniors ENRICA [Study on Nutrition and Cardiovascular Risk in Spain]-2 [SEN-2], _N_ = 915) diabetes-free adults. A subsample of
participants from AWHS (_N_ = 571) and SEN-2 (_N_ = 603) had glucose and insulin repeated measurements for longitudinal analysis. We validated the cross-sectional dose–response associations
in the 2011–2018 National Health and Nutrition Examination Survey (NHANES, _N_ = 1317 middle age and _N_ = 960 older) participants. Selenium was measured in whole blood with ICP-MS in AWHS,
SEN-2 and NHANES. RESULTS The cross-sectional geometric mean ratios (95% confidence intervals) per two-fold selenium increase were 1.09 (1.01, 1.19) for HOMA-IR and 1.15 (1.06, 1.24) for
HOMA-β in AWHS; and 1.13 (0.98, 1.31) and 1.03 (0.90, 1.18), in SEN-2. The cross-sectional dose-response associations were consistent in NHANES, with mostly increasingly positive trends for
both HOMA endpoints in younger adults and a plateau at levels >~150 μg/L in older adults. The longitudinal dose–response consistently showed positive associations at high selenium dose
for both HOMA endpoints in the younger, but not the older, study population. CONCLUSIONS Increased blood selenium was associated with increased insulin resistance and β-cell function in
middle-aged, but not in older individuals, especially for β-cell function. The results suggest that selenium-associated insulin resistance might induce compensatory increased β-cell function
at younger ages, being this compensatory capacity decreased with aging. SIMILAR CONTENT BEING VIEWED BY OTHERS EXPLORING THE POTENTIAL ASSOCIATION BETWEEN SERUM SELENIUM AND HYPERTENSION IN
OBESE ADULT MALES IN THE UNITED STATES Article Open access 08 January 2025 ASSOCIATION BETWEEN DIETARY SELENIUM INTAKE AND THE RISK OF CARDIOVASCULAR DISEASE IN US ADULTS: A
POPULATION-BASED STUDY Article Open access 18 April 2025 EFFECTS OF SELENIUM ON CORONARY ARTERY DISEASE, TYPE 2 DIABETES AND THEIR RISK FACTORS: A MENDELIAN RANDOMIZATION STUDY Article 07
April 2021 INTRODUCTION Type 2 diabetes mellitus is recognized as an important public health problem with an enormous impact on society [1]. The etiopathogenic mechanisms of diabetes involve
insulin resistance and β-cell dysfunction, which commonly precede diabetes onset [2]. One of the main contributing factors for insulin resistance development is oxidative stress [3], which
can impair insulin sensitivity, induce β-cell dysfunction and alter inflammatory response and insulin signaling pathways [4]. Selenium is an essential micronutrient, which is a component of
selenocysteine-containing proteins (i.e., selenoproteins) with a key role in redox homeostasis, such as glutathione peroxidase (GPx) or selenoprotein P [5, 6]. Early experimental [7, 8] and
epidemiological studies [9, 10] suggested a link between low selenium levels and higher risk of type 2 diabetes. Alternatively, a recent meta-analysis of observational and experimental
studies has shown that high selenium was associated with incident and prevalent type 2 diabetes [11]. Thus, the accumulated evidence suggests that both selenium deficiency and excess are
detrimental to glucose metabolism. However, associations between selenium and insulin resistance and β-cell dysfunction have rarely been investigated in epidemiologic studies. Recently, a
cross-sectional analysis of the National Health and Nutrition Examination Survey (NHANES) showed that blood selenium concentration was positively and linearly associated with insulin
resistance [12]. However, longitudinal studies are needed. Also, it is unknown if this association differs by age, which is a relevant question because comorbidities at an older age are
frequently associated with selenium-demanding biological processes [13] and because β-cell function decreases with age [14]. We evaluated the cross-sectional association of selenium exposure
as measured in whole blood with insulin resistance and β-cell function, estimated using the homeostasis model assessment for insulin resistance (HOMA-IR) and for β-cell function (HOMA-β, %)
indexes, respectively [15]. We used data from diabetes-free middle-aged and older adults who participated in the Aragon Workers Health Study (AWHS) and the Senior Seniors-ENRICA-2 study
(SEN-2), respectively, as well as participants from similar age subgroups in the 2011–2018 NHANES for replication of cross-sectional findings. We also tested the longitudinal dose–responses
in a subsample of AWHS and SEN-2 participants with repeated HOMA measurements over time. The present work helps to characterize potential differential influences of selenium in the
development of type 2 diabetes with aging. METHODS STUDY POPULATIONS The AWHS (mean age 52 years) is a longitudinal cohort study based on the annual health exams of 5678 workers (93% men) of
an Opel car assembly plant in Figueruelas (Zaragoza, Spain), which aims to characterize factors associated with metabolic abnormalities and subclinical atherosclerosis. The study design and
data collection methods have been previously published [16]. Briefly, study participants were recruited during a standardized clinical exam between 2009 and 2010 (the participation rate was
95.6%). Among them, 2678 participants who were 40–55 years old in 2011 and attended yearly occupational health visits were randomly included in the atherosclerosis-imaging sub-cohort
conducted in the 2011–2014 examination visit. A total of 1380 (out of 2678) participants who had available blood for selenium determinations collected in the 2011–2014 visit (baseline for
the present analysis), were selected for this study. We excluded participants missing information on education, body mass index (BMI), or plasma insulin levels (_N_ = 113), as well as
participants with diabetes (_N_ = 81, standard definition of fasting serum glucose >126 mg/dL, glycated hemoglobin > 6.5%, or glucose-lowering medication use). Finally, a total of 1186
AWHS participants were included in the cross-sectional analyses. A subset of 571 participants had repeated measurements of plasma insulin and glucose levels from yearly occupational health
check-ups (median follow-up [interquartile range] = 12.0 [10.5, 13.3] months), which made up the study population for longitudinal analysis. The study was approved by the Central
Institutional Review Board of Aragon (CEICA). All study participants provided written informed consent. In the SEN-2 cohort (mean age 70 years) [17], the baseline examination was conducted
between 2015 and 2017. In total, 3273 individuals were selected by sex- and district-stratified random sampling of all community-dwelling individuals aged ≥65 years holding a national
healthcare card and living in the Madrid Region (Spain). Information regarding socio-demographics, lifestyle, self-rated health, and morbidity was collected using a computer-assisted
telephone interview. Trained staff performed two home visits where a physical examination, a diet history, and biological samples were obtained. A total of 1124 (out of 3273) participants
who had blood selenium, insulin, and glucose determinations at baseline were included in the analyses. From these, we excluded participants with diabetes (_N_ = 209), leaving a total of 915
SEN-2 participants for the cross-sectional analyses. A subset of 603 participants who had a second measure for plasma insulin and glucose (25.4 [24.2, 27.1] months of follow-up) was selected
for the longitudinal analysis. All participants provided written informed consent. The SEN-2 study was approved by the Clinical Research Ethics Committee of La Paz University Hospital in
Madrid. In addition, we used the 2011–2018 NHANES data for replication of cross-sectional findings. Detailed information on the NHANES study population and methods is available in the
Supplemental Material, Supplemental Methods. All study participants provided written informed consent. All methods were performed in accordance with the relevant guidelines and regulations
for Ethics in biomedical research. BLOOD SELENIUM LEVELS In AWHS, blood selenium levels were measured using inductively coupled plasma mass spectrometry (ICP-MS) with dynamic reaction cell
on an Agilent 7500ce ICP-MS at the Environmental Bioanalytical Chemistry Laboratory of the University of Huelva (Spain). In SEN-2, blood selenium was measured using ICP-MS (Agilent 8900
ICP-QQQ) at the Department of Legal Medicine, Toxicology, and Physical Anthropology, School of Medicine, University of Granada (Spain). Both laboratories used standardized protocols, which
include the instrument tunning and performance parameters checks prior to analysis, the use of calibration standards with several dilutions, and the addition of internal standards to the
samples and the calibration standards. Furthermore, a suitable certified reference material for whole blood was reanalyzed together with a blank and an intermediate calibration standard
every 12 samples to ensure the accuracy of the analysis. National Institute of Standards and Technology NIST (USA) Trace Elements in Natural Water Standard Reference Material SRM 1640a was
also used as certified reference material and analyzed at the beginning and at the end of each sequence. Additionally, one in every 12 samples was reanalyzed at the end of each session to
check the precision of the analysis. The selenium determination methods used in this study have been successfully applied before [17, 18]. The limits of detection for blood selenium were
0.5, and 0.3 μg/L for AWHS and SEN-2, respectively. No samples had concentrations below the corresponding limits. The inter-assay coefficient of variation for selenium levels were 5.0 and
5.2% for AWHS and SEN-2, respectively. HOMA-IR AND HOMA-Β OUTCOMES Fasting serum glucose (mg/dL) and insulin (µU/mL) were measured by spectrophotometry (Chemical Analyzer ILAB 650) with the
manufacturer Instrumentation Laboratory kit and by double sandwich immunoassay in frozen samples in an Access 2 Analyzer (Beckman Coulter, Inc., Fullerton, CA) using the manufacturer
ultrasensitive kit, respectively, in AWHS and by colourimetric enzymatic methods using Atellica Solution® (Siemens Healthineers) and immunoradiometric assay, respectively, in SEN-2. To
better evaluate potential differences in the association of selenium with HOMA outcomes by age, irrespective of the different laboratory techniques used in AWHS and SEN-2 for glucose and
insulin determinations, we applied regression-based recalibration methods to serum glucose and insulin measurements in both discovery study populations using the NHANES 2011–2018 population
as reference. Details of the NHANES study population and information, including the laboratory as well as recalibration methods, are provided in the Supplemental Material (Supplemental
Methods and Supplemental Tables S1, S2, and S3). The homeostatic model assessment for insulin resistance (HOMA-IR, unitless) and β-cell function (HOMA-β, %), which determine insulin
secretion, were estimated using the standard formulas glucose * insulin/405 for HOMA-IR, and 360 * insulin/(glucose – 63) for HOMA-β [15]. Higher values of HOMA-IR indicate greater insulin
resistance, while lower values of HOMA-β indicate worse β-cell function. For longitudinal analyses, we calculated the annual relative change in HOMA-IR and HOMA-β for each participant as the
ratio of follow-up to baseline values, raised to the inverse of the follow-up time in years. OTHER VARIABLES Information on age, sex, education, smoking status (never, former, or current),
and medication use was collected from examination visits and interviews. For the AWHS, anthropometric and biochemical measurements (height and weight), were certified with the International
Organization for Standardization standard ISO 9001:2008. For SEN-2 weight and height were measured twice on each subject using electronic scales (model Seca 841, precision to 0.1 kg),
portable extendable stadiometers (model Ka We 44 444Seca) [19]. BMI was calculated as the weight in kilograms divided by the square of height in meters. Serum total and high-density
lipoprotein (HDL) cholesterol was measured by spectrophotometry (Chemical Analyzer ILAB 650, Instrumentation Laboratory) in AWHS, and by colorimetric enzymatic methods using Atellica
Solution® (Siemens Healthineers) in SEN-2. Physical activity for AWHS and SEN-2 (measured as Metabolic Equivalent of Task [MET]-minute/week) was assessed using the validated Spanish version
[20] of the questionnaire on the frequency of engaging in physical activity from the Nurses’ Health Study [21] and the Health Professionals Follow-up Study [22]. To estimate the volume of
activity performed by each participant, a metabolic cost was assigned to each activity using Ainsworth’s compendium for physical activities [23], and multiplied by the time the participant
reported practicing that activity. From the sum of all activities, we obtained a value of overall weekly METs-hour. Waist circumference in cm was determined from physical exams in AWHS by
using the tape measure model Gulick 2. For SEN-2, waist circumference was measured twice on each subject in standardized conditions by using flexible, inelastic belt-type tapes [19]. For
AWHS, systolic blood pressure (mmHg) was measured three times consecutive using an automatic oscillometric sphygmomanometer OMRON M10-IT (OMRON Healthcare Co. Ltd., Japan) with the
participant sitting after 5-min rest. While for SEN-2 was obtained thrice (1–2 min intervals) by trained personnel using the OMRON M6 model. Blood-pressure-lowering medication was collected
from questionaries in both studies. C-reactive protein concentration was measured by turbidimetric immunoassay in a Beckman Coulter Image Analyzer using the manufacturer’s high-sensitivity
kit in AWHS and by latex-enhanced nephelometry in SEN-2. STATISTICAL ANALYSIS Statistical analyses were identically conducted in all the study populations. Geometric mean and 95% confidence
intervals (CIs) of blood selenium levels, HOMA-IR, and HOMA-β at baseline were reported by participant characteristics. In cross-sectional analyses, we estimated the geometric mean ratios
(GMRs) and 95% CIs of baseline HOMA-IR and HOMA-β, per two-fold increase in baseline selenium levels, as well as _P_ values for linear trends, from linear regression models of
log-transformed HOMA outcomes on log2-transformed blood selenium levels. Selenium was also modeled as tertile categories to compare the two highest with the lowest tertile of selenium
distribution. To assess non-linear dose-response relationships, we used restricted cubic splines of log2-transformed selenium levels with knots at the 10th, 50th, and 90th percentiles of
selenium distribution. The reference blood selenium value was set at 165 µg/L, since GPx activity is known to reach a plateau at serum selenium levels above 110 µg/L and serum selenium
represents approximately two-thirds of blood selenium (median [interquartile range] of serum to blood selenium ratio in a subsample of our NHANES sample with available serum selenium was
66.7 [62.7, 71.6] %). The cross-sectional dose–response was replicated in NHANES, which incorporated the complex sampling design and weights with the _survey_ package in R [24]. All models
were adjusted for age (years), sex (male or female), education (≤high school or >high school), smoking status (never, former, or current), BMI (kg/m2), serum total cholesterol (mg/dL) and
HDL cholesterol (mg/dL). In longitudinal dose-response analyses, we estimated the GMRs and 95% CIs of annual relative changes in HOMA-IR and HOMA-β as a smooth function of baseline selenium
levels from regression models of log-transformed annual relative changes on restricted cubic splines of log-transformed selenium levels with the same knots described above. Adjustments in
longitudinal models for HOMA-IR and HOMA-β annual change were similar to the cross-sectional analysis, except for further adjustment for corresponding baseline HOMA-IR and HOMA-β values. We
performed a regression residual check with no clear departure from the linear regression assumptions. We also evaluated the model variance inflation factor supporting that inflation was not
a problem for the selenium regression coefficient. Finally, we conducted the Woolf heterogeneity test to compare the geometric mean ratios for HOMA-IR and HOMA-β per two-fold increase in
baseline selenium levels, respectively, between the two independent studies, AWHS and SEN-2. _Sensitivity analyses_. As glucose and insulin were measured with different laboratory techniques
in AWHS and SEN-2, we applied recalibration methods to serum glucose and insulin measurements, using NHANES population as a common reference (i.e., external population), to make these
measurements comparable between both studies (see Supplemental Methods). To assess the consistency of findings and the robustness of the results after the recalibration process, we performed
sensitivity analyses using HOMA endpoints based on originally measured (i.e., non-recalibrated to NHANES) serum glucose and insulin levels. Physical activity, waist circumference, and
inflammation have been proposed as risk factors for diabetes [25, 26]. Elevated blood pressure is frequently associated with other cardiometabolic potential confounders. We, thus, conducted
sensitivity analyses with separate additional adjustments for physical activity, waist circumference, systolic blood pressure and blood-pressure-lowering medication, C-reactive protein, and
alcohol consumption (log2-transformed g/day). In addition, considering that seafood represents one of the most abundant dietary sources of selenium [27, 28], and given that mercury
(typically present in seafood) may confound the association of selenium with diabetes [29], we performed a dose–response analysis on age-stratified NHANES groups, with further adjustments
for mercury. RESULTS PARTICIPANT CHARACTERISTICS The median age in the AWHS and SEN-2 studies was 51.9 (range 42–56) and 70.0 (range 64–82) years, respectively. The proportion of men was
much higher in AWHS (~95%) than in SEN-2 and NHANES (~50%) (Table 1 and Supplemental Tables S4 and S5). Geometric means (GMs) for blood selenium were 141.6 and 116.8 μg/L in AWHS and SEN-2,
respectively (Table 1). For HOMA-IR, the GMs were 1.9 and 2.0 in AWHS and SEN-2, respectively, and for HOMA-β were 71.1% and 73.4%, respectively (Table 1). Descriptive results for original
(non-calibrated) HOMA endpoint levels are shown in Supplemental Table S4. HOMA-IR and HOMA-β were higher in participants with BMI ≥ 30 kg/m2 and low HDL cholesterol in AWHS and SEN-2 (Table
1). In age-stratified NHANES replication populations, the median age was 48.8 years for middle age (range 40–59) and 69.3 years (range 60–80) for older participants. Descriptive information
for age-stratified NHANES is shown in the Supplemental Material (Supplemental Table S5). ASSOCIATION OF SELENIUM WITH HOMA-IR AND HOMA-Β IN MIDDLE-AGED AND OLDER ADULTS In cross-sectional
association analysis, the GMRs (95% CIs) of HOMA-IR levels by doubling blood levels of selenium were 1.09 (1.01, 1.19) in AWHS and 1.13 (0.98, 1.31) in SEN-2. The corresponding GMRs (95%
CIs) of HOMA- β levels were 1.15 (1.06, 1.24) in AWHS and 1.03 (0.90, 1.18) in SEN-2 (Table 2). In evaluations of the cross-sectional dose-response, baseline blood selenium levels were
mostly positively and monotonically associated with baseline HOMA-IR and HOMA-β among middle-aged participants (AWHS and NHANES participants aged < 60 years) (Supplemental Fig. S1). In
older ages (SEN-2 and NHANES participants aged ≥ 60 years), we observed a positive association between higher selenium levels and an increased in HOMA-IR, becoming flat at higher exposure
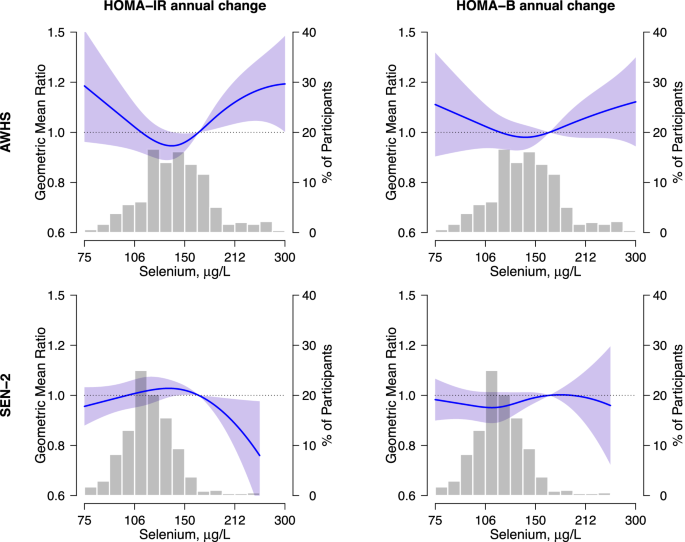
doses. However, selenium was not associated with HOMA-β (Supplemental Fig. S2). For the longitudinal analysis, the dose response showed non-linear associations between blood selenium levels
and HOMA endpoints in AWHS, in which the association was positive above 150 μg/L of blood selenium (Fig. 1). In SEN-2, the corresponding association was not positive for HOMA-IR, and null
for HOMA- β (Fig. 1). The Woolf heterogeneity _P_-value across middle-aged and older study populations was 0.53 for HOMA-IR and 0.05 for HOMA-β models (data not shown). SENSITIVITY ANALYSIS
In sensitivity analysis of non-standardized HOMA-IR and HOMA-β measures, the results were consistent with those obtained using the recalibrated HOMA values (Supplemental Table S6). The
findings remained basically unchanged after separately adding other adjustment variables (physical activity, blood pressure variables, C-reactive protein, and alcohol intake) into the
adjustment models (data not shown), except for the HOMA-IR models in the SEN-2 study [GMRs (95% CI) for two-fold increase in blood selenium was 1.17 (1.02, 1.35)] after including waist
circumference as a covariate (Supplemental Table S7). In NHANES, additional adjustments for blood mercury and race did not substantially change the shape of the dose–responses (data not
shown). DISCUSSION Increasing blood selenium levels were cross-sectionally associated with increased HOMA-IR and HOMA-β in middle-aged adults. In older adults, we observed a similar, but not
so strong, positive linear trend, for HOMA-IR, but not for HOMA-β, which in flexible dose–responses stabilized at the highest selenium range. While the levels of selenium exposure in our
study populations (AWHS and SEN-2) were different compared to those observed in the replication study population (NHANES), possibly due to differences in selenium soil content and
supplementation intake, we observed fairly consistent findings. The longitudinal analysis showed a non-linear dose–response, with positive associations for both HOMA endpoints at blood
selenium levels above ~150 μg/l in AWHS but not in SEN-2. In this study, blood selenium levels in both Spanish populations were substantially lower than those in the United States general
population. Selenium-containing supplements have gained popularity and easy accessibility to consumers, especially in the United States, despite a dearth of evidence supporting their
effectiveness in preventing disease [30]. Although in NHANES, we only include those participants without dietary supplement intake, we cannot rule out potential miss-classification bias
because the information on supplement intake was self-reported. In the Spanish study populations, we observed that middle-aged participants in AWHS have higher blood selenium levels
(geometric mean 141.60 µg/L) compared to older SEN-2 participants (geometric mean 116.78 µg/L). Selenium status was reported to decrease in an age-dependent manner, supporting that selenium
requirements increase with age [31, 32]. The necessary intake of dietary selenium to maintain biological functions is understood to depend on selenium-demanding situations, which are more
common at older ages [22, 33]. Also, omics approaches applied to animal models have detected changes in genetic expression and proteomics associated with selenium status in pathways linked
to aging and age-related illnesses [31, 34]. However, we cannot completely discard that the observed differences between blood selenium concentrations in both Spanish populations are partly
due to factors beyond exposure such as potential differences in laboratory methods. Epidemiological studies of selenium-related diabetes display, generally, controversial results. A
meta-analysis of 12 randomized controlled trials found a null association between selenium supplementation and HOMA-IR [35]. Contrary to our results, in 2420 participants without diabetes
from the CODING study (Newfoundland population, mean age 42), selenium intake was negatively correlated with HOMA-IR [36]. However, this correlation was attenuated and no longer
statistically significant with selenium intake above 1.6 μg/kg/day [36]. Nevertheless, the comparison with our results is not clear because the CODING study used a food frequency
questionnaire to evaluate selenium exposure, not biomarkers. On the contrary, in a case-control study from Taiwan (_N_ = 1165, mean serum selenium and age were 96.34 μg/L and 65 years,
respectively) and in a cross-sectional analysis in NHANES 2013–2018 (mean age 47.7), the authors reported a positive association between serum selenium levels and HOMA-IR [12, 37], both in
men and women. Furthermore, a recent Mendelian randomization analysis of genetically predicted selenium with measured fasting insulin and HOMA-IR was also consistent [38]. Nonetheless,
unlike our study, the possible differential association by age and potentially non-linear dose–response was not evaluated in previous studies. At the highest selenium range, the positive
association of blood selenium with insulin resistance is supported by experimental studies that point to a role of redox unbalance in the dysregulation of glucose homeostasis [3, 39, 40].
Selenium, as a component of antioxidant proteins, such as glutathione peroxidase (GPx), contributes to the reduction of reactive oxygen species (ROS) [41]. However, selenium excess can
induce selenoprotein saturation and unspecific bounding of selenium to circulating proteins, possibly leading to a pro-oxidant effect, and insulin resistance [39]. In the Hortega Study, a
Spanish study population, plasma selenium levels above 110 µg/L were associated with GPx-dependent oxidative stress biomarkers [42]. In our study, we observed changes in the longitudinal
dose-response trend at levels of blood selenium above ~150 µg/L. This result supports the idea that excessively high exposure levels may reverse the beneficial effects of selenium on
cellular redox mechanisms. In addition, excess selenoprotein P has been shown to impair insulin signaling and pancreatic β-cell function and is associated with type 2 diabetes in in-vitro
and in observational studies [6, 43]. Animal studies suggest that not only selenium excess but also deficiency may be positively associated with type 2 diabetes [44]. Some epidemiological
studies also point to non-linear associations between selenium exposure and endpoints such as oxidative stress biomarkers [42], and all-cause and cancer mortality [45]. While the
longitudinal association was clearly non-linear for both HOMA-IR and HOMA-β in our aged-middle study populations, as expected, the corresponding association was fairly linear in our
cross-sectional analysis. Other epidemiological studies did not find such U-shaped response with insulin-resistance-related endpoints [46]. For HOMA-β, we found a positive association with
blood selenium levels in middle-aged but not in older adults. We propose that, at middle age, increased β-cell function may partly be a response to the insulin resistance state induced by
selenium, in which glucose levels rise, and β-cells try to compensate by releasing more insulin. In older people, β-cells may begin to deteriorate and be less functional, thus not keeping
glucose levels low enough, leading to diabetes [47]. Experimental studies have shown the upregulation of cell cycle inhibitors, with a decline in the proliferative and regenerative
capability of β-cell in older age [48]. Indeed, the accumulation of DNA mutations with aging is associated with the disturbance of transcriptional and protein homeostasis leading to an
increase in oxidative stress and ROS in pancreatic cells [47]. Also, it has been observed that HOMA-β indexes depend quadratically on age, decreasing with elderliness [49], supporting our
hypothesis. Some in vitro studies in pancreatic cells, however, show increased insulin release with selenium supplementation [50]. It is, thus, also possible that, at low doses, there is a
component of a protective effect of selenium on β-cell. The very few epidemiologic studies that have previously evaluated the association between selenium exposure and pancreatic β-cell
function [35, 38] show conflicting results, which is not surprising since they include participants with potentially heterogeneous selenium status, do not perform stratified results by age,
and use different biomarkers of selenium exposure (toenail and serum selenium levels). Our study has several limitations. Selenium biomarker concentrations may be altered in the presence of
inflammation, a central mechanism in insulin resistance. While tight adjustment of overall chronic inflammation is difficult, in sensitivity analysis adjustment for serum C-reactive protein
in AWHS and SEN-2 did not change the results (data not shown), making it less likely that residual confounding by inflammation can completely explain our findings. Importantly, it is
well-known that whole blood concentrations are more stable to inflammation compared to other exposure biomarkers such as serum [51]. In addition, the proportion of women in AWHS was
considerably low, so results may not be completely generalizable to middle-aged women. The dose-response associations, however, were consistent in NHANES, which is a representative sample of
the general population in the US that includes both men and women. Another limitation relates to the fact that we do not have available information regarding ethnicity in the Spanish
populations. Nonetheless, the findings were consistent in NHANES, which is a more ethnically diverse population compared to the Spanish population (data not shown). Finally, in our data,
both HOMA indexes increased with BMI in the three study populations, which was previously reported [49] and is plausible due to the close link between adipocytes and insulinemia. While to
avoid potential residual confounding by adiposity we included BMI as a covariate in all association analysis models, as in other observational studies, some residual confounding cannot be
completely discarded. We conducted, nonetheless, several sensitivity analyses, including adjustment for waist circumference, but also physical activity, blood pressure variables, alcohol
intake, and mercury, with essentially similar findings, suggesting that those potential confounders are not relevant to our data. The strengths of this study include the use of data from
three study-populations with high-quality procedures of data collection, processing, and laboratory analysis of biological samples. In addition, despite serum glucose and insulin having been
measured in different laboratories, we made an effort to ensure the comparability of the results using a representative US population as the reference population. Similar results from
original and recalibrated data support that the observed differential associations by age are not due to specific participant characteristics or between-laboratory variations in glucose or
insulin measurements. Moreover, typical limitations of cross-sectional studies were overcome by a longitudinal analysis. In conclusion, blood selenium exposure was positively associated with
insulin resistance and β-cell function in middle age but not in older adults, especially for β-cell function. Thus, our results suggest that selenium-associated increased insulin resistance
may induce compensatory β-cell function, which is impaired with age. Additional studies, however, are needed to confirm the association between selenium and insulin resistance in older
adults. Despite the potential limitations, our work points to age-associated mechanisms of selenium on the onset of type 2 diabetes, which could lead to precision strategies for type 2
diabetes prevention and control depending on age and selenium biomarkers. DATA AVAILABILITY Unrestricted data sharing is not allowed. The statistical code and data that support the findings
of this study are, however, available from the corresponding author upon reasonable request to the corresponding studies' Scientific Committee by qualified researchers trained in human
subject confidentiality protocols. REFERENCES * World Health Organization. Regional Office for South-East Asia. National capacity for prevention and control of non-communicable diseases in
WHO SEAR—Results from NCD country capacity survey 2019 [Internet]. New Delhi: World Health Organization. Regional Office for South-East Asia; 2020 [cited 2022 12].
https://apps.who.int/iris/handle/10665/334223. * Warram JH, Martin BC, Krolewski AS, Soeldner JS, Kahn CR. Slow glucose removal rate and hyperinsulinemia precede the development of type II
diabetes in the offspring of diabetic parents. Ann Intern Med. 1990;113:909–15. Article CAS PubMed Google Scholar * Houstis N, Rosen ED, Lander ES. Reactive oxygen species have a causal
role in multiple forms of insulin resistance. Nature. 2006;440:944–8. Article CAS PubMed Google Scholar * Yaribeygi H, Sathyapalan T, Atkin SL, Sahebkar A. Molecular mechanisms linking
oxidative stress and diabetes mellitus. Oxid Med Cell Longev. 2020;2020:e8609213. Article Google Scholar * Kryukov GV, Castellano S, Novoselov SV, Lobanov AV, Zehtab O, Guigó R, et al.
Characterization of mammalian selenoproteomes. Science. 2003;300:1439–43. Article CAS PubMed Google Scholar * Rayman MP. Selenium and human health. Lancet. 2012;379:1256–68. Article CAS
PubMed Google Scholar * Stapleton SR. Selenium: an insulin mimetic. Cell Mol Life Sci CMLS. 2000;57:1874–9. Article CAS PubMed Google Scholar * Rayman MP, Stranges S. Epidemiology of
selenium and type 2 diabetes: can we make sense of it? Free Radic Biol Med. 2013;65:1557–64. Article CAS PubMed Google Scholar * Coudray C, Roussel AM, Mainard F, Arnaud J, Favier A.
Lipid peroxidation level and antioxidant micronutrient status in a pre-aging population; correlation with chronic disease prevalence in a French epidemiological study (Nantes, France). J Am
Coll Nutr. 1997;16:584–91. CAS PubMed Google Scholar * Park K, Rimm EB, Siscovick DS, Spiegelman D, Manson JE, Morris JS, et al. Toenail selenium and incidence of type 2 diabetes in U.S.
men and women. Diabetes Care. 2012;35:1544–51. Article CAS PubMed PubMed Central Google Scholar * Vinceti M, Filippini T, Wise LA, Rothman KJ. A systematic review and dose-response
meta-analysis of exposure to environmental selenium and the risk of type 2 diabetes in nonexperimental studies. Environ Res. 2021;197:111210. Article CAS PubMed Google Scholar * Cardoso
BR, Braat S, Graham RM. Selenium status is associated with insulin resistance markers in adults: findings from the 2013 to 2018 National Health and Nutrition Examination Survey (NHANES).
Front Nutr. 2021;8:696024. Article PubMed PubMed Central Google Scholar * Giovannini S, Onder G, Lattanzio F, Bustacchini S, di Stefano G, Moresi R, et al. Selenium concentrations and
mortality among community-dwelling older adults: results from ilSIRENTE study. J Nutr Health Aging. 2018;22:608–12. Article CAS PubMed Google Scholar * De Tata V. Age-related impairment
of pancreatic Beta-cell function: pathophysiological and cellular mechanisms. Front Endocrinol (Lausanne). 2014;5:138. PubMed Google Scholar * Matthews DR, Hosker JP, Rudenski AS, Naylor
BA, Treacher DF, Turner RC. Homeostasis model assessment: insulin resistance and β-cell function from fasting plasma glucose and insulin concentrations in man. Diabetologia. 1985;28:412–9.
Article CAS PubMed Google Scholar * Casasnovas JA, Alcaide V, Civeira F, Guallar E, Ibañez B, Borreguero JJ, et al. Aragon workers’ health study—design and cohort description. BMC
Cardiovasc Disord. 2012;12:45. Article PubMed PubMed Central Google Scholar * García-Esquinas E, Carrasco-Rios M, Ortolá R, Sotos Prieto M, Pérez-Gómez B, Gutiérrez-González E, et al.
Selenium and impaired physical function in US and Spanish older adults. Redox Biol. 2021;38:101819. Article PubMed Google Scholar * Callejón-Leblic B, Gómez-Ariza JL, Pereira-Vega A,
García-Barrera T. Metal dyshomeostasis based biomarkers of lung cancer using human biofluids. Metallomics. 2018;10:1444–51. Article PubMed Google Scholar * Rodríguez-Artalejo F, Graciani
A, Guallar-Castillón P, León-Muñoz LM, Zuluaga MC, López-García E, et al. Rationale and methods of the Study on Nutrition and Cardiovascular Risk in Spain (ENRICA). Rev Esp Cardiol Engl Ed.
2011;64:876–82. Article Google Scholar * Martínez-González MA, López-Fontana C, Varo JJ, Sánchez-Villegas A, Martinez JA. Validation of the Spanish version of the physical activity
questionnaire used in the Nurses’ Health Study and the Health Professionals’ Follow-up Study. Public Health Nutr. 2005;8:920–7. Article PubMed Google Scholar * Chasan-Taber S, Rimm EB,
Stampfer MJ, Spiegelman D, Colditz GA, Giovannucci E, et al. Reproducibility and validity of a self-administered physical activity questionnaire for male health professionals. Epidemiology.
1996;7:81. Article CAS PubMed Google Scholar * Wolf AM, Hunter DJ, Colditz GA, Manson JE, Stampfer MJ, Corsano KA, et al. Reproducibility and validity of a self-administered physical
activity questionnaire. Int J Epidemiol. 1994;23:991–9. Article CAS PubMed Google Scholar * Ainsworth BE, Haskell WL, Herrmann SD, Meckes N, Bassett DRJ, Tudor-Locke C, et al. 2011
Compendium of physical activities: a second update of codes and MET values. Med Sci Sports Exerc. 2011;43:1575–81. Article PubMed Google Scholar * Lumley T. Analysis of complex survey
samples. J Stat Softw. 2004;9:1–19. Article Google Scholar * Zhang FL, Ren JX, Zhang P, Jin H, Qu Y, Yu Y, et al. Strong association of waist circumference (WC), body mass index (BMI),
waist-to-height ratio (WHtR), and waist-to-hip ratio (WHR) with diabetes: a population-based cross-sectional study in Jilin Province, China. J Diabetes Res. 2021;2021:e8812431. Article
Google Scholar * Chang CH, Kuo CP, Huang CN, Hwang SL, Liao WC, Lee MC. Habitual physical activity and diabetes control in young and older adults with type II diabetes: a longitudinal
correlational study. Int J Environ Res Public Health. 2021;18:1330. Article PubMed PubMed Central Google Scholar * Office of Dietary Supplements—Selenium [Internet]. [cited 2024 Feb 9].
https://ods.od.nih.gov/factsheets/Selenium-HealthProfessional/. * Filippini T, Michalke B, Wise LA, Malagoli C, Malavolti M, Vescovi L, et al. Diet composition and serum levels of selenium
species: a cross-sectional study. Food Chem Toxicol. 2018;115:482–90. Article CAS PubMed Google Scholar * Raymond LJ, Ralston NVC. Mercury: selenium interactions and health implications.
NeuroToxicology. 2020;81:294–9. Article CAS PubMed Google Scholar * Hannon BA, Fairfield WD, Adams B, Kyle T, Crow M, Thomas DM. Use and abuse of dietary supplements in persons with
diabetes. Nutr Diabetes. 2020;10:14. Article PubMed PubMed Central Google Scholar * Méplan C. Trace elements and ageing, a genomic perspective using selenium as an example. J Trace Elem
Med Biol. 2011;25:S11–6. Article PubMed Google Scholar * Arnaud J, Arnault N, Roussel AM, Bertrais S, Ruffieux D, Galan P, et al. Relationships between selenium, lipids, iron status and
hormonal therapy in women of the SU.VI.M.AX cohort. J Trace Elem Med Biol. 2007;21:66–9. Article CAS PubMed Google Scholar * Peters KM, Galinn SE, Tsuji PA Selenium: dietary sources,
human nutritional requirements and intake across populations. In: Selenium: its molecular biology and role in human health. 2016. 295–305. * Mahn AV, Muñoz MC, Zamorano MJ. Discovery of
biomarkers that reflect the intake of sodium selenate by nutritional proteomics. J Chromatogr Sci. 2009;47:840–3. Article CAS PubMed Google Scholar * Mahdavi Gorabi A, Hasani M,
Djalalinia S, Zarei M, Ejtahed H, Abdar ME, et al. Effect of selenium supplementation on glycemic indices: a meta-analysis of randomized controlled trials. J Diabetes Metab Disord.
2019;18:349–62. Article PubMed PubMed Central Google Scholar * Wang Y, Lin M, Gao X, Pedram P, Du J, Vikram C, et al. High dietary selenium intake is associated with less insulin
resistance in the Newfoundland population. PLoS ONE. 2017;12:e0174149. Article PubMed PubMed Central Google Scholar * Lu CW, Chang HH, Yang KC, Chiang CH, Yao CA, Huang KC. Gender
differences with dose–response relationship between serum selenium levels and metabolic syndrome—a case-control study. Nutrients. 2019;11:477. Article CAS PubMed PubMed Central Google
Scholar * Rath AA, Lam HS, Schooling CM. Effects of selenium on coronary artery disease, type 2 diabetes and their risk factors: a Mendelian randomization study. Eur J Clin Nutr.
2021;75:1668–78. Article CAS PubMed Google Scholar * McClung JP, Roneker CA, Mu W, Lisk DJ, Langlais P, Liu F, et al. Development of insulin resistance and obesity in mice overexpressing
cellular glutathione peroxidase. Proc Natl Acad Sci USA. 2004;101:8852–7. Article CAS PubMed PubMed Central Google Scholar * Cheng Z, Guo S, Copps K, Dong X, Kollipara R, Rodgers JT,
et al. Foxo1 integrates insulin signaling with mitochondrial function in the liver. Nat Med. 2009;15:1307–11. Article CAS PubMed PubMed Central Google Scholar * Cai Z, Zhang J, Li H.
Selenium, aging and aging-related diseases. Aging Clin Exp Res. 2019;31:1035–47. Article PubMed Google Scholar * Galan-Chilet I, Tellez-Plaza M, Guallar E, De Marco G, Lopez-Izquierdo R,
Gonzalez-Manzano I, et al. Plasma selenium levels and oxidative stress biomarkers: a gene–environment interaction population-based study. Free Radic Biol Med. 2014;74:229–36. Article CAS
PubMed Google Scholar * Saito Y. Selenoprotein P as a significant regulator of pancreatic β cell function. J Biochem (Tokyo). 2020;167:119–24. CAS PubMed Google Scholar * Ogawa-Wong AN,
Berry MJ, Seale LA. Selenium and metabolic disorders: an emphasis on type 2 diabetes risk. Nutrients. 2016;8:80. Article PubMed PubMed Central Google Scholar * Bleys J, Navas-Acien A,
Guallar E. Serum selenium levels and all-cause, cancer, and cardiovascular mortality among US adults. Arch Intern Med. 2008;168:404–10. Article CAS PubMed Google Scholar * Galan-Chilet
I, Grau-Perez M, De Marco G, Guallar E, Martin-Escudero JC, Dominguez-Lucas A, et al. A gene-environment interaction analysis of plasma selenium with prevalent and incident diabetes: the
Hortega study. Redox Biol. 2017;12:798–805. Article CAS PubMed PubMed Central Google Scholar * Zhu M, Liu X, Liu W, Lu Y, Cheng J, Chen Y. β cell aging and age-related diabetes. Aging.
2021;13:7691–706. Article CAS PubMed PubMed Central Google Scholar * Tschen SI, Dhawan S, Gurlo T, Bhushan A. Age-dependent decline in β-cell proliferation restricts the capacity of
β-cell regeneration in mice. Diabetes. 2009;58:1312–20. Article CAS PubMed PubMed Central Google Scholar * Horáková D, Štěpánek L, Štěpánek L, Pastucha D, Janoutová J, Janout V, et al.
What are the real associations of homeostasis model assessment (HOMA) with body mass index and age? Endokrynol Pol. 2022;73:736–42. PubMed Google Scholar * Wang C, Yang S, Zhang N, Mu Y,
Ren H, Wang Y, et al. Long-term supranutritional supplementation with selenate decreases hyperglycemia and promotes fatty liver degeneration by inducing hyperinsulinemia in diabetic db/db
mice. PLoS ONE. 2014;9:e101315. Article PubMed PubMed Central Google Scholar * Oakes EJC, Lyon TDB, Duncan A, Gray A, Talwar D, O’Reilly DSTJ. Acute inflammatory response does not affect
erythrocyte concentrations of copper, zinc and selenium. Clin Nutr. 2008;27:115–20. Article CAS PubMed Google Scholar Download references ACKNOWLEDGEMENTS Funding and Assistance. The
authors would like to acknowledge all the current and former staff, members of the Steering Committee, partners, participants, researchers, and consultants who make this ongoing project
possible. This work was supported by the State Agency for Research (PID2019-108973RB-C21 and PID2023-147163OB-C22), the Strategic Action for Research in Health Sciences [PI15/00071,
PI18/01777, PI19/00694, and PI22CIII/00029], and by CIBERCV (CB16/11/00451) from the Spanish Ministry of Economy and Competitiveness and co-funded with European Funds for Regional
Development (FEDER). The AWHS was additionally co-funded by the local Government of Aragon (Spain) through the Institute for Health Sciences of Aragon and the National Center for
Cardiovascular Research at the Instituto de Salud Carlos III (ISCIII) in Madrid. Z R–H received a fellowship associated to a Spain National Investigation Agency project (PRE2020-093926). The
work of Z R-H was also supported by the German Research Foundation (DFG) Project-ID 530592017 (SCHL 2292/3-1). Data collection in the Seniors-ENRICA 2 cohort was supported by the Instituto
de Salud Carlos III, Secretary State for R + D + I, and the European Regional Development Fund/European Social Fund: FIS grants 22/1111; the European Union “NextGenerationEU/PRTR”
(PLEC2022-009352 grant); and the ISCIII-CDTI and the European Union “NextGenerationEU/PRTR” (PMPTA22/00107, PMPTA23/00012, and CPP2022-009718 grants). AUTHOR INFORMATION Author notes * These
authors contributed equally: Esther Garcia-Esquinas, Maria Tellez-Plaza, Roberto Pastor-Barriuso. AUTHORS AND AFFILIATIONS * Integrative Epidemiology Group, Department of Chronic Diseases
Epidemiology, National Center for Epidemiology, Instituto de Salud Carlos III (ISCIII), Madrid, Spain Zulema Rodriguez-Hernandez, Maria Grau-Perez & Maria Tellez-Plaza * Department of
Chronic Diseases Epidemiology, National Center for Epidemiology, Instituto de Salud Carlos III (ISCIII), Madrid, Spain Zulema Rodriguez-Hernandez, Maria Grau-Perez, Esther Garcia-Esquinas,
Maria Tellez-Plaza & Roberto Pastor-Barriuso * Department of Biotechnology, Universitat Politècnica de València, Valencia, Spain Zulema Rodriguez-Hernandez * Institute of Genetic
Epidemiology, Medical Center—University of Freiburg, Faculty of Medicine, University of Freiburg, Freiburg, Germany Zulema Rodriguez-Hernandez * Department of Statistics and Operational
Research, University of Valencia, Valencia, Spain Javier Bel-Aguilar & Maria Grau-Perez * Instituto de Investigación Sanitaria Aragón (IIS Aragón), Hospital Universitario Miguel Servet,
Zaragoza, Spain Belen Moreno-Franco, Ana Cenarro, Fernando Civeira, Jose A. Casasnovas & Martin Laclaustra * Department of Preventive Medicine and Public Health, Universidad de Zaragoza,
Zaragoza, Spain Belen Moreno-Franco * CIBERCV (CIBER de Enfermedades Cardiovasculares), Madrid, Spain Belen Moreno-Franco, Ana Cenarro, Fernando Civeira, Jose A. Casasnovas & Martin
Laclaustra * Big data Unit, Instituto de Investigación Sanitaria Hospital Clinic de Valencia INCLIVA, Valencia, Spain Maria Grau-Perez & Josep Redon * Research Center on Health and The
Environment (RENSMA), Department of Chemistry “Prof.J.C.Vílchez Martín”, University of Huelva, Fuerzas Armadas Ave., Huelva, Spain Jose L. Gomez-Ariza & Tamara Garcia-Barrera *
Department of Legal Medicine, Toxicology, and Physical Anthropology, School of Medicine, University of Granada, Granada, Spain Pablo Olmedo & Fernando Gil * Departamento de Medicina,
Psiquiatría y Dermatología, Facultad de Medicina, Universidad de Zaragoza, Zaragoza, Spain Fernando Civeira, Jose Puzo, Jose A. Casasnovas & Martin Laclaustra * Instituto de
Investigación Sanitaria Aragón (IIS Aragón), Hospital Universitario San Jorge, Huesca, Spain Jose Puzo * Department of Preventive Medicine and Public Health, Universidad Autónoma de Madrid,
Madrid, Spain Jose R. Banegas, Mercedes Sotos-Prieto, Rosario Ortola, Fernando Rodriguez-Artalejo, Esther Garcia-Esquinas & Maria Tellez-Plaza * CIBER of Epidemiology and Public Health
(CIBERESP), Madrid, Spain Jose R. Banegas, Mercedes Sotos-Prieto, Rosario Ortola, Fernando Rodriguez-Artalejo, Esther Garcia-Esquinas & Roberto Pastor-Barriuso * Department of
Environmental Health, Harvard T.H. Chan School of Public Health, Boston, USA Mercedes Sotos-Prieto * IMDEA-Food Institute, CEI UAM+CSIC, Madrid, Spain Mercedes Sotos-Prieto & Fernando
Rodriguez-Artalejo Authors * Zulema Rodriguez-Hernandez View author publications You can also search for this author inPubMed Google Scholar * Javier Bel-Aguilar View author publications You
can also search for this author inPubMed Google Scholar * Belen Moreno-Franco View author publications You can also search for this author inPubMed Google Scholar * Maria Grau-Perez View
author publications You can also search for this author inPubMed Google Scholar * Josep Redon View author publications You can also search for this author inPubMed Google Scholar * Jose L.
Gomez-Ariza View author publications You can also search for this author inPubMed Google Scholar * Tamara Garcia-Barrera View author publications You can also search for this author inPubMed
Google Scholar * Pablo Olmedo View author publications You can also search for this author inPubMed Google Scholar * Fernando Gil View author publications You can also search for this
author inPubMed Google Scholar * Ana Cenarro View author publications You can also search for this author inPubMed Google Scholar * Fernando Civeira View author publications You can also
search for this author inPubMed Google Scholar * Jose Puzo View author publications You can also search for this author inPubMed Google Scholar * Jose A. Casasnovas View author publications
You can also search for this author inPubMed Google Scholar * Jose R. Banegas View author publications You can also search for this author inPubMed Google Scholar * Mercedes Sotos-Prieto
View author publications You can also search for this author inPubMed Google Scholar * Rosario Ortola View author publications You can also search for this author inPubMed Google Scholar *
Martin Laclaustra View author publications You can also search for this author inPubMed Google Scholar * Fernando Rodriguez-Artalejo View author publications You can also search for this
author inPubMed Google Scholar * Esther Garcia-Esquinas View author publications You can also search for this author inPubMed Google Scholar * Maria Tellez-Plaza View author publications You
can also search for this author inPubMed Google Scholar * Roberto Pastor-Barriuso View author publications You can also search for this author inPubMed Google Scholar CONTRIBUTIONS Z.R.-H.:
formal analysis, writing—original draft. J.B.-A.: formal analysis. M.G.-P.: formal analysis, supervision, and writing—original draft, conceptualization, and review and editing. M.T.-P.,
E.G.-E., and R.P.-B.: formal analysis, supervision, and writing—original draft, conceptualization, funding and review, and editing. F.R.-A.: conceptualization, and writing—review and
editing. T.G.-B., J.L.G.-A., P.O., and F.G.: data collection. Z.R.-H., J.B.-A., B.M.-F., M.G.-P., J.R., J.L.G.-A., T.G.-B., P.O., F.G., A.C., F.C., F.P., J.A.C., J.R.B., M.S.-P., R.O., M.L.,
F.R.-A., E.G.-E., M.T.-P., and R.P.-B. meticulously reviewed the paper for significant intellectual content and provided substantial contributions to data interpretation. Additionally,
Z.R.-H., J.B.-A., B.M.-F., M.G.-P., J.R., J.L.G.-A., T.G.-B., P.O., F.G., A.C., F.C., F.P., J.A.C., J.R.B., M.S.-P., R.O., M.L., F.R.-A., E.G.-E., M.T.-P., and R.P.-B. scrutinized and
endorsed the final version of the paper. CORRESPONDING AUTHORS Correspondence to Maria Grau-Perez or Maria Tellez-Plaza. ETHICS DECLARATIONS COMPETING INTERESTS The funding sources did not
influence the study’s design, data collection, analysis, interpretation, or paper writing. All authors state that they have not any conflicts of interest. The opinions and views expressed in
this editorial are those of the authors and do not necessarily represent the official position of the Instituto de Salud Carlos III (ISCIII) (Spain). ADDITIONAL INFORMATION PUBLISHER’S NOTE
Springer Nature remains neutral with regard to jurisdictional claims in published maps and institutional affiliations. SUPPLEMENTARY INFORMATION SUPPLEMENTARY MATERIAL RIGHTS AND
PERMISSIONS OPEN ACCESS This article is licensed under a Creative Commons Attribution-NonCommercial-NoDerivatives 4.0 International License, which permits any non-commercial use, sharing,
distribution and reproduction in any medium or format, as long as you give appropriate credit to the original author(s) and the source, provide a link to the Creative Commons licence, and
indicate if you modified the licensed material. You do not have permission under this licence to share adapted material derived from this article or parts of it. The images or other third
party material in this article are included in the article’s Creative Commons licence, unless indicated otherwise in a credit line to the material. If material is not included in the
article’s Creative Commons licence and your intended use is not permitted by statutory regulation or exceeds the permitted use, you will need to obtain permission directly from the copyright
holder. To view a copy of this licence, visit http://creativecommons.org/licenses/by-nc-nd/4.0/. Reprints and permissions ABOUT THIS ARTICLE CITE THIS ARTICLE Rodriguez-Hernandez, Z.,
Bel-Aguilar, J., Moreno-Franco, B. _et al._ Differential association of selenium exposure with insulin resistance and β-cell function in middle age and older adults. _Nutr. Diabetes_ 15, 5
(2025). https://doi.org/10.1038/s41387-025-00361-2 Download citation * Received: 12 December 2023 * Revised: 16 January 2025 * Accepted: 24 January 2025 * Published: 13 February 2025 * DOI:
https://doi.org/10.1038/s41387-025-00361-2 SHARE THIS ARTICLE Anyone you share the following link with will be able to read this content: Get shareable link Sorry, a shareable link is not
currently available for this article. Copy to clipboard Provided by the Springer Nature SharedIt content-sharing initiative