- Select a language for the TTS:
- UK English Female
- UK English Male
- US English Female
- US English Male
- Australian Female
- Australian Male
- Language selected: (auto detect) - EN
Play all audios:
ABSTRACT Amyloid-β peptide (Aβ) accumulation in the brain is a hallmark of Alzheimer’s Disease. An important mechanism of Aβ clearance in the brain is uptake and degradation by microglia.
Presenilin 1 (PS1) is the catalytic subunit of γ-secretase, an enzyme complex responsible for the maturation of multiple substrates, such as Aβ. Although PS1 has been extensively studied in
neurons, the role of PS1 in microglia is incompletely understood. Here we report that microglia containing phospho-deficient mutant PS1 display a slower kinetic response to micro injury in
the brain in vivo and the inability to degrade Aβ oligomers due to a phagolysosome dysfunction. An Alzheimer’s mouse model containing phospho-deficient PS1 show severe Aβ accumulation in
microglia as well as the postsynaptic protein PSD95. Our results demonstrate a novel mechanism by which PS1 modulates microglial function and contributes to Alzheimer’s -associated
phenotypes. SIMILAR CONTENT BEING VIEWED BY OTHERS CATHEPSIN B MODULATES MICROGLIAL MIGRATION AND PHAGOCYTOSIS OF AMYLOID Β IN ALZHEIMER’S DISEASE THROUGH PI3K-AKT SIGNALING Article 20
September 2024 INCREASED EXPRESSION OF THE PROAPOPTOTIC PRESENILIN ASSOCIATED PROTEIN IS INVOLVED IN NEURONAL TANGLE FORMATION IN HUMAN BRAIN Article Open access 25 October 2024 AUTOPHAGY
ENABLES MICROGLIA TO ENGAGE AMYLOID PLAQUES AND PREVENTS MICROGLIAL SENESCENCE Article 25 May 2023 INTRODUCTION Microglia are yolk sac–derived innate immune cells in the brain that play key
roles in multiple stages of Alzheimer’s disease (AD), from inflammatory responses and synapse pruning to degradation of amyloid-β (Aβ) peptide, all of which are thought to drive AD pathology
progression [1, 2]. For example, in early stages of AD, microglia actively internalize different assemblies of Aβ and eliminate them through endolysosomal degradation [3,4,5]. Aβ clearance
by microglia may be inhibited in late AD due to accumulation of plaques. The buildup of Aβ further leads to the release of pro-inflammatory cytokines, thereby increasing neurotoxicity in AD
brains [1, 3, 6]. Moreover, recent genome-wide association studies of sporadic AD have identified several genes linked to microglia function, such as _Trem2_ and _Cd33_ [7,8,9]. TREM2
facilitates Aβ phagocytosis by microglia [10] and CD33 impairs microglia-mediated Aβ clearance [8]. However, the mechanisms by which microglial cells become defective in AD is incompletely
understood. Presenilin 1 _(Psen1_ gene—PS1 protein) is the catalytic subunit of γ-secretase, an enzyme complex responsible for the cleavage of multiple substrates [11], including the amyloid
precursor protein (APP). The sequential cleavage of APP by β- and γ-secretase leads to the Aβ production, which is thought to play a causative role in Alzheimer’s pathogenesis [12].
Although PS1 is broadly expressed in the central nervous system of humans, within the mouse brain cortex it is highly expressed in microglial cells [13]. Curiously, PS1 has been mostly
studied in neurons. Early reports have shown that γ-secretase plays a significant role in microglia [14]. For example, microglial activation is prevented by γ-secretase inhibitors in a model
of focal ischemic stroke [15]. In mouse microglial cell lines, γ‐secretase inhibitors attenuated pro‐inflammatory cytokine expression upon LPS treatment [16, 17]. Data also suggest that a
familial Alzheimer’s disease (FAD) mutation in PS1 leads microglia to become more reactive to pro-inflammatory stimuli [14, 18]. Data implicating a significant role for PS1 in microglia are
mostly focused on inflammation. The extent to which PS1 significantly contribute to microglial function and development of AD pathological hallmarks beyond inflammation is not well
understood. Phosphorylation is the most common mechanism of regulating protein function and cellular signal transduction. Curiously, PS1 phosphorylation seems to have little impact on
γ-secretase activity [19]; however, PS1 phosphorylation at serine 367 regulates important biological processes, some of which related to Aβ metabolism and AD [20, 21]. We have recently
generated and characterized a knock-in mouse expressing a phospho-deficient PS1 (_Psen1__S367A/S367A_, denoted _Psen1__KI/KI_), which, when crossed with an AD mouse model (J20—mouse
expressing human APP bearing Swedish and Indiana AD-causing mutations), exhibits a significant accumulation of Aβ independent of γ-secretase activity [20, 21]. This increase was shown to be
due to decreased conversion of βCTF to Aβ, through autophagy-mediated βCTF degradation [20, 21]. The present study adds an additional mechanism to our previous findings in neurons, we show
that PS1 phosphorylation at serine 367 plays an important role in regulating Aβ levels by microglia. Live brain imaging in the adult mouse revealed that microglial cells from _Psen1__KI/KI_
mice have decreased ability to respond to brain injury. Combining a systematic profile of microglia transcripts with experiments in primary cell cultures, we show that microglia from
_Psen1__KI/KI_ mice displayed abnormal autophagy-lysosomal pathway and inability to degrade Aβ. In addition, we found a significant accumulation of Aβ and the post-synaptic marker PSD95 in
_Psen1__KI/KI_ microglia in an Alzheimer’s mouse model. Collectively, our data show that the PS1 plays an important role in microglial cells which is associated to disease-related
phenotypes. RESULTS _PSEN1_ _KI/KI_ MICROGLIA SHOW ABNORMAL RESPONSE TO A LASER-INDUCED MICRO INJURY IN VIVO In the adult brain, ramified and mobile processes of microglia continuously scan
the parenchyma and efficiently respond to any local disturbances [22]. Upon brain injury, local microglia respond rapidly by altering their morphology and behavior to a highly mobile,
migratory phenotype [22, 23]. To evaluate functional alterations in microglia due to the lack of PS1 phosphorylation at serine 367, we measured microglial response to a local brain injury by
performing in vivo recording in the live mouse brain using a glass-covered cranial window preparation combined with 2-photon in vivo microscopy [24]. To target PS1 and visualize microglia,
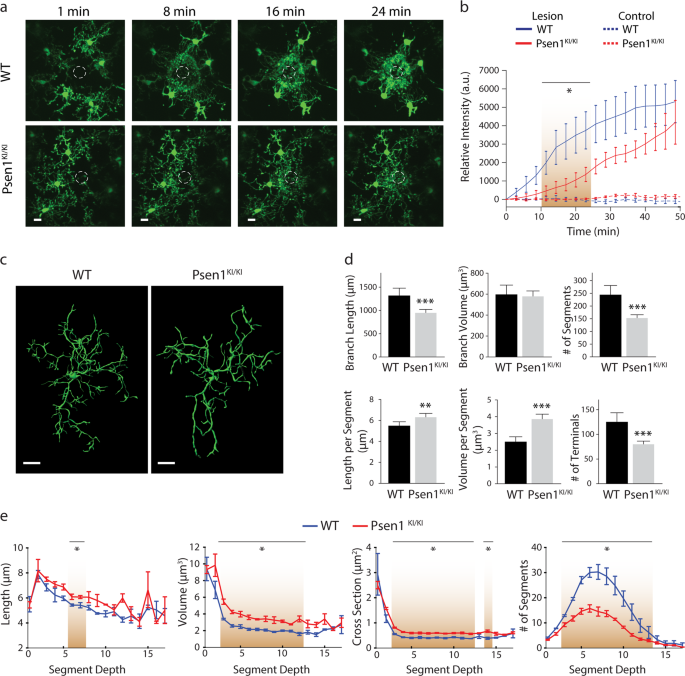
we crossed a phospho-deficient PS1 mouse (PS1 S367A, _Psen1__KI/KI_ (Supplementary Fig. S1a, b)), with fractalkine receptor CX3CR1-EGFP knock-in mouse [25]. Upon laser micro-injury
approximately 65 µm below the mouse cortex surface, microglia from _Psen1__KI/KI_ mice displayed a slower kinetic response compared to WT counterparts (Fig. 1a, b; Supplementary Movie 1).
These data showed that the response to a brain injury, an elementary function of microglia, is altered in _Psen1__KI/KI_ compared to control microglia. Microglia with disrupted morphology,
such as number or length of ramifications, show an impaired ability to efficiently survey the local environment [23]. Therefore, we next characterized microglial morphology in mice. For this
purpose, we imaged the cerebral cortex and traced Iba1+-stained microglia in uninjured mice (Fig. 1c; Supplementary Movie 2). We found that microglia branch length, the number of branch
segments; segment length, segment volume and number of terminals were significantly altered in _Psen1__KI/KI_ microglia whereas the total volume was not different between groups (Fig. 1c–e;
Supplementary Fig. S1c). High mobility and a complex arborization allow microglial cells to efficiently survey the brain parenchyma, whereas defects in this process can compromise how
microglia respond to external signaling to activate phagocytosis. In addition to microglial morphology we also investigated microglial number in WT and _Psen1__KI/KI_ mice (Supplementary
Fig. S1d). Our data showed that microglial number in _Psen1__KI/KI_ mice is equivalent to WT mice. Collectively, our results demonstrate that the lack of phosphorylation of PS1 at serine 367
disrupts an elementary microglial response to a brain injury in vivo. GENE EXPRESSION PROFILES OF WT AND _PSEN1_ _KI/KI_ MICROGLIA We next assessed microglial gene expression profiles in WT
and _Psen1__KI/KI_ mice to comprehensively evaluate biological pathways differentially regulated in _Psen1__KI/KI_ (Fig. 2a; Supplementary Fig. S1e). Analysis of adult control WT and
_Psen1__KI/KI_ microglia revealed 121 genes differentially expressed in _Psen1__KI/KI_ microglia (Fig. 2b). Interestingly, examination of transcriptional patterns of WT and _Psen1__KI/KI_
microglia using PCA analysis, suggests that WT and _Psen1__KI/KI_ microglia are distinct populations (Fig. 2c). This result holds when analyzing expression of previously defined microglia
identity genes [26] (Fig. 2c, upper panel) or all genes (Fig. 2c, lower panel). We next performed pathway analysis using Ingenuity Pathway Analysis (IPA). The most significantly altered
pathway elicited in _Psen1__KI/KI_ microglia was related to phagosome maturation (−log _p_ 12.5) (Fig. 2d). Previous reports have shown that phagosome formation at the tip of microglia
branches is critical for the engulfment of damaged neurons and cell debris by microglia, such process is exacerbated upon brain microinjury [23, 27]. Defects in phagosome formation or
processing capacity is potentially related to the slower kinetic response of _Psen1__KI/KI_ microglia to a micro injury in the brain. Our analysis also revealed that the 14-3-3 pathway was
altered in _Psen1__KI/KI_ microglia (−log _p_ 9.92), which represent conserved regulatory proteins that act in a variety of cellular processes [28]. Another pathway significantly affected by
_Psen1__KI/KI_ was the ERK/MAPK signaling pathway (−log _p_ 9.61) which has been shown to be specifically activated in microglia in a pre-clinical model of AD pathology and human
post-mortem AD brains [29]. Interestingly, ERK inhibition reduces the ability of microglia to phagocytose Aβ42 [29]. In addition, our analysis revealed that the autophagy pathway was
significantly affected by _Psen1__KI/KI_ in microglia (−log _p_ 2.93) (Fig. 2e). These data showed that _Psen1__KI/KI_ disturbed important microglial pathways, of which the most significant
changes are related to autophagy. Thus, we next sought to investigate autophagosomes related structures in microglia from WT and _Psen1__KI/KI_ mice. _PSEN1_ _KI/KI_ DISRUPTS THE
AUTOPHAGY-LYSOSOMAL PATHWAY IN MICROGLIA Using primary microglial cell cultures, we observed that _Psen1__KI/KI_-derived microglia accumulated autophagosome vacuoles (AVs), identified based
on their size and morphology, containing excessive undigested material and LC3 protein (Fig. 3a, b, white arrows indicate LC3), which suggests abnormalities in autophagy. Next, we asked
whether abnormal AV accumulation found in vitro would be present in the mouse brain microglia. To investigate that, we sorted microglia from WT and _Psen1__KI/KI_ adult mice and performed
electron microscopy. Results showed that mice _Psen1__KI/KI_ microglia have a much higher number of AVs containing excessive undigested material than WT microglia (Fig. 3c, white arrows).
Acidification is an essential step during phagosome maturation which critically depends on the activity of the V-type (vacuolar) ATPases, proton pumps [30]. Interestingly, our RNA-seq data
also revealed that the expression of the lysosomal V-ATPase _Atp6v0a1_ was decreased in _Psen1__KI/KI_ microglia (Supplementary Table S1). We further confirmed this data by qPCR (Fig. 3d).
Since V-ATPases play a major role in the acidification of intracellular organelles such as lysosomes, we asked whether _Psen1__KI/KI_ microglia present different pH values from WT microglia.
The data showed that _Psen1__KI/KI_ microglia have higher pH values than WT microglia (Fig. 3e). These data suggest that the autophagy–lysosomal pathway in microglia is disrupted by the
lack of phosphorylation of PS1 at serine 367. We did not find differences in _Atp6v0a1_ mRNA or lysosomal pH in WT microglia compared to _Psen1_ KO (Supplementary Fig. 1f), similar to Zhang
et al. [31]. One of the most thoroughly studied substrates of γ-secretase in addition to APP is Notch. Interestingly, autophagy and endocytic pathways regulate Notch degradation, signaling
and, importantly, Notch intracellular domain cleavage [32,33,34]. Although our previous report showed that γ-secretase activity toward APP is not affected by _Psen1__KI/KI_, it is unknown
the impact of _Psen1__KI/K_ in γ-secretase activity toward Notch in microglial cells. Thus, we next investigated γ-secretase activity toward Notch in microglial cell cultures of WT and
_Psen1__KI/KI_ mice. Our data revealed a robust increase in γ-secretase activity toward Notch in _Psen1__KI/KI_ microglia compared to WT (Fig. 3f). This result prompted us to investigate
whether the reduced expression of the lysosomal V-ATPase _Atp6v0a1_ caused by _Psen1__KI/KI_ was downstream to Notch cleavage. Pharmacological inhibition of γ-secretase activity in
microglial cells did not change _Atp6v0a1_ mRNA or lysosomal pH in _Psen1__KI/KI_ or WT microglia (Fig. 3g, h). Previous reports have shown that _Psen1_ deficiency suppress autophagy
independent of γ-secretase activity, and cells deficient of _Psen1_ have decreased levels of the lysosomal ATPase V-ATP6v and the transcriptional factor EB (TFEB) [35, 36], a master
regulator of lysosome biogenesis and autophagy [37]. Interestingly, TFEB overexpression has been shown to increase the levels of v-ATP6v0a1 [38]. We, thus, explored whether decreased
lysosomal _Atp6v0a1_ mRNA and increased lysosomal pH in _Psen1__KI/KI_ microglia was mediated by TFEB. Our RNA sequencing data from microglia sorted from mice brain (Supplementary Table S1)
and qPCR (Fig. 3i) showed that TFEB mRNA level was decreased in _Psen1__KI/KI_ microglial cells compared to WT microglia. We therefore sought to overexpress an active form TFEB in WT and
_Psen1__KI/KI_ microglia (Fig. 3j) and evaluate _ATP6v0a1_ mRNA level and lysosomal pH (Fig. 3k, l). Our data showed that the active form of TFEB in _Psen1__KI/KI_ microglia increased
_ATP6v0a1_ mRNA level and normalized lysosomal pH compared to WT microglia (Fig. 3k, l). _PSEN1_ _KI/KI_ INCREASES AΒ ACCUMULATION IN MICROGLIAL CELLS IN AN ALZHEIMER’S MOUSE MODEL The
autophagy-lysosomal pathway has been implicated in neurodegenerative diseases, including AD [39]. Experimental evidences have shown that autophagy plays an important role in Aβ metabolism
[20, 40,41,42,43,44]. Thus, we next challenged microglial cells with soluble Aβ oligomers to evaluate uptake and degradation of Aβ in WT and _Psen1__KI/KI_ microglia (Fig. 4a). While
_Psen1__KI/KI_-derived microglia showed Aβ oligomer uptake rates similar to those seen in WT microglia, they displayed an impaired capacity for Aβ oligomer degradation (Fig. 4b). An
interplay between production and degradation dictate Aβ levels in the brain. Microglial cells contribute significantly to Aβ removal through degradation of the soluble fraction, and defects
in Aβ clearance have been shown to accelerate AD pathology [44, 45]. Since wild-type mice do not develop age-associated amyloid pathology, we next crossed _Psen1__KI/KI_ mice with 5xFAD
mice, an accelerated model of AD that displays severe amyloid pathology [46] (5xFAD * _Psen1__KI/KI_ mouse was hemizygous for FAD mutations and homozygous for _Psen1__KI/KI_.) To evaluate
the impact of _Psen1__KI/KI_ on microglial Aβ internalization in mouse brain, we measured Aβ accumulation in microglia in the brain of 5xFAD and 5xFAD * _Psen1__KI/KI_ mice. Confocal imaging
of Aβ and Iba1 in brain tissue sections revealed that more Aβ was retained within 5xFAD * _Psen1__KI/KI_ microglia compared to the 5xFAD (Fig. 4c, d). To comprehensively assess the impact
of _Psen1__KI/KI_ on Aβ accumulation in the entire brain, we applied the tissue clearing method iDISCO on intact brain hemispheres stained with Congo red (Fig. 4e; Supplementary Movie 3).
Quantification of Aβ plaques, performed with region-specificity using ClearMap [47] revealed that 3 month old 5xFAD * _Psen1__KI/KI_ mice accumulate significantly more Aβ plaques in 35
different areas of the brain than age-matched 5xFAD control mice (Fig. 4f, g). Of note, 5xFAD * _Psen1__KI/KI_ mice not only accumulated more Aβ plaques but also soluble Aβ 40 and 42
compared to 5xFAD mice (Supplementary Fig. S2a). Our previous report showed that _Psen1__KI/KI_ does not increase Aβ production through increased activity of γ-secretase toward APP [21]. To
confirm that increased Aβ levels in 5xFAD * _Psen1__KI/KI_ mice brains were not due to an increase in Aβ production (e.g., increased γ-secretase activity toward APP), we performed
γ-secretase activity in 5xFAD and 5xFAD * _Psen1__KI/KI_ mice brains (Supplementary Fig. S2b). Our data showed no difference in γ-secretase activity toward APP in 5xFAD * _Psen1__KI/KI_ mice
compared to 5xFAD. Thus, dismissing the possibility that increased Aβ accumulation inside microglia in 5xFAD * _Psen1__KI/KI_ mouse brain resulted from a general increase in Aβ production.
Due to the fact that Aβ- plaques are tightly enclosed by microglia processes and constitute a barrier that is critical for limiting plaque affinity for the neurotoxic soluble Aβ42 [48], we
next evaluated the number of microglial cells associated with the enveloping of Aβ plaques. We found that the number of microglia associated with the enveloping of plaques in 5xFAD *
_Psen1__KI/KI_ mice is comparable to 5xFAD mice (Fig. 4h), suggesting that the increase in Aβ in 5xFAD * _Psen1__KI/KI_ mice was not due to reduced number of microglia interacting with Aβ
plaques. We also did not find any differences in total microglial number (Supplementary Fig. S2c) or gliosis (Supplementary Fig. S2d,e) in 5xFAD * _Psen1__KI/KI_ mice compared to 5xFAD.
Collectively, our data suggest that PS1 phosphorylation at serine 367 in microglia plays an important role in regulating Aβ metabolism in WT and 5xFAD mice. Owning to the fact that the
_Psen1__KI/KI_ microglia displayed abnormal autophagy and inability to degrade Aβ, and deficient autophagy in microglia impairs neuronal spine pruning [49], we sought to investigate whether
microglia containing _Psen1__KI/KI_ would also accumulate more of the postsynaptic marker PSD-95. Our data revealed that _Psen1__KI/KI_ * 5xFAD microglia retained more PSD-95 than the 5xFAD
control microglia, (Fig. 5a, b). Next, we examined whether the AD mice brain containing _Psen1__KI/KI_ microglia displayed abnormal synaptic density. We thus used super resolution structured
illumination microscopy to quantify synaptic density in hippocampal molecular layer and hilus of WT, _Psen1__KI/KI_, 5xFAD and 5xFAD*_Psen1__KI/KI_ mice. Quantification of colocalized pre-
and post-synaptic puncta (synaptophysin and postsynaptic density 95 (PSD95), for details see “Methods”) showed a significant loss of synapses in 5xFAD * _Psen1__KI/KI_ mice compared to 5xFAD
and a significant loss in _Psen1__KI/KI_ mice compared to WT (Fig. 5c–f; Supplementary Fig. S3a). DISCUSSION Recently, we have shown that PS1, upon phosphorylation of serine 367 by CK1γ,
can decrease Aβ levels through an autophagy-mediated mechanism involving the conversion of βCTF to Aβ independent of γ -secretase activity [20, 21, 50]. The present study adds an additional
mechanism to our previous findings: we show that PS1 phosphorylation plays an important role in regulating autophagy-lysosomal pathway and Aβ levels by microglial cells. Collectively, our
reports suggest that PS1 regulates Aβ levels at multiple levels. In our current study we demonstrated that microglia from _Psen1__KI/KI_ mice are functionally impaired. Using 2-photon
intravital microscopy, we measured microglial response to a local injury. _Psen1__KI/KI_ microglia displayed slower movement toward the site of injury and decreased formation of
spherical-shaped inclusions. This spherical-shaped inclusion formation is attributable to a protective effect due to phagocytosis and removal of damaged tissue as well as shielding of the
injured site [22, 48, 51]. Notably, microglia from aged mouse brain showed a decreased response to laser injury [52], similar to _Psen1__KI/KI_ microglia. Interestingly, our RNA-seq data
revealed pathways that are related to the ability of microglia to respond to a micro-injury in the brain. For example, phagosome formation and processing capacity plays an important role in
microglial response to a micro injury in the brain [23]. Our data demonstrated that _Psen1__KI/KI_ microglia display a significant accumulation of autophagosomes, inability to degrade
autophagy substrates and clear AVs, which is potentially a result of defects in lysosome/autolysosome acidification in microglia. Although, we cannot rule out the possibility of a defect in
the autophagosome-lysosome fusion, as we showed previously in neurons [20]. Our previous study in neurons, pointed to defects in autophagosome-lysosome fusion but not lysosome/autolysosome
acidification [20]. Data suggest that autophagosome-lysosome fusion is not dependent on lysosomal acidification [53], which is in agreement with our previous report. Thus, disturbed
lysosome/autolysosome acidification caused by _Psen1__KI/KI_ might be microglial specific and disturbed autophagosome-lysosome fusion restricted to neurons. However, this remains to be
confirmed. Our pathway analysis also revealed that 14-3-3 pathway was significantly altered in _Psen1__KI/KI_ microglia. 14-3-3 proteins interact with microtubule-associated protein tau and
induce tau phosphorylation [54]. Tau proteins regulate microtubule dynamics through microtubule-tau interaction [55]. Interestingly, it was shown that impairment of microtubule function due
to tau hyperphosphorylation may promote dysregulation of the actin dynamics [56, 57]. Microglial shape changes rely on the rearrangement of the cytoskeletal proteins, in particular the actin
microfilaments [58]. These cellular rearrangements in microglia are essential for microglia movement toward injury sites in the brain. Thus, it is possible that 14-3-3 proteins and Tau are
mechanistically involved in _Psen1__KI/KI_ microglia slower movement toward a site of laser micro-injury (Fig. 1a). γ-Secretase activity regulates a multitude of signaling pathways and
biological processes by influencing gene transcription via the processing of its substrates and consequently production of its intracellular domains (ICDs). Several ICDs produced by
γ-secretase cleavage are known to translocate into the nucleus and regulate transcription. One of the most noted cases is the processing of the Notch receptor. Therefore, we considered that
the alterations in gene transcription related to the lysosomal acidification induced by _Psen1__KI/KI_ could be due to changes in γ-secretase activity. Indeed, we found that _Psen1__KI/KI_
microglia show increased γ-secretase activity toward Notch. However, pharmacological inhibition of γ-secretase activity in microglial cells did not change _v-ATP6v0a1_ mRNA levels or
lysosomal pH in WT and _Psen1__KI/KI_ microglia, discarding the potential involvement of γ-secretase activity in that process. Nonetheless, we investigated whether the decreased lysosomal
_v-ATP6v0a1_ mRNA and increased lysosomal pH in _Psen1__KI/KI_ microglia was mediated by the transcriptional factor TFEB, a master regulator of lysosome biogenesis and autophagy, which
overexpression has been shown to increase the levels of v-ATP6v0a1 [38]. Interestingly, _Psen1_-/- neural stem cells show reduced autophagosome formation and downregulated expression of
autophagy–lysosome pathway, which seems to depend on TFEB [35]. Importantly, these effects did not depend on γ-secretase activity. Our data showed that TFEB mRNA levels is decreased in
_Psen1__KI/KI_ microglial cells compared to WT microglia. We next overexpressed an active form TFEB in WT and _Psen1__KI/KI_ microglia and evaluate _v-Atp6v0a1_ mRNA levels and lysosomal pH.
Interestingly, active form of TFEB in _Psen1__KI/KI_ microglia increased _v-Atp6v0a1_ mRNA levels and normalized lysosomal pH compared to WT microglia. These results suggest that TFEB acts
downstream to PS1 and regulates transcriptional changes related to v-atpases and consequently lysosomal acidification. The exact mechanism by which PS1 regulates TFEB remains to be
elucidated. In our previous work we showed that PS1 phosphorylated at serine 367 binds Annexin A2, as opposed to non-phosphorylated _Psen1__KI/KI_ [20]. Importantly, mutation of PS1 serine
366 or PS1 serine 368 did not affect the binding of Annexin A2 to PS1 [20]. Annexin A2 not only is known to translocate into the nucleus but it has been shown to form a complex with TFEB and
YWHA/14-3-3 [59]. Thus, PS1 upon phosphorylation could potentially regulate TFEB through Annexin A2 independent of γ-secretase activity. Nonetheless, the molecular mechanisms by which PS1
regulates TFEB are incompletely understood. A recent report showed that cells deficient in PS1 display a significant reduction in TFEB-mediated clearance due to a reduction in Sestrin2
expression [36]. The authors then showed that PS1 deficient fibroblasts and iPSC-derived AD human neurons display impaired ability to initiate autophagy and reduction of the coordinated
lysosomal expression and regulation network. Interestingly, the authors also showed an increase in Aβ 42/40 ratio in TFEB-deficient mouse brains. In our present study we also demonstrated
that microglia in 5xFAD * _Psen1__KI/KI_ mice accumulate more post-synaptic protein PSD95 than 5xFAD mice in areas of the brain important for cognition. A recent work showed Aβ oligomers
increase synaptic pruning by microglia and microglia can act as early mediators of synaptic loss in AD mouse models [60]. We observed a significant accumulation of PSD95 puncta in 5xFAD *
_Psen1__KI/KI_ microglia compared to 5xFAD, but not in _Psen1__KI/KI_ compared to WT, possibly because endogenous mouse Aβ does not aggregated and accumulate in the mouse brain and therefore
did not trigger microglial pruning. Moreover, our data showed that _Psen1__KI/KI_ accelerated synaptic loss in an AD mouse model. Although part of these results can be attributable to spine
pruning by microglia, it is possible that _Psen1__KI/KI_ disturbs synapses in WT and 5xFAD mice by acting also directly in neurons independently of microglia. Importantly, Semick et al.
[61] reported that CK1γ2 gene is hypermethylated in vulnerable regions in the brain of sporadic AD patients, which results in lower CK1γ2 expression and could potentially lead to decreased
phosphorylation of PS1 at serine 367. Elucidation of the mechanisms that regulate PS1 phosphorylation at serine 367 may aid in the development of therapies for AD. Due to the fact that PS1
serine 367 is preserved in humans, it would be extremely important to demonstrate that PS1 phosphorylation changes in human AD brains. However, technical challenges preclude such an
evaluation. We and others have shown in several species that protein dephosphorylation occurs within seconds after death in animal models. Interventions not feasible in humans (microwave)
are required to preserve protein phosphorylation. Future studies are needed to determine the extent to which abnormalities in microglia that contribute to AD are specifically mediated by
microglial PS1. METHODS MICE C57BL/6 (000664), Cx3Cr1-GFP (005582), Psen1loxP (004825), and 5xFAD (34848-JAX) mice were purchased from the Jackson Laboratories and maintained in our
facilities. Psen1S367A (_Psen1__KI/KI_) constitutive knock-in C57BL/6J mice were generated by homologous recombination targeting exon 10. As wild type controls C57BL/6J, _Psen1__KI/KI_
-negative littermates were used. _Psen1__KI/KI_ mice was crossed with 5xFAD hemizygous mouse. 5xFAD hemizygous mouse _* Psen1_KI/WT mice was then crossed with _Psen1_KI/WT mice. 5xFAD
hemizygous * _Psen1__KI/KI_ mice were used in this study. Mice were weaned at the third postnatal week, genotyped by Transnetyx using real-time PCR and kept on a 12 h/12 h light/dark cycle
(lights on at 7:00) with access to food and water ad libitum. All mice were maintained at The Rockefeller University Animal facilities and used at 8–14 weeks of age for all experiments.
Littermates of the same sex were randomly assigned to experimental groups. Both female and male mice were used for experiments, except for in vivo imaging where only males were used. Mice
were anesthetized for all procedures involving potential pain/ stress. Animal care and experimentation were according to NIH guidelines and were approved by the Institutional Animal Care and
Use Committee at The Rockefeller University (protocol #18035H). PRIMARY CULTURES OF MOUSE MICROGLIA AND OTHER TREATMENTS Briefly, neonate (P0–P1) mouse brains cortices were dissociated in
culture medium containing DMEM/F12 (ThermoFisher Scientific, 10565018) supplemented with 10% fetal bovine serum (ThermoFisher Scientific, 16000044) and 1% Penicillin–Streptomycin
(ThermoFisher Scientific, 15140148). Cells were incubated in 75 cm2 flasks for 2 weeks at 37 °C, 5% CO2. Microglial cells were isolated according to Saura et al., (2003) [62]. For Aβ
degradation experiments serum was omitted from the culture medium during the assay. Aβ oligomers were prepared according to Ledo et al., 2016 [63]. Primary microglial cultures were treated
with 100 nM of Aβ 1–42 oligomers per 3 h. Aβ was detect using an ELISA kit (ThermoFisher Scientific, KHB3441). Aβ 1–42 peptide was purchased from AnaSpec (AS-24224). TFEB lentivirus
containing a constitutively active version (S142A, S211A) of Tfeb was a gift from Dr. Jhimmy Talbot. Cells were transduced with an empty vector or TFEB-expressing lentivirus for 24 h, then
medium was replaced, and cells were harvest after 48 h. TFEB protein levels was assessed by Western blot. DAPT treatment: cells were treated with vehicle or DAPT (10 µM) for 24 h. DAPT was
purchased from Tocris /Bio-Techne (Cat. No. 2634). PS1 deletion in primary microglia culture was performed according to Paolicelli et al. [64]. Psen1loxP/loxP (JAX-004825) mice was used for
primary microglia culture preparations. Psen1loxP/loxP primary microglia culture was treated with recombinant TAT-CRE (100 U/mL medium, SCR508, EMD Millipore) to induce Psen1 gene deletion.
Control Psen1loxP/loxP microglia were treated with a solution containing 50% glycerol, 500 mM NaCl and 20 mM HEPES at pH 7.4. AΒ DETECTION IN BRAIN EXTRACTS Soluble Aβ was extracted using
diethylamine (DEA) and insoluble Aβ was extracted with formic acid (FA). Aβ was detect using an ELISA kit (ThermoFisher Scientific, KHB3441). Soluble Aβ: one brain hemisphere was homogenized
in 850 µL cold tissue homogenization buffer (2 mM Tris pH7.4, 250 mM sucrose, 0.5 mM EDTA and 0.5 mM EGTA) containing protease inhibitors cocktail. After homogenization, 250 µL of a
solution containing 0.2% DEA in 50 mM NaCl was added to the brain sample and centrifuged at 100,000 _g_ for 1 h at 4 °C. Supernatant, which contains the soluble fraction, were treated with
0.5 M Tris HCl pH 6.8 (1/10 volume) and vortexed gently. Neutralized samples were analyzed by ELISA without further dilution or flash-frozen on dry ice and stored at −80 °C. Remained pellet
was used for insoluble Aβ preparation, described below. Insoluble Aβ: 125 µL cold formic acid (minimum 95%, Sigma, 5-0507) was added to the homogenate pellet (see above), then sonicated for
1 min on ice. Samples were then centrifuged at 109,000 × _g_ for 1 h at 4 °C. After, 105 µL sample was diluted into 1.850 mL of room temperature FA neutralization solution (1 M Tris base,
0.5 M Na2HPO4, 0.05% NaN3), vortexed gently and stored at −80 °C. Samples were briefly mixed and incubated at 37 °C for 5 min prior to loading onto ELISA plates. BRAIN MICROGLIA ISOLATION
FROM ADULT MICE AND FLOW CYTOMETRY ANALYSIS Mice were anesthetized with a Ketamine/Xylazine cocktail and perfused with 25 mL of Ca2+/Mg2+-free DPBS (Sigma). Brain was removed and placed in
FACS buffer (PBS containing 5% FBS and 10 mM HEPES). Whole brains (except cerebellum) were minced with scissors and incubated with 4000 U/mL of collagenase D (Roche, 11088858001) at 37 °C
for 30 min. Collagenase was inactivated by adding 10 mM EDTA for an additional 5-min incubation at 37 °C. Digested material was passed through a 70-μm cell strainer, followed by a
centrifugation at 2000 rpm in 38% Percoll gradient for 30 min. Cell pellets were resuspended in FACS buffer and nonspecific binding to FC receptors was blocked by incubation with a CD16- and
CD32-specific antibody (BD-Pharmingen 553141) for 15 min. Cells were then washed and stained with the markers described below to certify cell population specificity. Cx3cr1+ – CD45+ –
Csf1r+ – Cd11b+ – Ly-6c (negative). Fluorescent-dye-conjugated antibodies were purchased from Biolegend (anti-CD115 (Csfr1), 135510; anti-F4/80, 123131; anti-Cx3Cr1, 149016; anti-CD117
(c-kit), 105824; anti-Ly6c, 128033), Invitrogen (Anti-CD11b, 47-0112-82; anti-CD45, 56-0451-82) or BD-Pharmingen (anti-CD16/CD32 (FC blocking); 553141). Live cells were verified using DAPI
(4′,6-Diamidino-2-Phenylindole, Dilactate), (D3571, Thermofisher). Flow cytometry data were acquired on an LSR-II flow cytometer (Becton Dickinson) and analyzed using FlowJo software (Tree
Star). RNA ISOLATION FROM PRIMARY MICROGLIAL CULTURES RNA was isolated using the ReliaPrep™ RNA Miniprep Systems (Promega, Z6011). Briefly, cells were washed with ice-cold sterile 1X PBS.
After, 250 µL of BL + TG Buffer (provided by the manufacturer) was added to the cells. Lysate was then transferred to a 1.5 mL tube with 85 µL of isopropanol and mixed by vortexing for 5 s.
After, lysate was transferred to a ReliaPrep™ minicolumn and the following steps were conducted according to the instructions provided by the manufacturer. RNA SEQUENCING AND BIOINFORMATICS
_Adult mouse microglia:_ 20,000–35,000 cells per each sample were sorted directly into RNA lysis buffer (Qiagen, 79216) supplemented with 2 M dithiothreitol. RNA was isolated using RNAeasy
plus micro kit (Qiagen, 74034). Briefly, homogenized lysate was transferred to a gDNA eliminator spin column placed in a 2 mL collection tube (supplied by the manufacturer). The following
steps were conducted according to the instructions provided by the manufacturer. For all RNA samples, RNA integrity number (RIN) was ≥8.5. After RNA isolation, 1 ng of total RNA was used to
generate full length cDNA using Clontech’s SMART-Seq v4 Ultra Low Input RNA Kit (634888). cDNA was then used to prepare libraries using Illumina Nextera XT DNA sample preparation kit
(FC-131-1024). Libraries with unique barcodes were pooled at equal molar ratios and sequenced on Illumina NextSeq 500 sequencer to generate 150 bp single reads, following manufacturer’s
protocol. The reads were aligned using the STAR version 2.3.0 software that permits unique alignments to Mouse Ensembl genes. Differential expression was determined using edgeR software with
default settings. Expression is given in Counts per million (CPM). _Microglia identity signature genes:_ defined as 239 genes that are specifically expressed in mouse microglia compared to
monocytes and other immune cell types [26]. REAL-TIME RELATIVE QUANTIFICATION PCR qPCR was performed using Taqman reagents. Rpl23 or ActB were used to normalize samples. Predesigned probes
used were purchased from IDTDNA. mRNA levels are expressed using the 2−ΔΔCt method [65]. EXO-CELL Γ-SECRETASE ACTIVITY ASSAY Cells were seeded in 96-well culture plates. Media was then
removed, and cells were washed with PBS. Cleavage assay mixture included a final concentration of PIPES Buffer (50 mM PIPES, pH 7.0, 150 mM KCl, 5 mM CaCl2, 5 mM MgCl2), 0.25% CHAPSO
detergent, protease inhibitor cocktail, Notch substrate (0.4 µM), and 0.1% DMSO or JC2 at 1 µM final concentration. Cleavage assay was performed at 37 °C for 2.5 h. Product of Notch cleavage
was recognized by AlphaLISA detection comprised of anti-activated Notch antibody SM320, protein A-conjugated acceptor beads, and streptavidin-conjugated donor beads (PerkinElmer) [66].
Activity readout was expressed as arbitrary units minus the background signal from γ-secretase inhibitor sample and normalized to protein concentration. WESTERN BLOT FACS sorted microglial
cells derived from WT and _Psen1__KI/KI_ mice were lysed in a buffer containing 2% CHAPSO, 50 mM Hepes pH 7.4, 150 mM NaCl, protease inhibitor cocktail (PhosStop, Sigma-Aldrich) and protease
inhibitor cocktail mini (Roche). PS1 was immunoprecipitated by incubating cell extracts overnight at 4C with anti-PS1 antibody (Mab5232, Sigma-Aldrich) covalently bound to agarose beads,
then run in a Tricine SDS-PAGE and blotted with anti-PS1-pS367 antibody. The membrane was stripped, and reblotted with anti- total PS1 (Mab5232, Sigma-Aldrich). GAPDH antibody was from
GeneTex (Cat No. GTX89740). IMMUNOHISTOCHEMISTRY Animals were anesthetized and perfused with PBS, followed by 4% formaldehyde in PBS. Fixed brains were removed and cryoprotected in
increasing concentrations of sucrose up to 30% w/v in PBS. Brains were frozen on dry ice in OCT, and 50 µm or 150 µm coronal sections were made on a cryostat and stored in section freezing
solution at −20 °C. Groups of three sections per animal (three animals per condition in each experiment) were stained with the following procedure: wash 10 min in PBS, permeabilization 20
min with PBS + 0.2% Triton x-100 (PBST), block 40 min with 10% NGS in PBST, incubate primary antibody overnight in PBST with 5% NGS, wash 3 × 10 min in PBST, incubate 2 h in secondary
antibody in PBST with 5% NGS, wash in 3 × 10 min in PBS, and mount in CFM-2 mounting medium. For thicker sections, additional permeabilization was performed by 10 min incubation steps with
increasing methanol in PBS (25%, 50%, 75%, 100%, 75%, 50%, 25%), and primary antibody staining was performed at RT overnight. All incubation steps were performed with gentle agitation on a
nutating mixer. Microglia (Iba1), post-synaptic marker PSD95 and Aβ were stained using antibodies from Abcam (anti-Iba1, ab5076, 1:25; anti-PSD95, ab76115, 1:500) and Biolegend (anti-Aβ,
clone 6E10, 803003, 1:500), respectively. Sections were imaged on a Zeiss LSM 710 with a ×40, ×63 oil or ×100 oil immersion objective. All primary and secondary antibodies were validated
before use. Secondary antibody only control was performed and resulted in no false positives or nonspecific binding (data not shown). LC3-GFP EXPRESSION AND IMMUNO-ELECTRON MICROSCOPY For
LC3-GFP expression, LentiBriteTM Lentiviral Biosensor (Millipore, 17-10193) was used. Briefly, lentiviruses were incubated in the cell medium at 40 multiplicity of infection for 24 h, and
then medium was replaced every 24 h for 48 h. After treatment, cells were subjected to high pressure freezing (Leica EMPAC2) and freeze substitute in 0.2% uranyl acetate in 95% acetone and
5% water. Subsequently they were embedded in Lowicryl HM20 (Electron Microcopy Sciences, 14340) at −40 °C and cut into ultrathin sections. Next, ultrathin sections were incubated with 3% BSA
(Sigma-Aldrich, A7906) and 0.1% saponin (Sigma-Aldrich, 47036), 0.1% cold fish skin gelatin (Sigma-Aldrich, G7765) in 20 mM Tris buffer saline (pH 7.4) for 2 h at RT, an anti-GFP raised in
chicken (1:300) (Aves Lab Inc, GFP-1020) at 4 °C overnight. Antigen-antibody complexes were recognized by anti-chicken colloidal gold tagged with 12 nm colloidal gold (Jackson immuno
Research Lab Inc, 703-205-155) by 2 h incubation at RT. Negative control was done with the same procedure, except for omitting the primary antibody incubation. For autophagosomes in primary
microglial cell cultures magnification was ×6600. For LC3 staining in primary microglial cell cultures magnifications was ×8300. For autophagosomes in microglia from adult mice brains
magnification was ×10,000. Immuno complexes were examined under a JEOL JEM 100CX transmission electron microscope with the digital imaging system (Advantage Microscopy Technology Corp,
XR41-C) in the Electron Microscopy Resource Center in The Rockefeller University. LYSOSOMAL PH Primary microglial cells from neonate mouse were plated on a clear bottom 96-well plate with
black walls and incubated with 500 μg/mL of the acidotropic probe, Lysosensor yellow/blue dextran (Invitrogen, L22460) for 24 h. After, cells were washed with PBS and fluorescence was
detected using a microplate reader with an excitation of 340 nm and an emission wavelength of 430 and 535 nm. Relative lysosomal pH levels were determined by the emission ratio of 430/535
nm. CRANIAL WINDOW TECHNIQUE FOR TWO-PHOTON IN VIVO IMAGING Mice received one injection of 100 μL of Ketamine/Xylazine cocktail (40 mg/mL ketamine - 6 mg/mL Xylazine) (Sigma, K113)
intraperitoneally, followed one hour later by intraperitoneal injection of 0.8 g/kg of Urethane (Sigma, U2500). A circular area of 2–2.5 mm diameter was drawn in the skull and thinned with a
sterile 1RF 007 drill bit using a Microtorque II drill set (Ram Products Inc, 10145FT) at ~4000 rpm. The skull piece was then carefully removed with forceps to prevent agitation of the
tissue and rupture of superficial blood vessels. A small drop of artificial CSF was placed on the tissue immediately after removing the skull and a 5 mm coverslip was placed to cover the
exposed tissue. A small drop of Permabond® glue was carefully applied under the coverslip edged to affix the coverslip to the skull. After the glue was dried and the coverslip was attached
to the skull, a custom-made metal plate was glued to the skull using a low viscosity silicone (World precision Instruments, KWIK-SIL). The concave plate was designed to hold immersion fluid
(water) for the dipping lens. The mouse was then transferred to a custom-made platform to prevent any motion of the head during imaging. Multiphoton microscopy experiments were performed
according to Nimmerjahn et al. with minor modifications [22]. In vivo image acquisition was performed on an Olympus FV1000MPE Twin upright BX61 multiphoton system with a 25×/1.05 N.A. Plan
objective. A lesion was introduced at a confined area (spot size of ~10 μm laterally in a single plane) using elevated illumination intensities of a 473 nm LD laser at 50% power for 30 s at
a typical depth from the cortex surface of 85 µm. Immediately preceding the lesion, image stacks were acquired using a coherent Chameleon Vision II IR laser at 900 nm, covering a depth range
of ±40 µm from the lesion site. Stack volumes were taken at a frequency of 0.61 volumes per minute and with an axial resolution of 1 µm. Microglia encroachment analysis was performed by
measuring the cumulative intensity of pixels within a fixed volume centered at the lesion site after subtraction of the initial intensity. Image analysis was done blind with regard to
experimental condition. Image stacks and time series were analyzed using ImageJ software from the National Institutes of Health. MORPHOLOGY TRACING AND VOLUME IMAGES Cell tracing and volume
image rendering were performed using Bitplane’s Imaris software. Microglia morphology was characterized using the filament tracing tool. Manual correction of the autopath tracing was
performed on 100 µm confocal stack images of Iba1 staining in the cortex. For tracing experiments, six hemispheres were used from three different mice for each genotype. Volume images from
confocal or light sheet microscope stacks are all maximum intensity projection images. IDISCO VISUALIZATION AND CLEARMAP QUANTITATION OF PLAQUES Intact brain hemispheres were stained for Aβ
plaques using a previously described protocol for iDISCO [47]. Quantification of Aβ plaques was performed with the previously published ClearMap tool [47, 67]. ClearMap automates whole
hemisphere light sheet image registration to the Allen Brain Atlas and detects and quantifies objects in all annotated brain regions. Detection settings were as follows: background
subtraction (7 pixels), difference of Gaussian filter (5, 5, 9), extended maxima h-max (20) and size (5 pixels) and cell shape threshold (200). Output values of ClearMap are number and
intensity of objects detected. AIRYSCAN CONFOCAL SUPER-RESOLUTION MICROSCOPY AND QUANTITATIVE ANALYSIS Brain slides were imaged on an inverted Zeiss LSM 880 laser-scanning confocal
microscope equipped with an Airyscan super-resolution module (Carl Zeiss AG, Germany), which improves optical resolution in all spatial directions by 1.7-fold [68, 69]. All images were
acquired using a 63 × 1.4 NA oil objective lens (Plan-Apochromat, 1.40 Oil DIC M27), with the pinhole set at 1.25 AU. For imaging microglia engulfment, single microglia was centered in the
image frame and the Z-stack dimensions were set manually by tracking IBA-1 labeled processes, which were typically ranged from 20 to 30 µm for a given microglia. Images were acquired as 1164
× 1164 pixels (zoom factor = 2.7) with a Z-interval of 0.1 µm, corresponding to a voxel dimension of 0.04 × 0.04 × 0.1 µm in _x_, _y_, and _z_ directions. For imaging synaptic density,
Z-stack dimensions were set to 10–20 µm. Images were acquired as 868 × 868 pixels (zoom factor = 3.6) with a Z-interval of 0.04 µm, corresponding to a voxel dimension of 0.04 × 0.04 × 0.04
µm in _x_, _y_, and _z_ directions. To reduce overall photobleaching and fluorescence crosstalk, maximum of two channels were defined and then scanned simultaneously using MBS 488/561 as the
dichroic beam splitter. Airyscan processing was done in 3D mode at default settings using Zeiss Zen 2 software (black edition). QUANTIFICATION OF SYNAPTIC DENSITY AND MICROGLIA ENGULFMENT
Image analysis was performed as previously described by Schafer et al., 2012 and Hong et al. [60, 70] with minor modifications. In brief, Airyscan confocal z-stacks were imported into
Imaris® (version 9.1.2) software (Bitplane Inc.) and target of interest was segmented out from rest of the 3D dataset by manually selecting in each z-stack. For experiments regarding the
engulfment of PSD95 and Aβ by microglia each 15 µm z-stack contains only one microglia was cut, collected in Imaris and the volumetric density calculated. PSD95 and Aβ fluorescence signal
outside of the microglial surface was discarded to ensure that only engulfed PSD95 and Aβ was calculated. For analysis of the co-localization of pre-synaptic marker synaptophysin and the
post-synaptic marker PSD95, each 6 µm excluding very empty regions was collected in Imaris, then segmentation of spots in both fluorescence channels was performed separately, followed by
quantification the number of colocalized spots (≤200 nm distance between spot centers of two synaptic channels). Representative images (Fig. 5c, e) were the maximum intensity projection of
the Z-stack images (across 6 µm) which makes larger aggregates more noticeable. However, the actual detected synapses (colocalized spots) are fairly similar in terms of size, regardless of
different samples and their depth in the tissue. STATISTICAL ANALYSIS All results are presented as mean ± SEM. Prism software or Matlab were used for data analysis, except for synapse puncta
quantification, SigmaPlot 13.0, Systat Software was used. No statistical methods were used to predetermine sample sizes, sample sizes were determined according to data reported in previous
publications. Normality tests and _F_ tests for equality of variance were performed before choosing the statistical test. Unless otherwise indicated, two-tailed _t_-test or one-way analysis
of variance with Dunnett’s multiple comparison test was used. _P_ < 0.05 was considered significant (*_p_ < 0.05, **_p_ < 0.01, ***_p_ < 0.001, ****_p_ < 0.0001). Animals in
the same litter were randomly assigned to different experimental groups and blinded to experimenters. REFERENCES * Heneka MT, Carson MJ, Khoury JE, Landreth GE, Brosseron F, Feinstein DL, et
al. Neuroinflammation in Alzheimer’s disease. Lancet Neurol. 2015;14:388–405. CAS PubMed PubMed Central Google Scholar * Hong S, Dissing-Olesen L, Stevens B. New insights on the role of
microglia in synaptic pruning in health and disease. Curr Opin Neurobiol. 2016;36:128–34. CAS PubMed Google Scholar * Fan Z, Brooks DJ, Okello A, Edison P. An early and late peak in
microglial activation in Alzheimer’s disease trajectory. Brain J Neurol. 2017;140:792–803. Google Scholar * Hamelin L, Lagarde J, Dorothée G, Leroy C, Labit M, Comley RA, et al. Early and
protective microglial activation in Alzheimer’s disease: a prospective study using 18F-DPA-714 PET imaging. Brain. 2016;139:1252–64. PubMed Google Scholar * Khoury JE, Toft M, Hickman SE,
Means TK, Terada K, Geula C, et al. Ccr2 deficiency impairs microglial accumulation and accelerates progression of Alzheimer-like disease. Nat Med. 2007;13:432–8. PubMed Google Scholar *
Krabbe G, Halle A, Matyash V, Rinnenthal JL, Eom GD, Bernhardt U, et al. Functional impairment of microglia coincides with Beta-amyloid deposition in mice with Alzheimer-like pathology. PLoS
ONE. 2013;8:e60921. CAS PubMed PubMed Central Google Scholar * Jonsson T, Stefansson K. TREM2 and neurodegenerative disease. N Engl J Med. 2013;369:1568–9. CAS PubMed Google Scholar
* Griciuc A, Serrano-Pozo A, Parrado AR, Lesinski AN, Asselin CN, Mullin K, et al. Alzheimer’s disease risk gene CD33 inhibits microglial uptake of amyloid beta. Neuron. 2013;78:631–43. CAS
PubMed PubMed Central Google Scholar * Malik M, Parikh I, Vasquez JB, Smith C, Tai L, Bu G, et al. Genetics ignite focus on microglial inflammation in Alzheimer’s disease. Mol
Neurodegener. 2015;10:52. PubMed PubMed Central Google Scholar * Wang Y, Cella M, Mallinson K, Ulrich JD, Young KL, Robinette ML, et al. TREM2 lipid sensing sustains the microglial
response in an Alzheimer’s disease model. Cell. 2015;160:1061–71. CAS PubMed PubMed Central Google Scholar * Haapasalo A, Kovacs DM. The many substrates of presenilin/γ-secretase. J
Alzheimer’s Dis. 2011;25:3–28. CAS Google Scholar * Mucke L, Selkoe DJ. Neurotoxicity of amyloid β-protein: synaptic and network dysfunction. Cold Spring. 2012;2:a006338. Google Scholar *
Zhang Y, Chen K, Sloan SA, Bennett ML, Scholze AR, O’Keeffe S, et al. An RNA-sequencing transcriptome and splicing database of glia, neurons, and vascular cells of the cerebral cortex. J
Neurosci. 2014;34:11929–47. CAS PubMed PubMed Central Google Scholar * Walter J, Kemmerling N, Wunderlich P, Glebov K. γ-Secretase in microglia - implications for neurodegeneration and
neuroinflammation. J Neurochem. 2017;143:445–54. CAS PubMed Google Scholar * Arumugam TV, Chan SL, Jo D-G, Yilmaz G, Tang S-C, Cheng A, et al. Gamma secretase-mediated Notch signaling
worsens brain damage and functional outcome in ischemic stroke. Nat Med. 2006;12:621–3. CAS PubMed Google Scholar * Cao Q, Li P, Lu J, Dheen ST, Kaur C, Ling E-A. Nuclear factor-κB/p65
responds to changes in the Notch signaling pathway in murine BV-2 cells and in amoeboid microglia in postnatal rats treated with the γ-secretase complex blocker DAPT. J Neurosci Res.
2010;88:2701–14. CAS PubMed Google Scholar * Grandbarbe L, Michelucci A, Heurtaux T, Hemmer K, Morga E, Heuschling P. Notch signaling modulates the activation of microglial cells. Glia.
2007;55:1519–30. PubMed Google Scholar * Lee J, Chan SL, Mattson MP. Adverse effect of a presenilin-1 mutation in microglia results in enhanced nitric oxide and inflammatory cytokine
responses to immune challenge in the brain. Neuromol Med. 2002;2:29–45. CAS Google Scholar * Matz A, Halamoda-Kenzaoui B, Hamelin R, Mosser S, Alattia J-R, Dimitrov M, et al.
Identification of new Presenilin-1 phosphosites: implication for γ-secretase activity and Aβ production. J Neurochem. 2015;133:409–21. CAS PubMed Google Scholar * Bustos V, Pulina MV,
Bispo A, Lam A, Flajolet M, Gorelick FS, et al. Phosphorylated Presenilin 1 decreases β-amyloid by facilitating autophagosome-lysosome fusion. Proc Natl Acad Sci USA. 2017;114:201705240.
Google Scholar * Bustos V, Pulina MV, Kelahmetoglu Y, Sinha SC, Gorelick FS, Flajolet M, et al. Bidirectional regulation of Aβ levels by Presenilin 1. Proc Natl Acad Sci USA.
2017;114:201705235. Google Scholar * Nimmerjahn A, Kirchhoff F, Helmchen F. Resting microglial cells are highly dynamic surveillants of brain parenchyma in vivo. Science. 2005;308:1314–8.
CAS PubMed Google Scholar * Meller J, Chen Z, Dudiki T, Cull RM, Murtazina R, Bal SK, et al. Integrin-Kindlin3 requirements for microglial motility in vivo are distinct from those for
macrophages. JCI Insight. 2017;2:e93002. Google Scholar * Goldey GJ, Roumis DK, Glickfeld LL, Kerlin AM, Reid RC, Bonin V, et al. Removable cranial windows for long-term imaging in awake
mice. Nat Protoc. 2014;9:2515–38. CAS PubMed PubMed Central Google Scholar * Jung S, Aliberti J, Graemmel P, Sunshine MJ, Kreutzberg GW, Sher A, et al. Analysis of fractalkine receptor
CX(3)CR1 function by targeted deletion and green fluorescent protein reporter gene insertion. Mol Cell Biol. 2000;20:4106–14. CAS PubMed PubMed Central Google Scholar * Butovsky O,
Jedrychowski MP, Moore CS, Cialic R, Lanser AJ, Gabriely G, et al. Identification of a unique TGF-β-dependent molecular and functional signature in microglia. Nat Neurosci. 2014;17:131–43.
CAS PubMed Google Scholar * Mazaheri F, Breus O, Durdu S, Haas P, Wittbrodt J, Gilmour D, et al. Distinct roles for BAI1 and TIM-4 in the engulfment of dying neurons by microglia. Nat
Commun. 2014;5:4046–11. CAS PubMed Google Scholar * Fu H, Subramanian RR, Masters SC. 14-3-3 proteins: structure, function, and regulation. Annu Rev Pharmacol Toxicol. 2000;40:617–47. CAS
PubMed Google Scholar * Chen MJ, Ramesha S, Weinstock LD, Gao T, Ping L, Xiao H, et al. Microglial ERK signaling is a critical regulator of pro-inflammatory immune responses in
Alzheimer’s disease. BioRxiv. 2019:798215. * Kinchen JM, Ravichandran KS. Phagosome maturation: going through the acid test. Nat Rev Mol Cell Biol. 2008;9:781–95. CAS PubMed PubMed Central
Google Scholar * Zhang X, Garbett K, Veeraraghavalu K, Wilburn B, Gilmore R, Mirnics K, et al. A role for presenilins in autophagy revisited: normal acidification of lysosomes in cells
lacking PSEN1 and PSEN2. J Neurosci. 2012;32:8633–48. CAS PubMed PubMed Central Google Scholar * Vaccari T, Lu H, Kanwar R, Fortini ME, Bilder D. Endosomal entry regulates Notch receptor
activation in Drosophila melanogaster. J Cell Biol. 2008;180:755–62. CAS PubMed PubMed Central Google Scholar * Barth JMI, Hafen E, Köhler K. The lack of autophagy triggers precocious
activation of Notch signaling during Drosophila oogenesis. BMC Dev Biol. 2012;12:35–14. CAS PubMed PubMed Central Google Scholar * Wu X, Fleming A, Ricketts T, Pavel M, Virgin H, Menzies
FM, et al. Autophagy regulates Notch degradation and modulates stem cell development and neurogenesis. Nat Commun. 2016;7:10533–17. CAS PubMed PubMed Central Google Scholar * Chong C-M,
Ke M, Tan Y, Huang Z, Zhang K, Ai N, et al. Presenilin 1 deficiency suppresses autophagy in human neural stem cells through reducing γ-secretase-independent ERK/CREB signaling. Cell Death
Dis. 2018;9:879–13. PubMed PubMed Central Google Scholar * Reddy K, Cusack CL, Nnah IC, Khayati K, Saqcena C, Huynh TB, et al. Dysregulation of nutrient sensing and CLEARance in
presenilin deficiency. Cell Rep. 2016;14:2166–79. CAS PubMed PubMed Central Google Scholar * Martini-Stoica H, Xu Y, Ballabio A, Zheng H. The autophagy-lysosomal pathway in
neurodegeneration: a TFEB perspective. Trends Neurosci. 2016;39:221–34. CAS PubMed PubMed Central Google Scholar * Pan H-Y, Alamri AH, Valapala M. Nutrient deprivation and lysosomal
stress induce activation of TFEB in retinal pigment epithelial cells. Cell Mol Biol Lett. 2019;24:33–39. PubMed PubMed Central Google Scholar * Uddin MS, Mamun AA, Labu ZK,
Hidalgo-Lanussa O, Barreto GE, Ashraf GM. Autophagic dysfunction in Alzheimer’s disease: cellular and molecular mechanistic approaches to halt Alzheimer’s pathogenesis. J Cell Physiol.
2019;234:8094–112. CAS PubMed Google Scholar * Boland B, Smith DA, Mooney D, Jung SS, Walsh DM, Platt FM. Macroautophagy is not directly involved in the metabolism of amyloid precursor
protein. J Biol Chem. 2010;285:37415–26. CAS PubMed PubMed Central Google Scholar * Caccamo A, Majumder S, Richardson A, Strong R, Oddo S. Molecular interplay between mammalian target of
rapamycin (mTOR), amyloid-beta, and Tau: effects on cognitive impairments. J Biol Chem. 2010;285:13107–20. CAS PubMed PubMed Central Google Scholar * Jaeger PA, Pickford F, Sun C-H,
Lucin KM, Masliah E, Wyss-Coray T. Regulation of amyloid precursor protein processing by the Beclin 1 complex. PLoS ONE. 2010;5:e11102. PubMed PubMed Central Google Scholar * Nilsson P,
Loganathan K, Sekiguchi M, Matsuba Y, Hui K, Tsubuki S, et al. Aβ secretion and plaque formation depend on autophagy. Cell Rep. 2013;5:61–69. CAS PubMed Google Scholar * Aguzzi A, Barres
BA, Bennett ML. Microglia: scapegoat, saboteur, or something else? Science. 2013;339:156–61. CAS PubMed PubMed Central Google Scholar * Prinz M, Priller J, Sisodia SS, Ransohoff RM.
Heterogeneity of CNS myeloid cells and their roles in neurodegeneration. Nat Neurosci. 2011;14:1227–35. CAS PubMed Google Scholar * Oakley H, Cole SL, Logan S, Maus E, Shao P, Craft J, et
al. Intraneuronal beta-amyloid aggregates, neurodegeneration, and neuron loss in transgenic mice with five familial Alzheimer’s disease mutations: potential factors in amyloid plaque
formation. J Neurosci. 2006;26:10129–40. CAS PubMed PubMed Central Google Scholar * Liebmann T, Renier N, Bettayeb K, Greengard P, Tessier-Lavigne M, Flajolet M. Three-dimensional study
of Alzheimer’s disease hallmarks using the iDISCO clearing method. Cell Rep. 2016;16:1138–52. CAS PubMed PubMed Central Google Scholar * Condello C, Yuan P, Schain A, Grutzendler J.
Microglia constitute a barrier that prevents neurotoxic protofibrillar Aβ42 hotspots around plaques. Nat Commun. 2015;6:6176–14. CAS PubMed Google Scholar * Kim H-J, Cho M-H, Shim WH, Kim
JK, Jeon E-Y, Kim D-H, et al. Deficient autophagy in microglia impairs synaptic pruning and causes social behavioral defects. Mol Psychiatry. 2017;22:1576–84. CAS PubMed Google Scholar *
Flajolet M, He G, Heiman M, Lin A, Nairn AC, Greengard P. Regulation of Alzheimer’s disease amyloid-beta formation by casein kinase I. Proc Natl Acad Sci USA. 2007;104:4159–64. CAS PubMed
PubMed Central Google Scholar * Shaked I, Tchoresh D, Gersner R, Meiri G, Mordechai S, Xiao X, et al. Protective autoimmunity: interferon-gamma enables microglia to remove glutamate
without evoking inflammatory mediators. J Neurochem. 2005;92:997–1009. CAS PubMed Google Scholar * Hefendehl JK, Neher JJ, Sühs RB, Kohsaka S, Skodras A, Jucker M. Homeostatic and
injury-induced microglia behavior in the aging brain. Aging Cell. 2014;13:60–69. CAS PubMed Google Scholar * Jahreiss L, Menzies FM, Rubinsztein DC. The itinerary of autophagosomes: from
peripheral formation to kiss-and-run fusion with lysosomes. Traffic. 2008;9:574–87. CAS PubMed PubMed Central Google Scholar * Hashiguchi M, Sobue K, Paudel HK. 14-3-3zeta is an effector
of tau protein phosphorylation. J Biol Chem. 2000;275:25247–54. CAS PubMed Google Scholar * Goedert M. Tau protein and the neurofibrillary pathology of Alzheimer’s disease. Trends
Neurosci. 1993;16:460–5. CAS PubMed Google Scholar * Fulga TA, Elson-Schwab I, Khurana V, Steinhilb ML, Spires TL, Hyman BT, et al. Abnormal bundling and accumulation of F-actin mediates
tau-induced neuronal degeneration in vivo. Nat Cell Biol. 2007;9:139–48. CAS PubMed Google Scholar * Elie A, Prezel E, Guérin C, Denarier E, Ramirez-Rios S, Serre L, et al. Tau
co-organizes dynamic microtubule and actin networks. Sci Rep. 2015;5:9964–10. CAS PubMed PubMed Central Google Scholar * Franco-Bocanegra DK, McAuley C, Nicoll JAR, Boche D. Molecular
mechanisms of microglial motility: changes in ageing and Alzheimer’s disease. Cells. 2019;8:639. CAS PubMed Central Google Scholar * Wang K, Zhang T, Lei Y, Li X, Jiang J, Lan J, et al.
Identification of ANXA2 (annexin A2) as a specific bleomycin target to induce pulmonary fibrosis by impeding TFEB-mediated autophagic flux. Autophagy. 2018;14:269–82. CAS PubMed PubMed
Central Google Scholar * Hong S, Beja-Glasser VF, Nfonoyim BM, Frouin A, Li S, Ramakrishnan S, et al. Complement and microglia mediate early synapse loss in Alzheimer mouse models.
Science. 2016;352:712–6. CAS PubMed PubMed Central Google Scholar * Semick SA, Bharadwaj RA, Collado-Torres L, Tao R, Shin JH, Deep-Soboslay A, et al. Integrated DNA methylation and gene
expression profiling across multiple brain regions implicate novel genes in Alzheimer’s disease. Acta Neuropathol. 2019;137:557–69. CAS PubMed Google Scholar * Saura J, Tusell JM,
Serratosa J. High-yield isolation of murine microglia by mild trypsinization. Glia. 2003;44:183–9. PubMed Google Scholar * Ledo JH, Azevedo EP, Beckman D, Ribeiro FC, Santos LE, Razolli
DS, et al. Cross talk between brain innate immunity and serotonin signaling underlies depressive-like behavior induced by Alzheimer’s amyloid-β oligomers in mice. J Neurosci.
2016;36:12106–16. CAS PubMed PubMed Central Google Scholar * Paolicelli RC, Jawaid A, Henstridge CM, Valeri A, Merlini M, Robinson JL, et al. TDP-43 depletion in microglia promotes
amyloid clearance but also induces synapse loss. Neuron. 2017;95:297–308. e6. CAS PubMed PubMed Central Google Scholar * Schmittgen TD, Livak KJ. Analyzing real-time PCR data by the
comparative C(T) method. Nat Protoc. 2008;3:1101–8. CAS PubMed Google Scholar * Chau D-M, Crump CJ, Villa JC, Scheinberg DA, Li Y-M. Familial Alzheimer disease presenilin-1 mutations
alter the active site conformation of γ-secretase. J Biol Chem. 2012;287:17288–96. CAS PubMed PubMed Central Google Scholar * Renier N, Wu Z, Simon DJ, Yang J, Ariel P, Tessier-Lavigne
M. iDISCO: a simple, rapid method to immunolabel large tissue samples for volume imaging. Cell. 2014;159:896–910. CAS PubMed Google Scholar * Engelmann R, Anhut T, Kleppe I, Microsc KWI,
2014. Airyscanning: evoking the full potential of confocal microscopy. n.d. * Kolossov VL, Sivaguru M, Huff J, Luby K, Kanakaraju K, Gaskins HR. Airyscan super‐resolution microscopy of
mitochondrial morphology and dynamics in living tumor cells. Microsc Res Technol. 2018;81:115–28. CAS Google Scholar * Schafer DP, Lehrman EK, Kautzman AG, Koyama R, Mardinly AR, Yamasaki
R, et al. Microglia sculpt postnatal neural circuits in an activity and complement-dependent manner. Neuron. 2012;74:691–705. CAS PubMed PubMed Central Google Scholar Download references
ACKNOWLEDGEMENTS This work was supported by funds received from Fisher Center for Alzheimer′s Research Foundation, JPB Foundation, and Cure Alzheimer’s Fund. JHL is a Pew Latin American
Fellow in the Biomedical Sciences, supported by The Pew Charitable Trusts. OGT and RZ were in part supported by the US National Institutes of Health (NIH) grant R01 GM071966. OGT is a senior
fellow of the Genetic Networks program of the Canadian Institute for Advanced Research (CIFAR). We thank Drs. Marc Flajolet and Jean-Pierre Roussarie, for discussions and critical reading
and editing of the manuscript. We thank Dr. Kunihiro Uryu, the director of the Electron Microscopy Resource Center and Dr. Connie Zhao, the director of Genomics Resource Center, both at
Rockefeller University, for their valuable assistance with experiments. We also thank Dr. Alison North and Dr. Kaye Thomas at Bio-Imaging Resource Center for their assistance using the
multiphoton microscope. The Rockefeller University Bio-Imaging Resource Center is supported by the Empire State Stem Cell Fund through NYSDOH C023046. This work is dedicated to the memory of
Paul Greengard, beloved mentor and fantastic scientist. AUTHOR INFORMATION AUTHORS AND AFFILIATIONS * Laboratory of Molecular and Cellular Neuroscience, The Rockefeller University, New
York, NY, 10065, USA Jose Henrique Ledo, Thomas Liebmann, Jerry C. Chang, Victor Bustos & Paul Greengard * Lewis Sigler Institute for Integrative Genomics, Princeton University,
Princeton, NJ, 08544, USA Ran Zhang & Olga G. Troyanskaya * Laboratory of Molecular Genetics, The Rockefeller University, New York, NY, 10065, USA Estefania P. Azevedo * Chemical Biology
Program, Memorial Sloan Kettering Cancer Center, New York, NY, 10065, USA Eitan Wong * Skirball Institute of Biomolecular Medicine, New York University School of Medicine, New York, NY,
10016, USA Hernandez Moura Silva * Flatiron Institute, Simons Foundation, New York, NY, 10010, USA Olga G. Troyanskaya Authors * Jose Henrique Ledo View author publications You can also
search for this author inPubMed Google Scholar * Thomas Liebmann View author publications You can also search for this author inPubMed Google Scholar * Ran Zhang View author publications You
can also search for this author inPubMed Google Scholar * Jerry C. Chang View author publications You can also search for this author inPubMed Google Scholar * Estefania P. Azevedo View
author publications You can also search for this author inPubMed Google Scholar * Eitan Wong View author publications You can also search for this author inPubMed Google Scholar * Hernandez
Moura Silva View author publications You can also search for this author inPubMed Google Scholar * Olga G. Troyanskaya View author publications You can also search for this author inPubMed
Google Scholar * Victor Bustos View author publications You can also search for this author inPubMed Google Scholar * Paul Greengard View author publications You can also search for this
author inPubMed Google Scholar CONTRIBUTIONS JHL, VB and PG, conceived; JHL, VB, and PG, supervised this study; JHL designed experiments; JHL, TL, EPA, JCC, HMS, EW, performed and analyzed
experiments; RZ performed bioinformatics analysis. JHL, and TL prepared figures. JHL and PG wrote the paper. CORRESPONDING AUTHOR Correspondence to Jose Henrique Ledo. ETHICS DECLARATIONS
CONFLICT OF INTEREST The authors declare that they have no conflict of interest. ADDITIONAL INFORMATION PUBLISHER’S NOTE Springer Nature remains neutral with regard to jurisdictional claims
in published maps and institutional affiliations. SUPPLEMENTARY INFORMATION SUPPLEMENTAL MOVIE 1 SUPPLEMENTAL MOVIE 2 SUPPLEMENTAL MOVIE 3 SUPPLEMENTAL MOVIE 4 SUPPLEMENTAL MATERIAL DATA SET
1 SUPPLEMENTARY DATA 1 SUPPLEMENTARY DATA 2 SUPPLEMENTARY DATA 3 RIGHTS AND PERMISSIONS This article is licensed under a Creative Commons Attribution 4.0 International License, which
permits use, sharing, adaptation, distribution and reproduction in any medium or format, as long as you give appropriate credit to the original author(s) and the source, provide a link to
the Creative Commons licence, and indicate if changes were made. The images or other third party material in this article are included in the article's Creative Commons licence, unless
indicated otherwise in a credit line to the material. If material is not included in the article's Creative Commons licence and your intended use is not permitted by statutory
regulation or exceeds the permitted use, you will need to obtain permission directly from the copyright holder. To view a copy of this licence, visit
http://creativecommons.org/licenses/by/4.0/. Reprints and permissions ABOUT THIS ARTICLE CITE THIS ARTICLE Ledo, J.H., Liebmann, T., Zhang, R. _et al._ Presenilin 1 phosphorylation regulates
amyloid-β degradation by microglia. _Mol Psychiatry_ 26, 5620–5635 (2021). https://doi.org/10.1038/s41380-020-0856-8 Download citation * Received: 20 November 2019 * Revised: 21 July 2020 *
Accepted: 24 July 2020 * Published: 13 August 2020 * Issue Date: October 2021 * DOI: https://doi.org/10.1038/s41380-020-0856-8 SHARE THIS ARTICLE Anyone you share the following link with
will be able to read this content: Get shareable link Sorry, a shareable link is not currently available for this article. Copy to clipboard Provided by the Springer Nature SharedIt
content-sharing initiative