- Select a language for the TTS:
- UK English Female
- UK English Male
- US English Female
- US English Male
- Australian Female
- Australian Male
- Language selected: (auto detect) - EN
Play all audios:
ABSTRACT A novel immunomagnetic nanobeads -based lateral flow test strip was developed for the simultaneous quantitative detection of neuron specific enolase (NSE) and carcinoembryonic
antigen (CEA), which are sensitive and specific in the clinical diagnosis of small cell lung cancer. Using this nanoscale method, high saturation magnetization, carboxyl-modified magnetic
nanobeads were successfully synthesized. To obtain the immunomagnetic probes, a covalent bioconjugation of the magnetic nanobeads with the antibody of NSE and CEA was carried out. The
detection area contained test line 1 and test line 2 which captured the immune complexes sensitively and formed sandwich complexes. In this assay, cross-reactivity results were negative and
both NSE and CEA were detected simultaneously with no obvious influence on each other. The magnetic signal intensity of the nitrocellulose membrane was measured by a magnetic assay reader.
For quantitative analysis, the calculated limit of detection was 0.094 ng/mL for NSE and 0.045 ng/mL for CEA. One hundred thirty clinical samples were used to validate the test strip which
exhibited high sensitivity and specificity. This dual lateral flow test strip not only provided an easy, rapid, simultaneous quantitative detection strategy for NSE and CEA, but may also be
valuable in automated and portable diagnostic applications. SIMILAR CONTENT BEING VIEWED BY OTHERS ELECTROCHEMICAL MICRO-APTASENSORS FOR EXOSOME DETECTION BASED ON HYBRIDIZATION CHAIN
REACTION AMPLIFICATION Article Open access 17 August 2021 MICROFLUIDIC MAGNETIC DETECTION SYSTEM COMBINED WITH A DNA FRAMEWORK-MEDIATED IMMUNE-SANDWICH ASSAY FOR RAPID AND SENSITIVE
DETECTION OF TUMOR-DERIVED EXOSOMES Article Open access 07 November 2023 AN ELECTRONIC BIOSENSOR BASED ON SEMICONDUCTING TETRAZINE POLYMER IMMOBILIZING MATRIX COATED ON RGO FOR
CARCINOEMBRYONIC ANTIGEN Article Open access 22 February 2022 INTRODUCTION Carcinoma of the lungs, one of the most common malignant tumors worldwide, is the major cause of cancer-related
deaths1. Most patients (more than 75%) are in middle–advanced stage when diagnosed, therefore, optimal therapeutic opportunities are unavailable2. Furthermore, the 5-year survival rate of
patients with lung carcinoma is particularly low (about 15%). The poor prognosis of lung cancer is caused by lack of early diagnosis, thus screening to ensure early diagnosis is in urgent
need of improvement. As most tumor markers are not specific to a particular tumor, it is inadequate to diagnose cancer using only a single marker. In order to improve lung cancer screening,
it is necessary to simultaneously detect multiple tumor markers3. Small cell lung cancer, the most malignant subtype of lung cancer, develops very fast, metastasizes in the early stage, and
the prognosis is very poor. In addition, small cell lung cancer is sensitive to radiation treatment and chemotherapy and if diagnosed at an early stage, and the median survival could be up
to 24.1 months. However, only 5% of the patients are diagnosed early, therefore choosing effective tumor markers for early diagnosis is very important4. Neuron specific enolase (NSE), a
glycolytic enzyme, is mainly found in neurons and peripheral nerve endocrine tissue, and is a sensitive and specific marker associated with small cell lung cancer5. The level of NSE in
healthy individuals is <15.0 ng/mL and 60–81% of patients with small cell lung cancer have abnormally high levels6. At present, NSE is one of the most important markers for the diagnosis
of small cell lung cancer. The positive serum NSE level in patients with small cell lung cancer was 72.4%, which was higher than that in patients with squamous cell carcinoma and
adenocarcinoma (35.7% and 36.1%, respectively)7. Carcinoembryonic antigen (CEA) is a glycoprotein involved in cell adhesion, is normally generated during fetal development, and production
stops before birth. CEA is used as a tumor marker in a variety of tumors, and plays an important role in the diagnosis and prognosis of lung cancer and 30% to 70% of patients with lung
cancer have abnormally high levels of CEA8. When either NSE or CEA was detected, the sensitivity was relatively low and the specificity was poor for the diagnosis of small cell lung cancer.
Thus, the detection of either serum NSE or serum CEA may not have obvious value for the early diagnosis of small cell lung cancer, and the simultaneous detection of then may improve the
accuracy of lung cancer diagnosis9,10. A variety of approaches have been proposed in the past few years to detect NSE and CEA. For example, electrochemical immunoassay11,12,
chemiluminescence analysis13,14, fluorescence detection15,16, and enzyme-linked immunosorbent assay17. Most of these techniques require large and expensive instruments, complex operations,
long analysis time and professional expertise, which results in poor application in early screening. Thus, there is a need to develop a simple, sensitive, low cost and rapid approach for the
simultaneous detection of multiple tumor markers. The lateral flow immunoassay is a popular diagnostic method that can rapidly provide _in vitro_ diagnostic results by non-trained personnel
at a patient site. Due to its simplicity, speed, and no need for highly-qualified personnel, lateral flow immunoassay has been widely used in numerous fields, such as the detection of serum
proteins (tumor markers, cardiac markers), pathogenic agents (bacteria, parasites, viruses), environmental pollutants, and drugs. The lateral flow immunoassay usually utilizes colloidal
gold, fluorescent material or magnetic nanoparticles as its label. Recently, a lateral flow immunoassay based on colloidal gold nanoparticles has attracted attention due to its simplicity,
short analysis time and straightforward readout18. However, the limit of detection of the colloidal gold-based lateral flow test strip does not satisfy the requirements and only provides
qualitative or semi-quantitative analysis due to simple equipment and naked eye observations. Nowadays, optical detection of the intensity of fluorescence labels such as quantum dots19, near
infrared dyes18,20, gold nanoclusters21,22 and upconversion nanomaterials23, have been widely used in lateral flow immunoassay. During the detection, optical signals can be influenced by
specular reflection, scattering, self-absorption, and the fluorescence signal can be quenched, which is unfavorable for batch production and preservation. In addition, the fluorescence
probes require complex purification/separation procedures, which may limit their large-scale application in lateral flow immunoassay. Moreover, at most 10 μm at the top of the nitrocellulose
membrane, which is a few hundred micrometers thick, is measured by a signal reader or the naked eye, thus effective information in the test line cannot be obtained. Due to the absence of a
magnetic background and photo-bleaching in analyte samples, the lateral flow test strip based on magnetic nanoparticles exhibit a high “signal-to-noise” ratio and maintain a stable signal
compared to the color-based or optical-based lateral flow test strip24. The lateral flow immunoassay based on magnetic nanoparticles can be manipulated with an external magnetic field for
magnetic separation, which can enhance the efficiency and diminish the assay time25. The lateral flow immunoassay provides quantitative results by measuring the magnetic signal of the test
zone using a magnetic assay reader26, which improves the sensitivity and provides a better means of quantification27. Based on the above advantages, it is possible to use lateral flow test
strip based on magnetic nanoparticles for the detection of NSE and CEA. This type of study has not been reported previously. In this study, a kind of carboxyl-modified(COOH–) magnetic
nanobeads with high saturation magnetization were used as a probe to establish an immunomagnetic nanobeads-based lateral flow test strip for the simultaneous detection of NSE and CEA. This
immunoassay system not only accurately analyzed NSE and CEA separately, but also had no obvious influence on NSE and CEA when detected simultaneously. This technique exhibited satisfactory
results when clinical serum samples were used to evaluate the sensitivity and specificity of this test strip and the results showed good agreement with those using a commercial
electrochemiluminescent immunoassay kit. This novel lateral flow test strip provides an easy, rapid simultaneous quantitative detection strategy for NSE and CEA in serum, and is suitable for
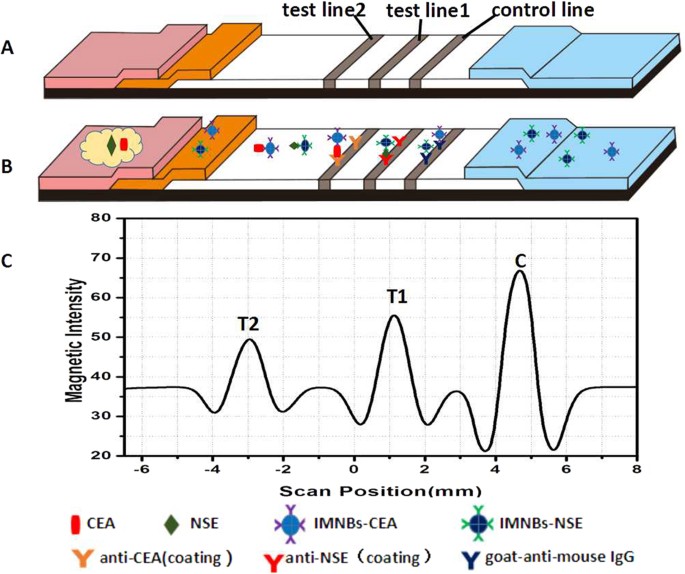
development in point-of-care testing. RESULTS AND DISCUSSION PRINCIPLE OF THE METHOD The principle of the immunomagnetic nanobeads-based lateral flow test strip was based on the
antigen–antibody reaction to form a sandwich format. As illustrated in Fig. 1, the antibodies of NSE and CEA were immobilized on the nitrocellulose membrane as test line 1 and test line 2.
When the liquid sample migrated to the conjugate pad, the immunomagnetic probes of NSE and CEA dissolved and bounded with the target analytes. The formed complexes migrated to the membrane
and were captured by test lines. The residual conjugates continued to migrate along the membrane and were captured by the control line, which served as the internal control. In contrast
assay, PBS with no analyte was used as the control. If the control line could not be seen, the strip was identified invalid. After appropriate immunoreaction time, a cartridge packaging test
strip was inserted into the magnetic assay reader to detect the magnetic signal of the T lines and C line. Data were reported as the intensity of the magnetic signal which was proportional
to the amount of immune complexes formed in the T lines or C line, as show in Fig. 1C. To quantitatively analyze NSE and CEA, the ratio of the intensity of T/C was used for measurement to
offset the background and inherent heterogeneity of the test strip. On the basis of the above, standard curves were plotted using the proportional relationship between the concentration of
analytes and the T/C. CHARACTERIZATION OF THE IMMUNOMAGNETIC PROBES The magnetic nanobeads were synthesized in our laboratory, and the morphology of the final product was characterized with
transmission electron microscopy. A particle sizing system was used to determine their hydrodynamic diameter and zeta potential, and the Quantum Design PPMS-9 T (EC-II) system was used to
determine their magnetic properties. Transmission electron microscopy revealed that magnetic nanobeads were monodispersed, spherical in shape, and had an average diameter of 80 nm (Fig. 2A).
The hydrodynamic size distribution and zeta potential of the magnetic nanobeads before and after labeling with antibody were measured using a particle sizing system. As shown in Fig. 2B,
due to the thickness of the hydrated layer on the nanobeads surface, the hydrodynamic size was much larger than that displayed by transmission electron microscopy. The hydrodynamic size of
free nanobeads was 150 nm, and the diameter increased to 175 nm and 168 nm after conjugation with anti-NSE monoclonal antibody and anti-CEA monoclonal antibody, respectively, and there was
no aggregation during the coupling reaction. Because of the abundant carboxyl groups on their surfaces, the magnetic nanobeads had a negative surface charge. The zeta potential is a key
indicator of the stability of the system dispersion, and a high zeta potential (±30 mV) will confer stability. The average zeta potential of free nanobeads was approximately −27.58 ± 0.23
mV, and changed to −20.5 ± 0.19 mV and −22.4 ± 0.22 mV after conjugation with antibody of NSE and CEA, respectively. The high level of surface potential ensured that the nanobeads were
monodispersed during electrostatic repulsion. In order to confirm the binding of the magnetic nanobeads and antibodies, ultraviolet absorption spectra of magnetic nanobeads before and after
coupling were detected using an ultraviolet spectrophotometer. As shown in Fig. 2C, the free nanobeads has no absorption peak when scanned at a wavelength range of 200–800 nm. We know that
the absorption peak of the pure protein was located at 280 nm. The spectrum of the magnetic probes had an absorption peak at 270 nm after conjugation with antibodies, indicating the presence
of an antibody coating, and the protein absorption peak showed a slight hypsochromic shift after coupling to the nanobeads (from 280 nm to 270 nm). As shown in Fig. 2D, the magnetization
curves show that the saturation magnetization of free magnetic nanobeads was 80 emu/g, and maintained a high magnetism value of 67 emu/g after conjugation with the antibody. When a magnetic
scaffold was used to separate the magnetic nanobeads, the magnetic nanobeads totally aggregated within 30 s. This magnetic property indicates that the magnetic nanobeads had a strong
magnetic responsivity, which is an advantage in magnetic separation and is easily recovered after an external magnetic field is applied. The aforementioned characterization indicates that
the antibodies had combined with the magnetic nanobeads and that the immunomagnetic probes did not aggregate during coupling and were stably dispersed in solution. OPTIMIZATION OF
EXPERIMENTAL PARAMETERS CHOICE OF MAGNETIC NANOBEADS SIZE In order to improve the assay performance, a series of optimization steps were carried out. Firstly, three types of magnetic
nanobeads of different sizes (15 nm, 80 nm and 200 nm) were chosen to optimize assay performance. As shown in Fig. 3A, the best results were obtained with 80 nm nanobeads, with obvious
signals at both the test line and the control line. There was a substantial signal at the border between the conjugate pad and the nitrocellulose membrane when 200 nm particles were used,
probably because the 200 nm particles were too big to migrate via the nitrocellulose membrane. When the 15 nm particles were used, the signal at the T line was not observed in the positive
samples, because the capillary speed was too fast, and there was not enough time for the antigen-antibody binding reaction. In addition, when the magnetic scaffold was used to separate the
magnetic nanobeads, the degree of aggregation of 15 nm magnetic nanobeads was still very poor after 30 min, and when 80 nm or 200 nm particles were used, total aggregation was observed
within 30 s (Fig. 3B). This may have been because the force exerted by the magnetic field was related to the diameter of the magnetic nanobeads and had a third-power relationship with the
diameter28. Thus, 15 nm particles require more time for separation by the same magnetic field. We also tried to separate the 15 nm particles by centrifugation, but the separation efficiency
was very poor, and a large number of particles were lost. Therefore, the 80 nm magnetic nanobeads were considered optimum for the lateral flow immunoassay. VOLUME OF THE STANDARD ANTIGEN In
order to ensure smooth performance of the lateral flow test and the consumption of serum was minimum, the volume of the standard antigen (50 ng/mL) was investigated by adding 40, 60, 80, and
100 μL to the sample pad, respectively. When 100 μL of solution was added, the immunomagnetic probes were stranded on the nitrocellulose membrane and did not migrate towards the absorbent
pad, as the amount of liquid was greater than the absorption ability. A sample volume of 40 μL was subsequently investigated. The magnetic probes were not successfully released from the
conjugate pad, resulting in weak signals of both T lines and the C line. Thus, the 40 μL volume may have been too small to dissolve the probes and migrate to the nitrocellulose membrane.
When the 60 μL and 80 μL volumes were used for detection, the magnetic probes migrated along the nitrocellulose membrane smoothly, and both T lines and the C line showed strong signals.
Therefore, the 60 μL volume was chosen as the optimal sample volume for subsequent experiments based on the above results. OPTIMUM AMOUNT OF ADDED ANTIBODY The BCA protein assay kit was used
to calculate the immobilization efficiency. During this procedure, different concentrations of the standard protein was used to construct a standard curve. The standard curve was y =
140.51x − 1.5098 (R2 = 0.99531), where y is the protein absorbance and x is the protein concentration. From the standard curve, we calculated the residual antibody in the supernatant liquid,
and the amount of antibody coating the magnetic probe could be calculated indirectly. The improvement in the immobilization efficiency improved the sensitivity of this test, which has been
verified in our previous experiments. To improve the immobilization efficiency, and save on the cost of antibodies at the same time, the amount of antibodies added to the coupling reaction
was optimized. Figure 4A shows the relationship between the amount of antibodies on magnetic probes and the amount of antibody added to the reaction tube. The amount of antibodies on
magnetic probes increased when the amount of antibody added to the reaction tube increased. However, when the antibodies in the reaction tube varied between 0.4–0.8 mg/mL, the increase in
the antibodies on the probes was not statistically significant (_P _> 0.05). Therefore, we chose 0.4 mg/mL as the optimal concentration of antibody for the coupling reaction. When the
optimal concentration of antibody was 0.4 mg/mL, the amount of antibody coating the magnetic nanobeads was 70 μg for NSE, and 65 μg for CEA. THE AMOUNT AND RATIO OF NSE PROBES AND CEA PROBES
ON THE CONJUGATE PAD The intensity of the magnetic signal depends on the amount of magnetic probes captured by the test lines, thus the amount and ratio of NSE probes and CEA probes on the
conjugate pad would affect the signal of the T lines and should be optimized. In this part, a volume of 60 μL was used, and the analyte concentration was 50 ng/mL for both NSE and CEA. The
prepared probes of NSE and CEA were mixed at different concentration ratios and then applied to the conjugate pad to fabricate a series of test strip. We found that the magnetic signals were
strongest both for NSE and CEA, when the concentration ratio of NSE probes and CEA probes was 1.2:1.0, and the amount of probes was 10 μL. According to the results of previous experiments,
we found that the antigen–antibody combining ability of NSE was weaker than that of CEA. Therefore, the amount of NSE probe was slightly greater than that of CEA probe. We also discovered
that both too many and too few magnetic probes could degrade the accuracy of quantitation. If there are too few probes on the conjugate pad, most of the analytes in the sample would not be
involved in the immunoreaction, resulting in a decrease in detection sensitivity. However, a large number of probes will result in a high magnetic background leading to poor quantitative
detection, because the excess probes are distributed on the membrane uniformly and impact the signal of the test lines and control line. THE AMOUNT OF ANTI-NSE (COATING) AND ANTI-CEA
(COATING) ON THE TEST LINES To increase the sensitivity of the lateral flow test strip and to decrease the cost of reagents, the amount of antibody on the test lines was optimized by
depositing different concentrations (1.0, 1.5, 2.0, 2.5 and 3.0 mg/mL) of antibody onto the test lines. For this assay, the optimal sample volume of 60 μL was used, and the analyte
concentration was 50 ng/mL both for NSE and CEA. The relationships between the magnetic intensity T/C and concentration of antibodies at the test lines are shown in Fig. 4B. With an increase
in the antibody concentration, the T/C ratio increased. However, when the concentrations increased from 2.5 to 3.0 mg/mL for NSE and from 2.0 to 3.0 mg/mL for CEA, the increase in the
magnetic intensity T/C was not significant (_P_ > 0.05). Therefore, the optimal antibody concentration was 2.5 mg/mL for NSE and 2.0 mg/mL for CEA considering the reagent consumption.
QUANTIFICATION OF CEA AND NSE USING THE MAGNETIC LATERAL FLOW TEST STRIP Following successful fabrication of the lateral flow test strip, we used the strip for the simultaneous
quantification of NSE and CEA. The standard curves of NSE and CEA were constructed based on the measurement of different concentrations of analyte standards (1.0, 2.5, 5.0, 10.0, 25.0, 50.0
and 100.0 ng/mL), which were prepared in standard dilution buffer. When different concentrations of the antigen were detected, there was a brown band appeared on test line, and the color of
the band gradually intensified as the antigen concentration increased. Therefore, it provides a qualitative or semiquantitative measure visible to the naked eye. The limit of detection by
the naked eye was 1.0 ng/mL for NSE and 0.5 ng/mL for CEA. The color changes in the T lines at different concentrations were not obvious to the naked eye (Fig. 5A and B), but when the
magnetic signal was recorded with a magnetic assay reader, the signal gradually intensified with an increase in concentration (Fig. 5C and D). The magnetic assay reader uses a C-shaped
electromagnet to magnetize magnetic probes. During the measurement, this magnetization is measured with an array of thin-film induction coils. Because the magnetization is proportional to
the amount of probe trapped in the test zone, the magnetic assay reader can calculate the concentration of the analyte and provide a quantitative value for the assay. The magnetic strength
at different positions on the nitrocellulose membrane is shown as the magnetic scan profile. After recording the magnetic signal, the standard curve was obtained by plotting the linearity of
T/C against the concentration of NSE or CEA. As represented by the equation in Fig. 6A, the linear equation for NSE was y = 0.01709x + 0.32454 (R2 = 0.99798), and for CEA was y = 0.02689x +
0.0785 (R2 = 0.99743). The linear correlation coefficients (R2) were relatively high, allowing the easy determination of the NSE and CEA concentrations in an unknown serum sample. The limit
of detection was calculated to be 0.094 ng/mL for NSE and 0.045 ng/mL for CEA. The coefficients of variation were all <10% (n = 5) at each concentration of both CEA and NSE, which showed
an acceptable level of reproducibility for simultaneous quantification of NSE and CEA. EVALUATION OF CROSS-REACTIVITY The specificity of the antibody is an important factor in immune
detection. In order to estimate the specificity of the lateral flow test strip, cross-reactivity tests between the target analytes and the interference (AFP and CA125, two of the most common
tumor markers in clinical diagnosis) were performed. As shown in Fig. 6B, when the assay was conducted with only one antigen (NSE or CEA), only one test line (T1 or T2) appeared. When
detecting AFP or CA125, neither test line 1 nor test line 2 was observed, this was similar to when PBS was used as the blank control. We then used the serum to verify the cross-reaction, and
the results were consistent with those using standard antigens. These negligible cross-reactivity results demonstrated that the effect of interference was insignificant, and both NSE and
CEA could be detected simultaneously with no obvious influence on each other. DETECTION IN CLINICAL HUMAN SERUM SAMPLES To evaluate the potential of the proposed method for clinical
application, 130 clinical samples (100 positive and 30 negative) were quantitative analyzed by the proposed test strip, and accurate values of the analytes could be obtained. The actual
detection limits for serum were 0.75 ng/mL and 0.40 ng/mL for NSE and CEA, respectively. Accurate values for NSE and CEA in clinical serum also were obtained with an electrochemiluminescence
immunoassay kit, and the serum levels of 15.0 ng/mL for NSE and 5.0 ng/mL for CEA were regarded as the positive thresholds for a clinical diagnoses29. As shown in Table 1, this method had a
sensitivity of 97% and 95% for NSE and CEA, and a specificity of 87% and 93%, respectively. In order to compared the quantitative results between the lateral flow test strip and the
commercial electrochemiluminescence immunoassay kit, the results of 30 serum samples were chosen randomly to confirm the consistency. Good agreement between the two methods could be
observed, and the correlation (n = 30, R2 = 0.9926, _P_ < 0.001) of NSE and (n = 30, R2 = 0.9922, _P_ < 0.001) of CEA values were considered excellent (Supplementary Fig. 1). A series
of negative human serum samples were spiked with different concentrations (5.0, 25.0, 50.0 ng/mL) of NSE and CEA in a spiked recovery experiment to evaluate the accuracy of this assay. As
shown in Table 2, the recovery rates for the spiked NSE and CEA samples were 94.4%–106.0% and 96%–104.8%, respectively (n = 5). The relative standard deviations were 2.7%–5.9% for NSE and
2.5%–5.2% for CEA. These results indicated that the lateral flow test strip exhibited high accuracy and can be used in clinical analysis. CONCLUSIONS In this study, a dual immumomagnetic
nanobeads-based lateral flow test strip was successfully constructed and validated which simultaneously and quantitatively detected NSE and CEA. This novel analysis platform has the
advantage of speed, low cost and high sensitivity for simultaneous analysis. Under optimal conditions, the limits of detection for the quantitative detection of NSE and CEA were as low as
0.094 ng/mL and 0.045 ng/mL, respectively. The results of cross-reactivity tests showed that interference had insignificant effects on the analytes, and NSE and CEA were simultaneously
detected without influencing each other. The accuracy of the lateral flow test strip validated using spiked human serum met the requirements for quantitative analysis, and the results using
clinical samples also demonstrated that the lateral flow test strip was reliable for measuring multiple tumor markers. According to the aforementioned results, this assay would be helpful in
the early diagnosis of lung cancer in medical institutions, and may be a good choice for point of care testing. Future work will further extend the capability of this method by
simultaneously detecting additional multiple tumor markers on individual test lines. MATERIAL AND METHODS CHEMICALS AND EQUIPMENT The carboxyl-modified (COOH–) magnetic nanobeads (80 nm)
were synthesized in our laboratory. The goat anti-mouse IgG antibody, NSE corresponding monoclonal antibodies (L1C00501 and L1C0050503), mouse anti-CEA monoclonal antibodies (L1C00205 and
L1C00202), and standard antigens (NSE, CEA, AFP and CA125) were all purchased from Shanghai Linc-Bio Science Co., Ltd., Shanghai, China. Bovine serum albumin (BSA),
2-(N-morpholino)ethanesulfonic acid (MES), 1-ethyl-3-(3-dimethyllaminopropyl)-carbodiimide hydrochloride (EDC) and N-hydroxy-succinimide (NHS) were obtained from Aladdin (Los Angeles, CA,
USA). Deionized water was used in the experiments. Other reagents and solvents were of analytical grade, and the nitrocellulose membrane (Millipore 75, Millipore 90) were provided by Jiening
Biological Technology Co., Ltd., Shanghai, China. The conjugate pad (glass fiber membrane, Ahlstrom 8964), sample pad (glass fiber membrane, GL-b01), adsorbent pad, and the polyvinyl
chloride plate were supplied by Shanghai JieYi Biotechnology Co., Ltd., Shanghai, China. The magnetic assay reader was purchased from Magna Bioscience LLC (San Diego, CA, USA). The magnetic
separation rack was from Hon-Pro Technology Development Co., Ltd., Shenzhen, China, and the XYZ dispensing system (XYZ3060) was purchased from BioDot Inc., Irvine, CA, USA. The vortex mixer
and incubator were commonly used equipment in the laboratory. The clinical serum samples were from Zhujiang Hospital, Southern Medical University, Guangzhou, China. PREPARATION OF MAGNETIC
NANOBEADS Water soluble magnetic nanobeads with carboxyl groups were synthesized using a modified one-step hydrothermal synthesis method30. Briefly, citrate as a surface ligand was dissolved
to form a clear solution, and then vitamin C as the reducing agent was added immediately after the addition of ferrous sulfate. The mixture was sealed, placed in an autoclave and heated at
200 °C for 10 h. When the product had cooled to room temperature, a purification step was performed by magnetic separation. The powder product was then collected by vacuum drying. Morphology
of the final product was characterized by transmission electron microscopy, a particle sizing system was used to determine hydrodynamic diameter and zeta potential, and a Quantum Design
PPMS-9 T (EC-II) system was used to determine magnetic properties. PREPARATION OF THE IMMUNOMAGNETIC PROBES FOR CEA AND NSE The antibodies were immobilized with the classical EDC/NHS method.
One milligram of magnetic nanobeads was suspended in 250 μL of activated buffer (0.01 M MES, pH = 5.5). Then, 2.5 mg of EDC and 2.5 mg of NHS were added to the solution. Following
activation for 30 min, the excess EDC and NHS were removed via magnetic separation. Then 250 μL of conjugating buffer (pH = 9.0, 0.005 M) was added to re-suspend the activated magnetic
nanobeads. Subsequently, 0.1 mg antibody of NSE (L1C00505) or antibody of CEA (L1C00202) was added to the activated magnetic nanobeads solution. The mixture was incubated in a horizontal
shaker for 3 h at 37 °С. Following a magnetic washing step, 250 μL blocking buffer (containing 10% BSA) was added and reacted for 1 h at room temperature. The probes were magnetically washed
twice with BST buffer (pH 8.0), and re-suspended in 500 μL of BST and stored at 4 °C for further use. FABRICATION OF MAGNETIC LATERAL FLOW TEST STRIP The magnetic lateral flow test strip
was composed of a sample pad, conjugate pad, nitrocellulose membrane, and absorbent pad. The conjugate pad was immersed in treatment buffer containing 5% sucrose and 2% trehalose, and the
sample pad was treated with treatment buffer containing 2% NaCl, 0.5% BSA, and 0.1% polyvinylpyrrolidone, and then dried at 37 °C overnight. The prepared probes for CEA and NSE were mixed at
the desired ratio and dispensed onto the conjugate pad, then dried at 37 °C overnight and stored at 4 °C. To prepare the test lines and control line, 2.5 mg/mL solution of NSE antibody
(L1C00501) and 2 mg/mL solution of CEA antibody (L1C00205) were immobilized on the nitrocellulose membrane as test line 1 and test line 2. Goat anti-mouse IgG at the concentration of 1 mg/mL
was coated as the control line. After immobilization, the nitrocellulose membrane was dried at 37 °C in the oven for 1 h. All the components of the test strip were attached onto a polyvinyl
chloride plate with appropriate overlaps (usually 1–2 mm) to ensure that the sample solution could migrate through the whole test strip. The assembled strip was then cut to a width of 3 mm
and length of 80 mm using an automated cutter and stored in a dry sealed box at 4 °C for further use. ASSAY PROCEDURE To perform the magnetic assay, the prepared test strip was placed on a
clean horizontal platform, 60 μL sample solution containing NSE and CEA was dropped onto the sample pad and migrated along the strip under capillary action. PBS without NSE and CEA was used
as control and each sample test was repeated for 3 times under the same condition. After appropriate immunoreaction time, the test strip was placed into the magnetic assay reader, followed
by recording magnetic intensity of the test lines and control line to quantify the analytes. CLINICAL SAMPLES The study was approved by the Medical Ethics Committee of the Southern Medical
University, Guangzhou, China. All patients signed an informed consent and all methods were performed in accordance with the relevant guidelines and regulations. A total of 130 serum samples
taken from patients were collected from Zhujiang Hospital, Southern Medical University, including 100 positive and 30 negative serum samples. All samples were stored at −80 °C until
analyzed. Accurate values for NSE and CEA were obtained with a commercial electrochemiluminescence immunoassay kit. STATISTICAL ANALYSIS For each experiment, at least three replicates were
performed, and the data were presented as mean ± standard deviation. Statistical consistency was evaluated with a consistency check. Statistical significance was set at _P_ < 0.01. All
data were analyzed by SPSS 21.0, and diagrams were generated with Origin Pro 8.0. ADDITIONAL INFORMATION HOW TO CITE THIS ARTICLE: Lu, W. _et al_. Dual Immunomagnetic Nanobeads-Based Lateral
Flow Test Strip for Simultaneous Quantitative Detection of Carcinoembryonic Antigen and Neuron Specific Enolase. _Sci. Rep._ 7, 42414; doi: 10.1038/srep42414 (2017). PUBLISHER'S NOTE:
Springer Nature remains neutral with regard to jurisdictional claims in published maps and institutional affiliations. REFERENCES * Huang X. E. Interpretation of NCCN Guidelines:General
Therapies on Non-small Cell Lung Cancer (Version 6. 2015). _Journal of International Translational Medicine_. 145–50 (2015). * Liao, Y. C. et al. Quality of life and related factors in
patients with newly diagnosed advanced lung cancer: a longitudinal study. _ONCOL NURS FORUM_. 41, E44–E55 (2014). Article Google Scholar * Ban, E., Chae, D. K. & Song, E. J.
Simultaneous detection of multiple microRNAs for expression profiles of microRNAs in lung cancer cell lines by capillary electrophoresis with dual laser-induced fluorescence. _J CHROMATOGR
A_. 1315, 195–199 (2013). Article CAS Google Scholar * Jackman, D. M. & Johnson, B. E. Small-cell lung cancer. _The Lancet_. 366, 1385–1396 (2005). Article CAS Google Scholar *
Cooper, E. H. & Splinter, T. A. W. Neuron-specific enolase (NSE): A useful marker in small cell lung cancer. _Lung Cancer._ 3, 61–66 (1987). Article Google Scholar * Shibayama, T. et
al. Complementary roles of pro-gastrin-releasing peptide (ProGRP) and neuron specific enolase (NSE) in diagnosis and prognosis of small-cell lung cancer (small cell lung cancer). _LUNG
CANCER._ 32, 61–69 (2001). Article CAS Google Scholar * Zhao, W. & Luo, J. F. Serum Neuron-Specific Enolase Levels were Associated with the Prognosis of Small Cell Lung Cancer: A
Meta-Analysis. _Tumour Biol._ 34, 3245–3248 (2013). Article CAS Google Scholar * Okamura, K. et al. Diagnostic Value of CEA and CYFRA 21-1 Tumor Markers in Primary Lung Cancer. _LUNG
CANCER._ 80, 45–49 (2013). Article Google Scholar * Kulpa, J., Wojcik, E., Reinfuss, M. & Kolodziejski, L. Carcinoembryonic Antigen, Squamous Cell Carcinoma Antigen, CYFRA 21-1, and
Neuron-Specific Enolase in Squamous Cell Lung Cancer Patients. _CLIN CHEM._ 48, 1931–1937 (2002). CAS PubMed Google Scholar * Wang, C. Y., Huang, M. S., Huang, M. H., Lee, H. C. &
Hsu, H. S. Persistently High Serum Carcinoembryonic Antigen Levels After Surgery Indicate Poor Prognosis in Patients with Stage I Non-Small-Cell Lung Cancer. _J SURG RES_. 163, e45–e50
(2010). Article Google Scholar * Cai, X. et al. Ratiometric Electrochemical Immunoassay Based On Internal Reference Value for Reproducible and Sensitive Detection of Tumor Marker. _BIOSENS
BIOELECTRON_. 81, 173–180 (2016). Article CAS Google Scholar * Pei, X., Chen, B., Li, L., Gao, F. & Jiang, Z. Multiplex Tumor Marker Detection with New Chemiluminescent Immunoassay
Based On Silica Colloidal Crystal Beads. _ANALYST_. 135, 177–181 (2010). Article CAS ADS Google Scholar * Fu, X. et al. Chemiluminescence enzyme immunoassay using magnetic nanoparticles
for detection of neuron specific enolase in human serum. _Analytica chimica acta_. 722, 114–118 (2012). Article CAS Google Scholar * Dungchai, W. et al. Development of a Sensitive
Micro-Magnetic Chemiluminescence Enzyme Immunoassay for the Determination of Carcinoembryonic Antigen. _ANAL BIOANAL CHEM_. 387, 1965–1971 (2007). Article CAS Google Scholar * Li, H.,
Cao, Z., Zhang, Y., Lau, C. & Lu, J. Simultaneous Detection of Two Lung Cancer Biomarkers Using Dual-Color Fluorescence Quantum Dots. _ANALYST_. 136, 1399–1405 (2011). Article CAS ADS
Google Scholar * Wang, C., Hou, F. & Ma, Y. Simultaneous quantitative detection of multiple tumor markers with a rapid and sensitive multicolor quantum dots based
immunochromatographic test strip. _Biosensors & bioelectronics_. 68, 156–162 (2015). Article CAS Google Scholar * Selman, L. et al. An Enzyme-Linked Immunosorbent Assay (ELISA) for
Quantification of Human Collectin 11 (CL-11, CL-K1). _J IMMUNOL METHODS_. 375, 182–188 (2012). Article CAS Google Scholar * Parolo, C. et al. Enhanced lateral flow immunoassay using gold
nanoparticles loaded with enzymes. _Biosensors & bioelectronics_. 40, 412–416 (2013). Article CAS Google Scholar * Yan, X. et al. CdSe/ZnS Quantum Dot-Labeled Lateral Flow Strips for
Rapid and Quantitative Detection of Gastric Cancer Carbohydrate Antigen 72-4. _NANOSCALE RES LETT_. 11, 138 (2016). Article ADS Google Scholar * Chen, Y. et al. Near-infrared
fluorescence-based multiplex lateral flow immunoassay for the simultaneous detection of four antibiotic residue families in milk. _Biosensors & bioelectronics_. 79, 430–434 (2016).
Article CAS Google Scholar * Zhang, C. et al. Gold Nanoclusters-Based Nanoprobes for Simultaneous Fluorescence Imaging and Targeted Photodynamic Therapy with Superior Penetration and
Retention Behavior in Tumors. _ADV FUNCT MATER_. 25, 1314–1325 (2015). Article CAS Google Scholar * Alonso, M. C., Trapiella-Alfonso, L., Fernandez, J. M., Pereiro, R. & Sanz-Medel,
A. Functionalized Gold Nanoclusters as Fluorescent Labels for Immunoassays: Application to Human Serum Immunoglobulin E Determination. _BIOSENS BIOELECTRON_. 77, 1055–1061 (2016). Article
CAS Google Scholar * Sun, R. et al. Potassium sodium tartrate-assisted hydrothermal synthesis of BaLuF5:Yb3+/Er3+ nanocrystals. _Particuology_. 24, 164–169 (2016). Article CAS Google
Scholar * Workman, S. et al. Rapid Detection of HIV-1 P24 Antigen Using Magnetic Immuno-Chromatography (MICT). _J VIROL METHODS_. 160, 14–21 (2009). Article CAS Google Scholar * Handali,
S. et al. Development and Evaluation of a Magnetic Immunochromatographic Test to Detect Taenia Solium, Which Causes Taeniasis and Neurocysticercosis in Humans. _CLIN VACCINE IMMUNOL_. 17,
631–637 (2010). Article CAS Google Scholar * Chen, Y. et al. Rapid Detection and Quantification of Tumor Marker Carbohydrate Antigen 72-4 (CA72-4) Using a Superparamagnetic
Immunochromatographic Strip. _ANAL BIOANAL CHEM_. 408, 2319–2327 (2016). Article CAS Google Scholar * Orlov, A. V., Bragina, V. A., Nikitin, M. P. & Nikitin, P. I. Rapid Dry-Reagent
Immunomagnetic Biosensing Platform Based On Volumetric Detection of Nanoparticles On 3D Structures. _BIOSENS BIOELECTRON_. 79, 423–429 (2016). Article CAS Google Scholar * Chen, Y. et al.
One-Step Detection of Pathogens and Cancer Biomarkers by the Naked Eye Based On Aggregation of Immunomagnetic Beads. _NANOSCALE_. 8, 1100–1107 (2016). Article CAS ADS Google Scholar *
Franklin, W. A. et al. Pathology, Biomarkers, and Molecular Diagnoistics. In: Niederhuber J. E., Armitage J. O., Doroshow J. H., Kastan M. B., Tepper J. E. Eds. _Abeloff’s Clinical
Oncology_. 5Th Ed. Philadelphia, PA, Elsevier Churchill Livingstone (2014). * Xiao, L. et al. Water-Soluble Superparamagnetic Magnetite Nanoparticles with Biocompatible Coating for Enhanced
Magnetic Resonance Imaging. _ACS NANO._ 5, 6315–6324 (2011). Article CAS Google Scholar Download references ACKNOWLEDGEMENTS We are grateful for the financial support by the National
Natural Scientific Foundation of China (Grant No. 81571835 and 61503246), National Key Basic Research Program (973 Project) (No. 2015CB931802), the 863 High-Tech Project of China (No.
2014AA020700), Shanghai Science and Technology Fund (No. 13NM1401500 and 15DZ2252000). AUTHOR INFORMATION AUTHORS AND AFFILIATIONS * Outpatient Department, Zhujiang Hospital, Southern
Medical University, 253 Gongye Road, Guangzhou, 510280, Guangdong, China Wenting Lu, Xinyu Yan, Yanrong Chen & Jinghua He * School of Electronic Information and Electrical Engineering,
Shanghai Jiao Tong University, Shanghai, 200240, China Kan Wang, Kun Xiao, Weijian Qin, Yafei Hou & Daxiang Cui * Shanghai Engineering Research Center for Intelligent Diagnosis and
Treatment Instruments, Shanghai, 200240, China Kan Wang & Daxiang Cui * School of Naval Architecture, Ocean & Civil Engineering, Shanghai Jiao Tong University, Shanghai, 200240,
China Hao Xu Authors * Wenting Lu View author publications You can also search for this author inPubMed Google Scholar * Kan Wang View author publications You can also search for this author
inPubMed Google Scholar * Kun Xiao View author publications You can also search for this author inPubMed Google Scholar * Weijian Qin View author publications You can also search for this
author inPubMed Google Scholar * Yafei Hou View author publications You can also search for this author inPubMed Google Scholar * Hao Xu View author publications You can also search for this
author inPubMed Google Scholar * Xinyu Yan View author publications You can also search for this author inPubMed Google Scholar * Yanrong Chen View author publications You can also search
for this author inPubMed Google Scholar * Daxiang Cui View author publications You can also search for this author inPubMed Google Scholar * Jinghua He View author publications You can also
search for this author inPubMed Google Scholar CONTRIBUTIONS W.L. jointly conceived the study with K.W. K.X., Y.H. and W.Q. performed experiments, W.L. performed all data analysis and wrote
the original draft of the manuscript. K.W., H.X., Y.C., X.Y., D.C. and J.H. reviewed and edited the manuscript. All authors reviewed the manuscript. CORRESPONDING AUTHORS Correspondence to
Kan Wang or Jinghua He. ETHICS DECLARATIONS COMPETING INTERESTS The authors declare no competing financial interests. SUPPLEMENTARY INFORMATION SUPPLEMENTARY INFORMATION (DOC 60 KB) RIGHTS
AND PERMISSIONS This work is licensed under a Creative Commons Attribution 4.0 International License. The images or other third party material in this article are included in the article’s
Creative Commons license, unless indicated otherwise in the credit line; if the material is not included under the Creative Commons license, users will need to obtain permission from the
license holder to reproduce the material. To view a copy of this license, visit http://creativecommons.org/licenses/by/4.0/ Reprints and permissions ABOUT THIS ARTICLE CITE THIS ARTICLE Lu,
W., Wang, K., Xiao, K. _et al._ Dual Immunomagnetic Nanobeads-Based Lateral Flow Test Strip for Simultaneous Quantitative Detection of Carcinoembryonic Antigen and Neuron Specific Enolase.
_Sci Rep_ 7, 42414 (2017). https://doi.org/10.1038/srep42414 Download citation * Received: 22 August 2016 * Accepted: 10 January 2017 * Published: 10 February 2017 * DOI:
https://doi.org/10.1038/srep42414 SHARE THIS ARTICLE Anyone you share the following link with will be able to read this content: Get shareable link Sorry, a shareable link is not currently
available for this article. Copy to clipboard Provided by the Springer Nature SharedIt content-sharing initiative