- Select a language for the TTS:
- UK English Female
- UK English Male
- US English Female
- US English Male
- Australian Female
- Australian Male
- Language selected: (auto detect) - EN
Play all audios:
ABSTRACT Suffering an acute spinal cord injury (SCI) can result in catastrophic physical and emotional loss. Efforts to translate novel therapies in acute clinical trials are impeded by the
SCI community’s singular dependence upon functional outcome measures. Therefore, a compelling rationale exists to establish neurochemical biomarkers for the objective classification of
injury severity. In this study, CSF and serum samples were obtained at 3 time points (~24, 48, and 72 hours post-injury) from 30 acute SCI patients (10 AIS A, 12 AIS B, and 8 AIS C). A
differential chemical isotope labeling liquid chromatography mass spectrometry (CIL LC-MS) with a universal metabolome standard (UMS) was applied to the metabolomic profiling of these
samples. This method provided enhanced detection of the amine- and phenol-containing submetabolome. Metabolic pathway analysis revealed dysregulations in arginine-proline metabolism
following SCI. Six CSF metabolites were identified as potential biomarkers of baseline injury severity, and good classification performance (AUC > 0.869) was achieved by using
combinations of these metabolites in pair-wise comparisons of AIS A, B and C patients. Using the UMS strategy, the current data set can be expanded to a larger cohort for biomarker
validation, as well as discovering biomarkers for predicting neurologic outcome. SIMILAR CONTENT BEING VIEWED BY OTHERS SERUM METABOLOME ASSOCIATED WITH SEVERITY OF ACUTE TRAUMATIC BRAIN
INJURY Article Open access 10 May 2022 THE LONGITUDINAL BIOCHEMICAL PROFILING OF TBI IN A DROP WEIGHT MODEL OF TBI Article Open access 14 December 2023 BRAIN-DEAD AND COMA PATIENTS EXHIBIT
DIFFERENT SERUM METABOLIC PROFILES: PRELIMINARY INVESTIGATION OF A NOVEL DIAGNOSTIC APPROACH IN NEUROCRITICAL CARE Article Open access 30 July 2021 INTRODUCTION Acute spinal cord injury
(SCI) often causes paralysis and severe disability, for which there are few treatments that even marginally improve neurologic outcome. In Canada, the incidence of acute traumatic SCI is
over 1,500 per year1, and the estimated annual economic impact of SCI is over $2 billion2. As such, SCI has emerged as a major public health issue in modern society and has prompted
considerable efforts to develop therapeutic strategies to improve neurologic outcome and reduce the burden of disability. Many of these efforts have focused on the acutely injured patient,
as it is expected that interventions applied at this early stage of injury afford the opportunity to reduce secondary injury and, through such ‘neuroprotection’, promote improved outcome.
Efforts to validate potential interventions in the acute SCI setting have been hampered by the reliance upon clinical assessments to quantify neurologic impairment after SCI and to stratify
the severity of injury. These assessments are imprecise predictors of neurologic recovery and are often impossible to even obtain in the acute setting due to intoxication/sedation or
concomitant injuries3. Biomarkers that objectively characterize injury severity and more precisely predict neurologic recovery would be extremely helpful in facilitating the evaluation of
novel treatments in acute SCI clinical trials. Additionally, the scientific development of novel therapies for acute SCI depends upon an understanding of the complex pathophysiologic
mechanisms that are triggered after acute SCI. Traumatic injury to the spinal cord induces multiple disturbances in the human metabolic network, including oxidative stress, glycolysis, and
amino acid and lipid metabolism4,5,6,7. Metabolomics is an emerging field for high-throughput global profiling of the collection of all metabolites in a biological system (i.e., the
metabolome). Such profiling may also identify metabolite candidates that can be utilized as potential biomarkers. While almost all of our understanding of the metabolite changes after SCI
has come from small animal models of SCI8,9,10,11, a global profiling of the metabolic network in response to acute _human_ SCI has not been previously reported. In this study, we describe a
parallel metabolomic profiling of cerebrospinal fluid (CSF) and serum from acute SCI patients using a newly developed chemical isotope labeling liquid chromatography mass spectrometry (CIL
LC-MS) platform with a universal metabolome standard (UMS)12. Our objectives were to characterize the metabolite changes that occur in these two biofluids in response to injury, and to
identify potential biomarkers of injury severity. We utilized dansylation LC-MS to enable relative quantification of the amine- and phenol-containing submetabolome with high coverage. With
the UMS, the data set reported herein can be expanded in the future by analyzing additional samples for biomarker validation as well as discovering prognostic biomarkers for predicting
neurologic recovery. RESULTS CLINICAL CHARACTERISTICS OF STUDY SUBJECTS We prospectively enrolled 30 acute traumatic SCI patients who had suffered a cervical or thoracolumbar injury (C3-L1)
in whom a valid baseline neurologic examination could be performed in accordance with the International Standards for Neurologic Classification of SCI (ISNCSCI). This clinical examination
was done typically within 24 hours of injury. The ISNCSCI examination and its scoring conventions are available from
http://asia-spinalinjury.org/wp-content/uploads/2016/02/International_Stds_Diagram_Worksheet.pdf and this form is also available from the corresponding authors upon request. The baseline
American Spinal Injury Association (ASIA) Impairment Scale (AIS) grade was A for 10 patients, B for 12, and C for 8. In general terms, AIS A denotes those with complete motor and sensory
paralysis (the most severe neurologic impairment), AIS B denotes those with complete motor paralysis but some preserved sensation, and AIS C is assigned when there is some preserved motor
and sensory function. A lumbar intrathecal catheter was inserted at the time of surgery and maintained for 3–5 days post-injury for the acquisition of serial CSF samples. CSF and serum
samples were obtained at 3 time points: approximately 24, 48, and 72 hours post-injury. The CSF and blood samples were drawn within a few minutes of one another and were processed,
centrifuged, and frozen at the bedside. The patients were examined clinically at 6 months post-injury to determine AIS grade and motor score recovery. METABOLOMIC ANALYSIS OF CSF AND SERUM
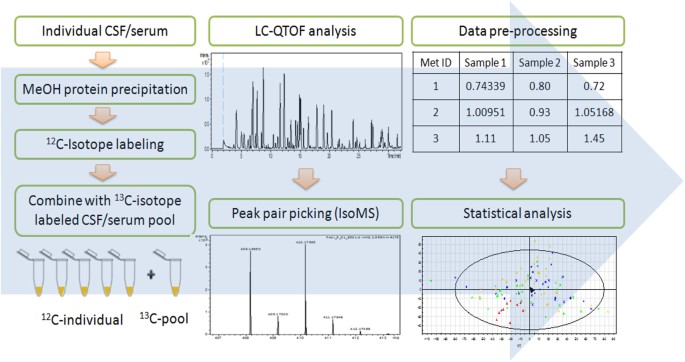
Figure 1 shows the overall workflow of CIL LC-MS for profiling the submetabolomes of CSF and serum in this cohort of 30 acute SCI patients. Prior to LC-MS analysis, each 12C_-_labeled
individual CSF or serum sample was combined with an equal mole amount of the corresponding 13C-labeled pooled sample which served as the UMS. The relative concentration of each metabolite in
an individual sample to that of the corresponding metabolite in UMS was measured using the intensity ratio of the 12C/13C peak pair. Since the same UMS was spiked into all the comparative
samples, the peak ratio values of a given metabolite in individual samples reflected their concentration differences in these samples. The use of 13C-labeled UMS as internal standards
enables more accurate quantification of the 12C-labeled metabolites. In addition, any future samples could be 12C-labeled and then compared to the 13C-labeled UMS, thereby allowing expansion
of the current dataset to a larger cohort. Dansylation LC-MS has the advantage of improved chromatographic separation and enhanced electrospray ionization (ESI) response, resulting in 10-
to 1000-fold increase in detection sensitivity13. A detailed discussion of this analytical platform, including the workflow, evaluation of analytical variability and peak detectability, as
well as comparison between the CSF and serum submetabolomes is included in Supplemental Note S1. Using this method of targeting the amine/phenol-containing metabolites, we were able to
detect 1213 and 2316 12C/13C peak pairs from CSF and serum, respectively. By matching accurate mass and retention time with the dansyl standard library14 (mass error <5 ppm and retention
time error <30 s) or with authentic standards, we identified 120 peak pairs which belong to 110 metabolites (see Supplemental Table T1). Among these 110 identified metabolites, 100 were
common to the two biofluids, while 2 of them could only be detected in CSF and 8 of them were only detectable in serum (see Note in Table T1). METABOLOMIC PROFILES IN SPINAL CORD INJURY
Principle component analysis (PCA) was first applied to provide an overview of the metabolomic dataset. Figure 2A and B show the PCA score plots for all serum and CSF samples analyzed. The
six QC samples were clustered close together, indicating good instrument stability throughout the LC-MS analysis. We then applied partial least squares discriminant analysis (PLS-DA) to
investigate how metabolites change over time after injury. In this study, the CSF and serum samples were analyzed at three time points approximating 24, 48, and 72 hours: t1 (16–32 hours),
t2 (40–56 hours) and t3 (64–80 hours). Figure 2C and D show the PLS-DA score plots and Supplemental Figure S1 shows validation of the PLS-DA models using the 20-permutation test. For both R2
and Q2 the slopes are positive and the permutation data are lower than the original point, suggesting that the PLS-DA models are valid. A clear separation is observed between samples
collected at t1 and t3, while the t2 samples fall in between t1 and t3 with some overlap. This pattern suggests a gradual change in the metabolic profile from t1 to t3. With the non-injured
controls serving as the reference point (t0), we found that the temporal changes follow two major patterns. The first pattern is a gradual increase or decrease of the metabolite level over
time (see Fig. 3A), and the second pattern involves an abrupt change during the first 16 to 32 h after injury (i.e., the t1 samples), followed by a gradual restoring of the metabolite level
back to the non-injured state (see Fig. 3B). Based on the Variable Importance in Projection (VIP) score of greater than 1.5 and _p_ < 0.05 in analysis of variance (ANOVA), 376 serum and
73 CSF metabolites that exhibit statistically significant temporal changes were chosen. Among these differentiating metabolites, 20 of them were commonly detected in serum and CSF. The lower
number of significant metabolites in CSF is not unexpected as the breadth of the metabolome in CSF is much smaller compared to serum. Among the 376 serum metabolites, 142 (38%) of them
follow pattern 1 and 227 (60%) conform to pattern 2. For the 73 CSF metabolites, pattern 1 accounts for 13 (18%) and pattern 2 explains 49 (67%) of the temporal changes. This observation
suggests that most of the metabolic changes occur at an early stage of the injury (i.e., pattern 2). Metabolic changes in the first 16 to 32 h after injury are of great interest because they
are responses that represent targets for acute pharmacologic/biologic interventions and are also potentially useful for objectively assessing injury severity at an early stage. Therefore,
we focused our analysis on the t1 samples for the following metabolomics analysis. TARGETED METABOLIC PROFILING OF INJURY-INDUCED CHANGES In this work, we have positively identified 110
metabolites (Supplemental Table T1) that cover 42 metabolic pathways, which allow us to perform targeted metabolic profiling and evaluation of perturbed pathways triggered by SCI. We first
compared the metabolic profiles of each of the injury groups (A, B and C) with the non-injured controls (N). As the total number of samples was relatively small, we only performed univariate
analyses to identify metabolites that were significantly altered. The number of metabolites that met the selection criteria (fold change >1.5, _p_ < 0.05) in at least one of the three
pairwise comparisons was illustrated by the Venn diagram (see Fig. 3C,D), and Table 1 lists the fold change and _p_-values and _q_-values of these metabolites. Amongst a total of 24 CSF and
13 serum compounds identified, 6 CSF and 4 serum metabolites were detected at significantly different levels in all three injury groups (Table 1). In CSF, these metabolites were uridine,
imidazoleacetic acid, methionine sulfoxide, arginine, cystathionine and homocarnosine. In serum, these were uridine, 4-hydroxyproline, N1, N12-diacetylspermine and glycylproline. These
commonly detected metabolites are of particular interest to represent the characteristic of the injury state. It was also noted that one endogenous metabolite, uridine, was present at lower
levels in both CSF and serum of the SCI patients. In addition, small fold changes were observed in most significant metabolites, likely due to the fact that metabolic network in general
maintains a very high homeostasis. However, even small changes of individual metabolites in a particular pathway could indicate that the particular pathway was perturbed by an event such as
SCI in this study. Fortunately, our CIL LC-MS technique is sufficiently accurate and precise to detect small fold changes with high confidence. PATHWAY ANALYSIS OF INJURY-INDUCED METABOLIC
CHANGES For the 24 CSF and 13 serum metabolites whose levels were significantly different in SCI patients as compared to non-injured controls, a metabolic pathway analysis (MetPA) was
performed to evaluate their associated pathways. Figure 4A and B show an overview of the pathway analysis for CSF and serum samples, respectively, with the x-axis representing the pathway
impact value calculated from pathway topological analysis and the y-axis corresponding to the −log (_p_) value obtained from pathway enrichment analysis. Supplemental Table T2 provides a
summary of the MetPA results. The pathways that are most relevant to the injury response should be characterized by both high −log (_p_) (i.e., low _p_-value) and high pathway impact values.
As shown in Fig. 4A, the most significantly affected pathway in CSF, as located on the top-right corner, is arginine and proline metabolism (Fig. 4C). In particular, we observed decreased
levels of arginine, and increased levels of downstream metabolites including N-acetylputrescine, gamma-aminobutyric acid (GABA) and homocarnosine (Fig. 4D). For serum, the pathways that are
important in both enrichment and topological analysis are phenylalanine metabolism and arginine and proline metabolism. Only one hit, phenylalanine, was found in phenylalanine metabolism. In
arginine and proline metabolism, an increase in N-acetylputrescine and decreases in sarcosine and hydroxyproline were observed. TARGETED METABOLIC PROFILING OF DIFFERENT INJURY SEVERITIES
To find metabolic signatures for evaluating the injury severity, we performed analysis of variance (ANOVA) with Tukey’s _post-hoc_ test to select metabolites that had significantly
difference within-group and between-group means (_p_ < 0.05). It was observed from the PCA score plots (Fig. 2A and B) that the differences between AIS A, B, and C spinal cord injury
groups were considerably smaller than between SCI and non-injured samples. As a result, the number of differentiating metabolites among three SCI injury severities (AIS A, B, C) was lower.
However, within CSF we identified six metabolites whose levels were influenced by injury-severity, including citrulline, glycerol, lactic acid, N-acetylputrescine, N1, N12-diacetylspermine
and N-methyl-D-aspartic acid. For serum, only one metabolite, 5-hydroxylysine, met this criterion. Figure 5 presents the box-and-whisker plots of these metabolites in the three injury
groups, as well as in the non-injured controls. It is noted that for all six CSF metabolites, the metabolite levels were the highest in the AIS A group, followed by AIS B, while the
non-injured controls were the closest to group C. Metabolites that were significantly different in pairwise comparisons via the _post-hoc_ test were labeled with an asterisk in Fig. 5. The
metabolite levels were significantly different between A and C for all seven metabolites, and between A and B for three of the metabolites: N1, N12-diacetylspermine, glycerol and lactic
acid. CLASSIFICATION OF DIFFERENT SEVERITIES OF NEUROLOGIC INJURY USING METABOLITES We then examined whether the selected metabolites or combinations thereof could be used to classify AIS A,
B and C levels. We first evaluated the receiver-operating characteristic (ROC) curves for each pairwise comparison (i.e., A vs. B, A vs. C and B vs. C). Supplemental Table T3 summarizes the
sensitivity, specificity, area under the curve (AUC) and 95% confidence level (95% CI) for each metabolite. We observed large AUC values (AUC ≥ 0.9) between AIS A and C for four metabolites
used alone: N1, N12-diacetylspermine, lactic acid, citrulline and glycerol, with good sensitivity and specificity at the cut-off threshold. In addition, by using a combination of multiple
metabolites, the AUC value could be further increased. For example, when N1, N12-diacetylspermine, lactic acid and citrulline were used as a panel of biomarkers, the AUC value was increased
to 0.957 (Fig. 6A). For comparison between AIS A and AIS B, AUC values of greater than 0.8 were observed for N1, N12-diacetylspermine, lactic acid and glycerol used individually, and a
larger AUC value (0.875) was obtained when these metabolites were used together (Fig. 6B). These results suggest that these selected metabolites could be useful for potentially
differentiating AIS A from B and C at an early stage of acute SCI. On distinguishing AIS B and C, some of the individual metabolites gave fair (0.7–0.8) AUC values. However, the use of a
three-metabolite combination could increase the AUC value to 0.869 (Fig. 6C). In addition to ROC analysis, we also applied logistic regression to create prediction models in combination with
leave-one-out cross validation to evaluate prediction accuracy. The prediction model was built in two steps. Firstly, a logistic regression model was applied for predicting AIS A vs.
non-AIS A on 29 samples (one patient sample at t1 was missing). Then, the non-AIS A samples identified from step 1 were subjected to a second logistic analysis that predicted AIS C vs.
non-AIS C. The samples that were predicted as non-AIS C in the second step were assigned AIS B. A 3 × 3 confusion matrix was then built based on the predicted results. The results are shown
in Supplemental Table T4 along with the equations used in the logistic regression model. In this case, the metabolites used to build the two-step models were 1) citrulline, glycerol,
N-methyl-D-aspartic acid, and 2) citrulline and glycerol, which were selected using the greedy stepwise approach. This two-step logistic regression model accurately classified the AIS grades
in 25 out of 29 cases (86.2%) in the first step and 14 out of 19 cases in the second step (73.7%), with an overall accuracy of 72.4% (i.e., 21 out of 29 cases). NON-TARGETED METABOLIC
ANALYSIS FOR INJURY LEVEL CLASSIFICATION We further investigated whether using a set of non-targeted metabolites (i.e., all the metabolites including those not identified) could build
prediction models with improved classification accuracy. All serum and CSF metabolites with ANOVA _p_ < 0.05 were extracted, and the greedy stepwise approach was used to rank and select
the top metabolites. We applied the same strategy described above to build two-step logistic regression models. Three models were built based on using CSF metabolites only (Supplemental
Table T5), using serum metabolites only (Supplemental Table T6), and using a combination of serum and CSF metabolites (Supplemental Table T7). The overall prediction accuracies were 93.1%
for both CSF model and combined serum/CSF model, and 86.2% for serum model. Some of these metabolites were putatively identified by matching accurate mass against the MyCompoundID database
or the human metabolome database (HMDB), and a complete list of these putative metabolites was given in Supplemental Table T8. Compared to making a prediction with only the identified
metabolites (Supplemental Table T4), the use of top-ranked metabolites selected by non-targeted analysis provided significantly improved prediction accuracy, and the best prediction result
was achieved using either a panel of CSF metabolites or a panel of combined CSF and serum metabolites. DISCUSSION Recently, it has been shown that metabolomic screening of rat plasma samples
can be used to establish an injury severity evaluation model based on the identified metabolomic fingerprints15. However, metabolomic analysis of human SCI samples has not been previously
reported. CSF is considered to be a more specific and informative biofluid than blood for studying the injured spinal cord and brain because of its proximity and its metabolic
simplicity16,17. Although the metabolic profile in blood has been reported to resemble that in CSF in other neurological diseases18,19, the relationship between metabolic changes in CSF and
blood following SCI remains to be investigated. While CSF and serum are both promising biofluids for discovery of potential SCI biomarkers, the metabolome analysis of CSF is challenged by
the relatively low metabolite concentrations. In this study, we applied a dansylation labeling technique for metabolomic profiling of CSF and serum samples, which provides a signal
enhancement of 10- to 1000-fold on its targeted submetabolome. As shown in Fig. 4 of Supplemental Note S1, dansylated metabolites were detected predominantly and distributed evenly over the
entire retention time window in LC-MS. Because of the improved ESI response and chromatographic separation, we were able to achieve a more comprehensive analysis of the amine- and
phenol-containing submetabolome. In total, 1213 and 2316 peak pairs or metabolites could be detected in CSF and serum, respectively, and 102 CSF and 108 serum metabolites could be positively
identified. Compared to previous work on metabolome profiling that typically reports less than 100 amine- and phenol-containing metabolites17,20, dansylation labeling LC-MS achieved a much
higher coverage for this targeted sub-metabolome. A comparison between non-injured controls and the three injury groups revealed a number of metabolites that show significant alterations
induced by SCI. In particular, it was found that uridine was down-regulated considerably in both CSF and serum. Uridine is an important metabolic precursor of phosphotidylcholine, a major
class of the cell membrane phospholipids that plays a key role in cell growth and repair21. Another metabolic function of uridine is to preserve ATP through anaerobic glycolysis22.
Therefore, uridine can act as an alternative energy source when glucose supply is not sufficient, or under hypoxic and/or ischemic conditions. Although a direct link between uridine and SCI
has not been reported, our findings suggest that the decrease in uridine level may be associated with several pathophysiological consequences of SCI, including membrane damage, phospholipase
activation, hypoxia and ischemia23. Subsequent pathway analysis of these differentially expressed metabolites indicated a perturbation in the arginine and proline metabolism. Among the 11
metabolites detected in this study, 6 (citrulline, arginine, proline, N-acetylputrescine, Gamma-aminobutyric acid and homocarnosine) and 3 (sarcosine, N-acetylputrescine and
4-hydroxyproline) of them were found to be significantly altered in at least one injury group in CSF and serum. Analysis of the CSF arginine and proline pathway revealed a significant
decrease in arginine and increases in a few downstream metabolites towards the synthesis of homocarnosine. Arginine is the precursor of the biologically active molecule, nitric oxide (NO),
through a reaction catalyzed by the nitric oxide synthase (NOS) family. NO is known to play a key role in the pathogenesis of acute CNS injury24. A competing reaction to NO production is
catalyzed by arginase enzymes to generate ornithine and urea. It has been shown that following spinal cord injury, there is a significant increase in the expression of NOS2 mRNA25 and in the
inducible NOS (iNOS) activity24. In addition, an increased arginase activity has also been reported to serve as a regulation of NO production, since high NO levels are known to be
neurotoxic26. Activation of both types of enzymes would result in a lower arginine level in patients with SCI. In contrast, a significant increase of the final metabolic product,
homocarnosine, has been observed in all three injury groups. Homocarnosine is a dipeptide composed of L-histidine and GABA, and is well-known for its antioxidant and neuroprotective
activity27,28,29. Reactive oxygen species and oxidative stress are often considered as hallmarks of SCI30, and the enhanced production of homocarnosine is likely intended to mitigate such
oxidative stress conditions. The metabolic changes associated with serum arginine and proline metabolism are quite different from that of CSF. For example, in contrast to CSF, we found that
arginine levels in the serum did not change significantly. In addition, the brain-specific metabolite homocarnosine could not be detected in serum. On the other hand, metabolites that
exhibited significant alterations in serum, such as 4-hydroxyproline and sarcosine, did not show any difference between non-injured and injured CSF samples. This observation highlights the
importance of performing parallel metabolomic profiling of serum and CSF at the discovery stage. While there were many common metabolites in serum and CSF, the metabolic responses to SCI
were found to be very different. The immediate proximity of the CSF to the injured spinal cord makes it the most direct reflection of injury responses within the cord; accessing CSF,
however, is obviously far more challenging than obtaining blood samples for biomarker studies. A parallel analyses such as ours enables one to compare the responses in both biofluids and
determine how well processes within the CSF are manifested in the serum. From the clinical perspective, it would be of great value to establish specific metabolites that can accurately
classify injury severity, especially in situations where the functional measures are difficult to assess and are poor predictors of outcome (e.g., acute clinical trials). In this study, we
identified six CSF metabolites and one serum metabolite that show promise as markers for evaluation of SCI injury severity. This targeted metabolic profiling result promotes the use of CSF
for severity analysis because of the greater number of differentially expressed metabolites within CSF. For these six CSF metabolites, the metabolite levels were the highest in the AIS A
group, and followed the trend A > B > C. This observation is consistent with the notion that the AIS A group represents the greatest injury severity (motor and sensory complete
paralysis) and the severity level lowers from B (motor complete, sensory incomplete paralysis) to C (incomplete motor and sensory paralysis). Therefore, we would expect the greatest
metabolic disturbance in AIS A. By using a combination of these metabolites, we have shown that good classification performance can be achieved in pair-wise comparisons (i.e., AUC > 0.8).
In addition, some of the metabolic changes can be rationalized by considering their biological functions. Firstly, citrulline is produced from arginine, and is the by-product of the
reaction catalyzed by NOS that releases NO. As described earlier, activation of the NOS family following SCI would promote generation of NO as well as the by-product citrulline. On the other
hand, the NO and citrulline levels are also regulated by activation of arginase, an enzyme that catalyzes a competing reaction and consumes arginine. While a decrease in arginine has been
consistently detected in all three injury groups, the production of citrulline was found to be severity-dependent. For patients associated with “complete” paralysis (AIS A), the elevation in
citrulline level is more pronounced compared to AIS B and C. On the other hand, patients in the AIS C category did not show significant change in citrulline level compared to the
non-injured controls. This observation suggests that regulation of these two enzyme families (NOS and arginase) is related to the injury severity. We have also identified glycerol and
lactate to be differentially expressed among three injury groups. Glycerol is the end-product of phospholipid degradation. Activation of phospholipases A and C is known to occur after
traumatic brain or spinal cord injury, which is thought to be associated with an increase in intracellular free Ca2+ 31. As an evidence of increased phospholipase activity, an injury
severity-dependent decrease in the total lipid phosphorus level in rat spinal cord has been reported at 15 min, 4 hr and 24 hr after injury31. Consequently, the phospholipid breakdown
product glycerol is expected to accumulate. Indeed, it has been shown that there was a significant increase in interstitial glycerol level immediately following trauma on the rat brain, and
it was concluded that interstitial glycerol could serve as a marker for phospholipid degradation in acute brain injury32. Our observation of the increased glycerol level is also consistent
with this mechanism. Lactate is a marker for hypoxia, as it provides an alternative pathway for energy production in the absence of oxygen. Increased CSF lactate levels have been reported on
Days 1 through 9 following experimental spinal cord injury on cat models, indicating continuing hypoxia in the spinal cord tissue33. Similarly, a rise in interstitial lactate has also been
observed in the brain injury of rats32,34. In this work, we have shown that an elevated level of CSF lactate is also present in human patients, and the response is related to injury
severity. This is also consistent with our previous work in a pig model of SCI in which spinal cord microdialysis demonstrated elevated lactate levels as well35. Another metabolic change
that is worth noting is the elevation of two acetylated polyamines, N-acetylputrescine and N1, N12-diacetylspermine, following acute SCI. In particular, N1, N12-diacetylspermine is not
detected in the non-injured samples, but is highly elevated in the AIS A group. Acetylation of polyamines is catalyzed by spermidine/spermine N1–acetyltransferase (SSAT) as part of the
polyamine catabolism process. Although the relationship between polyamine acetylation and spinal cord injury has not been extensively reported, a recent study demonstrated an enhanced
polyamine catabolism, including acetylation, after traumatic brain injury36. In the above-mentioned study, it was shown that N1-acetylspermidine was detectable 24 and 72 hr post injury,
indicating an increased SSAT activity and disrupted polyamine homeostasis. Our finding of the elevated acetylated polyamines indicates that the same mechanism may also occur in the acute SCI
scenario. In summary, six identified CSF metabolites have emerged as potential biomarkers for assessment of injury severity, and good classification performance has been achieved by using a
combination of these metabolites in pair-wise comparisons of AIS A, B and C patients. In addition, we have shown that using significantly changed metabolites that have not been positively
identified at this stage can further improve the prediction accuracy. For future work, more samples will be used to validate these potential biomarkers as well as examine the possibility of
finding biomarkers that predict neurologic recovery or that could be used as surrogate outcome measures. In this regard, the use of UMS allows us to readily expand the current dataset by
analyzing new samples. Because the same or comparable 13C-UMS will be used to analyze new batches of samples, the peak ratio values obtained from these individual samples will be fully
compatible to those shown in this study12. MATERIALS AND METHODS CLINICAL SAMPLE COLLECTION Patients with acute traumatic SCI were enrolled in a prospective observational trial to obtain
CSF, entitled CAMPER (the Canadian Multicenter CSF Pressure and Biomarker Study). Participating sites included Vancouver (British Columbia), Montreal (Quebec), Halifax (Nova Scotia) and
London (Ontario). The CAMPER trial is registered with ClinicalTrials.gov (Registration number: NCT01279811; Registration date: January 18, 2011) and is conducted in accordance to the
Declaration of Helsinki ethical principles for medical research involving human subjects. The CAMPER clinical trial protocol and experimental procedures (see CAMPER Protocol in additional
review material) received ethics approval from each participating center’s Institutional Review Board (IRB): Vancouver site from University of British Columbia Clinical Research Ethics
Board, London site from Western University Health Sciences Research Ethics Board, Montreal site from Hôpital du Sacré-Coeur de Montréal Ethics Committee of Research and Halifax site from
Capital Health Research Ethics Board. Additional sites including San Francisco and Stanford have been added to enroll more patients for future research; no samples from these new sites were
used in this current study. Ethics approval was received from the University of California San Francisco, Human Research Protection Program Committee on Human Research and Stanford
University Institutional Review Board. Each SCI patient provided his/her informed consent for the study. Intrathecal catheters were inserted pre-operatively into 30 acute SCI patients with
baseline ASIA Impairment Scale (AIS) grades of A (n = 10), B (n = 12) and C (n = 8). These catheters were left in place for 5 days, during which CSF/serum samples were drawn approximately
every 8 hrs. The CSF and serum samples were centrifuged at the bedside and the supernatant was immediately frozen on dry ice. The collected samples were shipped on dry ice and stored at −80
°C until further use. For each patient, three CSF and serum samples drawn at different time points were used for this study. These samples were grouped into three approximate daily stages:
24 hours (t1, 16–32 hours), 48 hours (t2, 40–56 hours) and 72 hours post-injury (t3, 64–80 hours). METABOLITE EXTRACTION AND LABELING Metabolites were extracted from serum and CSF samples
via methanol protein precipitation. Three volumes of ice-cold methanol were added into 25 μL of serum/CSF, vortexed and incubated on ice for 15 min. This was followed by centrifugation at 20
817 g for 15 min. The supernatants (75 μL for serum and 90 μL for CSF) were dried using a SpeedVac and resuspended in 25 μL of water. For the labeling step using the dansyl chloride agents
available at MCID.chem.ualberta.ca, the extracted solution was mixed with 12.5 μL 250 mM sodium carbonate/sodium bicarbonate buffer and 12.5 μL ACN. The solutions were vortexed, spun down
and mixed with 25 μL freshly prepared 12C-dansyl chloride solution (18 mg/mL) (for light labeling) or 13C-dansyl chloride solution (18 mg/mL) (for heavy labeling). The reaction was allowed
to proceed for 1 hr at 40 °C. After 1 hr, NaOH (250 mM, 5 μL) was added to the reaction mixture to quench the excess dansyl chloride. The solution was then incubated at 40 °C for another 10
min. Finally, formic acid in 50/50 ACN/H2O (425 mM, 25 μL) was added to consume excess NaOH and to make the solution acidic. PREPARATION OF LABELED SAMPLES FOR LC-MS ANALYSIS In the analysis
of analytical variability, a 90 μL aliquot was taken from one CSF sample of each patient group (AIS A, B, C and healthy control). Three of the 25 μL portions from each sample were labeled
with 12C-dansyl chloride as three experimental replicates, while the remaining liquids were mixed together to generate a pooled sample which was subsequently labeled by 13C-dansyl chloride.
The same procedure was performed for serum samples. In all other studies, aliquots of all individual CSF/serum samples were mixed together to generate a pooled CSF/serum sample. For
comparison between the serum and CSF metabolome, equal aliquots of pooled CSF and serum were combined and labeled with 13C-dansyl chloride, while the pooled CSF and pooled serum samples were
labeled with 12C-dansyl chloride. For metabolomic profiling of the entire sample set, all individual samples were labeled with 12C-dansyl chloride, and the pooled CSF and pooled serum
samples were labeled with 13C-dansyl chloride. Prior to LC-MS analysis, the 12C-labeled samples were combined with an equal amount of the corresponding 13C-labeled reference. Quality control
(QC) samples were prepared by 1:1 volume mix of a 12C-labeled and a 13C-labeled pooled sample. LC-MS ANALYSIS AND DATA PROCESSING The labeled metabolites were analyzed using a Bruker Maxis
Impact QTOF mass spectrometer (Bruker, Billerica, MA) linked to an Agilent 1100 series binary HPLC system (Agilent, Palo Alto, CA). The samples were injected onto an Agilent reversed phase
Eclipse Plus C18 column (2.1 mm × 10 cm, 1.8 μm particle size, 95 Å pore size) for separation. Solvent A was 0.1% (v/v) formic acid in 5% (v/v) acetonitrile, and solvent B was 0.1% (v/v)
formic acid in acetonitrile. The chromatographic conditions were: t = 0 min, 20% B; t = 3.5 min, 35% B; t = 18 min, 65% B; t = 24 min, 99% B; t = 31 min, 99% B, t = 32 min, 20% B. The flow
rate was 180 μL/min. All MS spectra were obtained in the positive ion mode with a scan range of 150 to 1000 m/z. The capillary voltage was 4500 V and nebulizer pressure was 1.8 bar. The dry
gas flow was set to 8 l/min and the dry gas temperature was set to 230 °C. Quality control samples were analyzed between every 20 sample runs to monitor instrument performance. For each
LC-MS run, masses were calibrated to the spectrum that contained the dansyl-amine peaks at m/z 242.57160 (two tags two charges), m/z 484.13592 (two tags one charge) and m/z 971.27799 (dimer)
using the Data Analysis software and the calibration result was applied to all the other spectra in the same LC-MS run. The resulting MS data were processed using a peak-pair picking
software, IsoMS37. The level 1 peak pairs were aligned from multiple runs by retention time within 20 s and accurate mass within 5 ppm. Metabolite identification was based on accurate mass
and retention time search against the dansyl standard library with mass difference of less than 5 ppm and retention time shift of less than 30 s. Dansyl library search does not require MS/MS
for positive identification, as accurate mass and retention time matches are already sufficient14. It should be noted that in the list of identified metabolites, imidazole acetic acid has
an amine group that can be labeled by dansylation as expected. For some conjugated alcohols, the hydroxyl group behaves like a phenol group and thus can be labeled by dansylation. Lactic
acid, glycerol and several common sugar molecules such as glucose belong to this type of alcohols and can be labeled. STATISTICAL ANALYSIS Only those peak-pair features shared by more than
50% of the samples were retained for statistical analysis. Multivariate statistical analysis including principle component analysis (PCA) and partial least squares discriminant analysis
(PLS-DA) was carried out using SIMCA-P+ 12.0 (Umetrics, Umeå, Sweden). PLS-DA validation was performed using 20-permutation test built in the SIMCA-P+ 12.0 program. The threshold for
selection of significant features in PLS-DA was VIP > 1.5. Analysis of variance (ANOVA) and Tukey’s test were performed by Metaboanalyst (www.metaboanalyst.ca)38 with _p_ < 0.05. For
comparisons between two groups, the fold change and _p_-value by Student’s _t_ test were calculated using Microsoft Excel. The multiple-testing-corrected _p_-value (_q_-value) was calculated
using R and BioConductor (www.bioconductor.org)39. The data were mean-centered and auto-scaled (unit variance) prior to analysis. ROC analysis was performed using SPSS (IBM Corp., Armonk,
NY, USA). Predictions based on logistic regression model were performed by Waikato Environment for Knowledge Analysis (Weka, University of Waikato)40. Metabolites with _p_ < 0.05 from the
analysis of variance were ranked using the greedy stepwise approach. The prediction model was established in two steps, and leave-one-out cross validation (LOOCV) was utilized to establish
the prediction accuracy. Firstly, logistic regression was applied for predicting AIS A vs. non-AIS A on all samples (for each sample, a logistic regression model was built based on all the
other samples, and the modeling result was used to evaluate this left out sample). Then, the predicted non-AIS A underwent a second logistic regression LOOCV for predicting AIS C vs. non-AIS
C. In this step, all non-AIS Cs would be assigned as AIS B. In each step, the optimal number of top ranked metabolites for building prediction models was determined based on the highest
prediction accuracy, with a restriction of 6 metabolites at maximum. The final logistic regression equation has been calculated using all of the samples involved in that step. A 3 × 3
confusion matrix table was constructed, and the overall prediction accuracy was calculated as the percentage of samples that have been correctly assigned as A, B or C (i.e., along the
diagonal of the confusion matrix table). ADDITIONAL INFORMATION HOW TO CITE THIS ARTICLE: Wu, Y. _et al_. Parallel Metabolomic Profiling of Cerebrospinal Fluid and Serum for Identifying
Biomarkers of Injury Severity after Acute Human Spinal Cord Injury. _Sci. Rep._ 6, 38718; doi: 10.1038/srep38718 (2016). PUBLISHER'S NOTE: Springer Nature remains neutral with regard to
jurisdictional claims in published maps and institutional affiliations. REFERENCES * Noonan, V. K. et al. Incidence and prevalence of spinal cord injury in Canada: a national perspective.
Neuroepidemiology 38(4), 219–226 (2012). Article PubMed Google Scholar * Krueger, H., Noonan, V. K., Trenaman, L. M., Joshi, P. & Rivers, C. S. The economic burden of traumatic spinal
cord injury in Canada. Chronic Dis Inj Can 33(3), 113–122 (2013). CAS PubMed Google Scholar * Tator, C. H. Review of treatment trials in human spinal cord injury: issues, difficulties,
and recommendations. Neurosurgery 59(5), 957–982, discussion 982–957 (2006). Article PubMed Google Scholar * Long, Y. C. et al. Differential expression of metabolic genes essential for
glucose and lipid metabolism in skeletal muscle from spinal cord injured subjects. J Appl Physiol (1985) 110(5), 1204–1210 (2011). Article CAS Google Scholar * Dulin, J. N., Karoly, E.
D., Wang, Y., Strobel, H. W. & Grill, R. J. Licofelone modulates neuroinflammation and attenuates mechanical hypersensitivity in the chronic phase of spinal cord injury. J Neurosci
33(2), 652–664 (2013). Article CAS PubMed PubMed Central Google Scholar * Toborek, M. et al. Arachidonic acid-induced oxidative injury to cultured spinal cord neurons. J Neurochem
73(2), 684–692 (1999). Article CAS PubMed Google Scholar * Panter, S. S., Yum, S. W. & Faden, A. I. Alteration in extracellular amino acids after traumatic spinal cord injury. Ann
Neurol 27(1), 96–99 (1990). Article CAS PubMed Google Scholar * Peng, J. et al. Establishment of Quantitative Severity Evaluation Model for Spinal Cord Injury by Metabolomic
Fingerprinting. PLoS One 9(4), 8 (2014). Google Scholar * Figueroa, J. D. et al. Metabolomics Uncovers Dietary Omega-3 Fatty Acid-Derived Metabolites Implicated in Anti-Nociceptive
Responses after Experimental Spinal Cord Injury. Neuroscience 255, 1–18 (2013). Article CAS PubMed Google Scholar * Dulin, J. N., Karoly, E. D., Wang, Y., Strobel, H. W. & Grill, R.
J. Licofelone Modulates Neuroinflammation and Attenuates Mechanical Hypersensitivity in the Chronic Phase of Spinal Cord Injury. J. Neurosci. 33(2), 652–664 (2013). Article CAS PubMed
PubMed Central Google Scholar * Jiang, H. et al. Establishing H-1 nuclear magnetic resonance based metabonomics fingerprinting profile for spinal cord injury: a pilot study. Chin. Med. J.
123(17), 2315–2319 (2010). CAS PubMed Google Scholar * Peng, J., Chen, Y. T., Chen, C. L. & Li, L. Development of a Universal Metabolome-Standard Method for Long-Term LC-MS Metabolome
Profiling and Its Application for Bladder Cancer Urine-Metabolite-Biomarker Discovery. Anal. Chem. 86(13), 6540–6547 (2014). Article CAS PubMed Google Scholar * Guo, K. & Li, L.
Differential 12C-/13C-isotope dansylation labeling and fast liquid chromatography/mass spectrometry for absolute and relative quantification of the metabolome. Anal Chem 81(10), 3919–3932
(2009). Article CAS PubMed Google Scholar * Huan, T., Wu, Y., Tang, C., Lin, G. & Li, L. DnsID in MyCompoundID for Rapid Identification of Dansylated Amine- and Phenol-Containing
Metabolites in LC-MS-Based Metabolomics. Anal Chem 87(19), 9838–9845 (2015). Article CAS PubMed Google Scholar * Peng, J. et al. Establishment of quantitative severity evaluation model
for spinal cord injury by metabolomic fingerprinting. PLoS One 9(4), e93736 (2014). Article ADS PubMed PubMed Central Google Scholar * Lubieniecka, J. M. et al. Biomarkers for severity
of spinal cord injury in the cerebrospinal fluid of rats. PLoS One 6(4), e19247 (2011). Article ADS CAS PubMed PubMed Central Google Scholar * Mandal, R. et al. Multi-platform
characterization of the human cerebrospinal fluid metabolome: a comprehensive and quantitative update. Genome Med 4(4), 38 (2012). Article CAS PubMed PubMed Central Google Scholar *
Trushina, E., Dutta, T., Persson, X. M., Mielke, M. M. & Petersen, R. C. Identification of altered metabolic pathways in plasma and CSF in mild cognitive impairment and Alzheimer’s
disease using metabolomics. PLoS One 8(5), e63644 (2013). Article ADS CAS PubMed PubMed Central Google Scholar * Quinones, M. P. & Kaddurah-Daouk, R. Metabolomics tools for
identifying biomarkers for neuropsychiatric diseases. Neurobiol Dis 35(2), 165–176 (2009). Article CAS PubMed Google Scholar * Boudah, S. et al. Annotation of the human serum metabolome
by coupling three liquid chromatography methods to high-resolution mass spectrometry. J Chromatogr B Analyt Technol Biomed Life Sci 966, 34–47 (2014). Article CAS PubMed Google Scholar *
Maher, A. D. et al. Seminal oligouridinosis: low uridine secretion as a biomarker for infertility in spinal neurotrauma. Clin Chem 54(12), 2063–2066 (2008). Article CAS PubMed Google
Scholar * Ipata, L. P. & Pesi, R. Metabolic Regulation of Uridine in the Brain. Current Metabolomics 3(1), 4–9 (2015). Article CAS Google Scholar * Dumont, R. J. et al. Acute spinal
cord injury, part I: pathophysiologic mechanisms. Clin Neuropharmacol 24(5), 254–264 (2001). Article CAS PubMed Google Scholar * Chatzipanteli, K. et al. Temporal and segmental
distribution of constitutive and inducible nitric oxide synthases after traumatic spinal cord injury: effect of aminoguanidine treatment. J Neurotrauma 19(5), 639–651 (2002). Article PubMed
Google Scholar * Imagama, T. et al. Regulation of nitric oxide generation by up-regulated arginase I in rat spinal cord injury. J Clin Biochem Nutr 51(1), 68–75 (2012). Article CAS
PubMed PubMed Central Google Scholar * Conti, A. et al. Nitric oxide in the injured spinal cord: synthases cross-talk, oxidative stress and inflammation. Brain Res Rev 54(1), 205–218
(2007). Article ADS CAS PubMed Google Scholar * Kang, J. H. et al. Protective effects of carnosine, homocarnosine and anserine against peroxyl radical-mediated Cu,Zn-superoxide
dismutase modification. Biochim Biophys Acta 1570(2), 89–96 (2002). Article CAS PubMed Google Scholar * Kohen, R., Yamamoto, Y., Cundy, K. C. & Ames, B. N. Antioxidant activity of
carnosine, homocarnosine, and anserine present in muscle and brain. Proc Natl Acad Sci USA 85(9), 3175–3179 (1988). Article ADS CAS PubMed PubMed Central Google Scholar * Tabakman, R.,
Lazarovici, P. & Kohen, R. Neuroprotective effects of carnosine and homocarnosine on pheochromocytoma PC12 cells exposed to ischemia. J Neurosci Res 68(4), 463–469 (2002). Article CAS
PubMed Google Scholar * Jia, Z. et al. Oxidative stress in spinal cord injury and antioxidant-based intervention. Spinal Cord 50(4), 264–274 (2012). Article CAS PubMed Google Scholar
* Demediuk, P., Daly, M. P. & Faden, A. I. Changes in free fatty acids, phospholipids, and cholesterol following impact injury to the rat spinal cord. J Neurosci Res 23(1), 95–106
(1989). Article CAS PubMed Google Scholar * Marklund, N., Salci, K., Lewen, A. & Hillered, L. Glycerol as a marker for post-traumatic membrane phospholipid degradation in rat brain.
Neuroreport 8(6), 1457–1461 (1997). Article CAS PubMed Google Scholar * Anderson, D. K., Prockop, L. D., Means, E. D. & Hartley, L. E. Cerebrospinal fluid lactate and electrolyte
levels following experimental spinal cord injury. J Neurosurg 44(6), 715–722 (1976). Article CAS PubMed Google Scholar * Nilsson, P., Hillered, L., Ponten, U. & Ungerstedt, U.
Changes in cortical extracellular levels of energy-related metabolites and amino acids following concussive brain injury in rats. J Cereb Blood Flow Metab 10(5), 631–637 (1990). Article CAS
PubMed Google Scholar * Okon, E. B. et al. Intraparenchymal Microdialysis after Acute Spinal Cord Injury Reveals Differential Metabolic Responses to Contusive versus Compressive
Mechanisms of Injury. J. Neurotrauma 30(18), 1564–1576 (2013). Article PubMed Google Scholar * Zahedi, K. et al. Polyamine catabolism is enhanced after traumatic brain injury. J
Neurotrauma 27(3), 515–525 (2010). Article PubMed PubMed Central Google Scholar * Zhou, R., Tseng, C. L., Huan, T. & Li, L. IsoMS: automated processing of LC-MS data generated by a
chemical isotope labeling metabolomics platform. Anal Chem 86(10), 4675–4679 (2014). Article CAS PubMed Google Scholar * Xia, J. G., Mandal, R., Sinelnikov, I. V., Broadhurst, D. &
Wishart, D. S. MetaboAnalyst 2.0-a comprehensive server for metabolomic data analysis. Nucleic Acids Res 40(W1), W127–W133 (2012). Article CAS PubMed PubMed Central Google Scholar *
Gentleman, R. C. et al. Bioconductor: open software development for computational biology and bioinformatics. Genome Biol. 5(10), 16 (2004). Article Google Scholar * Frank, E., Hall, M.,
Trigg, L., Holmes, G. & Witten, I. H. Data mining in bioinformatics using Weka. Bioinformatics 20(15), 2479–2481 (2004). Article CAS PubMed Google Scholar Download references
ACKNOWLEDGEMENTS This work and the research investigators have been supported by grants from the Natural Sciences and Engineering Research Council of Canada (LL), Canadian Institutes of
Health Research (BK), the Canada Research Chairs program (BK and LL), Genome Canada (LL) and Alberta Innovates (LL). Generous support for the human clinical trial and for these biomarker
studies was also received from the Rick Hansen Institute, Brain Canada, and the Craig H. Neilsen Foundation. AUTHOR INFORMATION AUTHORS AND AFFILIATIONS * Department of Chemistry, University
of Alberta, Edmonton, T6G2G2, AB, Canada Yiman Wu & Liang Li * International Collaboration on Repair Discoveries (ICORD), University of British Columbia, Blusson Spinal Cord Centre, 818
West 10th Avenue, Vancouver, V5Z 1M9, BC, Canada Femke Streijger & Brian K. Kwon * Department of Computing Science, University of Alberta, Edmonton, T6T 2E8, AB, Canada Yining Wang
& Guohui Lin * Division of Neurosurgery, Dalhousie University, Halifax Infirmary, 1796 Summer Street, Halifax, B3H 3A7, NS, Canada Sean Christie * Hôpital du Sacré-Coeur de Montréal,
5400 Boul Gouin O, Montréal, H4J 1C5, QC, Canada Jean-Marc Mac-Thiong * Chu Sainte-Justine, Dept. of Surgery, Université de Montréal, PO Box 6128, Station Centre-ville, Montreal, H3C 3J7,
QC, Canada Stefan Parent * Division of Orthopaedic Surgery, Schulich Medicine & Dentistry, Victoria Hospital 800 Commissioners Road East, Room E4 120, London, N6C 5W9, ON, Canada
Christopher S. Bailey * Division of Neurosurgery, University of British Columbia, Vancouver Spine Surgery Institute, 818 West 10th Avenue, Vancouver, V5Z 1M9, BC, Canada Scott Paquette,
Michael C. Boyd & Tamir Ailon * Department of Orthopaedics, University of British Columbia, Vancouver Spine Surgery Institute, 818 West 10th Avenue, Vancouver, V5Z 1M9, BC, Canada John
Street, Charles G. Fisher & Marcel F. Dvorak Authors * Yiman Wu View author publications You can also search for this author inPubMed Google Scholar * Femke Streijger View author
publications You can also search for this author inPubMed Google Scholar * Yining Wang View author publications You can also search for this author inPubMed Google Scholar * Guohui Lin View
author publications You can also search for this author inPubMed Google Scholar * Sean Christie View author publications You can also search for this author inPubMed Google Scholar *
Jean-Marc Mac-Thiong View author publications You can also search for this author inPubMed Google Scholar * Stefan Parent View author publications You can also search for this author
inPubMed Google Scholar * Christopher S. Bailey View author publications You can also search for this author inPubMed Google Scholar * Scott Paquette View author publications You can also
search for this author inPubMed Google Scholar * Michael C. Boyd View author publications You can also search for this author inPubMed Google Scholar * Tamir Ailon View author publications
You can also search for this author inPubMed Google Scholar * John Street View author publications You can also search for this author inPubMed Google Scholar * Charles G. Fisher View author
publications You can also search for this author inPubMed Google Scholar * Marcel F. Dvorak View author publications You can also search for this author inPubMed Google Scholar * Brian K.
Kwon View author publications You can also search for this author inPubMed Google Scholar * Liang Li View author publications You can also search for this author inPubMed Google Scholar
CONTRIBUTIONS B.K. and L.L. conceived the experiments. Y.W. conducted the experiments, analyzed the results and wrote the first draft of the manuscript. Y.W. and G.L. performed part of
statistical analysis. S.C., J.M.M.T., S.P., C.S.B., S.P., M.C.B., T.A., J.S., C.G.F., M.F.D., and B.K. contributed to the design and participated in the multicenter human SCI trial (CAMPER)
to enroll patients for CSF and serum collection. All authors edited and reviewed the manuscript. ETHICS DECLARATIONS COMPETING INTERESTS The authors declare no competing financial interests.
ELECTRONIC SUPPLEMENTARY MATERIAL SUPPLEMENTARY INFORMATION RIGHTS AND PERMISSIONS This work is licensed under a Creative Commons Attribution 4.0 International License. The images or other
third party material in this article are included in the article’s Creative Commons license, unless indicated otherwise in the credit line; if the material is not included under the Creative
Commons license, users will need to obtain permission from the license holder to reproduce the material. To view a copy of this license, visit http://creativecommons.org/licenses/by/4.0/
Reprints and permissions ABOUT THIS ARTICLE CITE THIS ARTICLE Wu, Y., Streijger, F., Wang, Y. _et al._ Parallel Metabolomic Profiling of Cerebrospinal Fluid and Serum for Identifying
Biomarkers of Injury Severity after Acute Human Spinal Cord Injury. _Sci Rep_ 6, 38718 (2016). https://doi.org/10.1038/srep38718 Download citation * Received: 07 July 2016 * Accepted: 10
November 2016 * Published: 14 December 2016 * DOI: https://doi.org/10.1038/srep38718 SHARE THIS ARTICLE Anyone you share the following link with will be able to read this content: Get
shareable link Sorry, a shareable link is not currently available for this article. Copy to clipboard Provided by the Springer Nature SharedIt content-sharing initiative