- Select a language for the TTS:
- UK English Female
- UK English Male
- US English Female
- US English Male
- Australian Female
- Australian Male
- Language selected: (auto detect) - EN
Play all audios:
ABSTRACT Behavioural studies have indicated that semantic typicality influences processing time and accuracy during the performance of inductive reasoning (_i.e_., the typicality effect).
The present study examines this effect by manipulating the types of premises and conclusions (_i.e_., general, typical, or atypical) at an electrophysiological level using a semantic
category-based induction task. With regard to behavioural results, higher inductive strength was found in typical conclusions in all premise conditions, whereas a longer response time for
atypical conclusions was only found in general and typical premise conditions. The ERP results had different response patterns: in the general premise condition, a larger P2, as well as a
smaller P3 and LPC (500–600 ms), were elicited by atypical conclusions relative to typical ones; in the typical premise condition, a larger P2 and LPC (600–700 ms) were found for atypical
conclusions; in the atypical premise condition, however, only a larger P2 was found for atypical conclusions. The divergent evidence for the typicality effect indicated that the processing
of the typicality effect in general, and specific premise conditions, might involve different cognitive processes, such as resource allocation and inference violation, which yielded new
insights into the neural underpinnings of the typicality effect in a category-based induction. SIMILAR CONTENT BEING VIEWED BY OTHERS BRAIN ELECTRICAL TRAITS OF LOGICAL VALIDITY Article Open
access 12 April 2021 THE PARIETO-OCCIPITAL CORTEX IS A CANDIDATE NEURAL SUBSTRATE FOR THE HUMAN ABILITY TO APPROXIMATE BAYESIAN INFERENCE Article Open access 09 February 2024 THE DEFAULT
MODE NETWORK IN COGNITION: A TOPOGRAPHICAL PERSPECTIVE Article 05 July 2021 INTRODUCTION The ability to use semantic concepts representing semantic categories to name, learn, classify, and
reason is crucial in our daily lives, however, not all members of a category are of equal importance, and certain categories members (_e.g_., sparrow, crow) that are more typical may be more
representative than others (_e.g_., penguin, ostrich). Furthermore, typicality has a significant effect on processing time and accuracy during object naming, learning, categorisation, and
reasoning1,2,3. For example, the verification of a category member was faster if the member was a typical item than if it was an atypical item4. This is known as the typicality effect, which
has been examined in many semantic tasks, such as category or picture naming5, category-based verification or reasoning3,6,7, and reading and sentence production8,9. Unfortunately, the
neural underpinnings of the typicality effect remain poorly understood. To address this issue, the present study gathers evidence from event related potentials (ERPs) using a category-based
induction task. The evidence of the typicality effect in cognitive neuroscience was mainly based on several ERP studies, such as that seen during category-based verification, in which
participants were required to judge whether, or not, the stimulus belonged to a given category3,10,11. For example, the ERP amplitude (300–450 ms) elicited by atypical words was more
negative than typical words during a category verification task10. Furthermore, when performing a category verification task via pictorial stimuli, a shorter P3 latency-to-peak was elicited
by typical items relative to atypical ones11. Recently, Räling and colleagues3 found that N400 amplitude elicited by atypical congruent targets was larger than typical congruent targets when
examining the influence of typicality on semantic processing during an auditory category member verification task. These results suggested that the P3 or N400 component was modulated by
typicality in category verification paradigms. A similar typicality effect was found in other tasks, such as category-based deduction, semantic categorisation, and lexical
decision6,12,13,14. For example, when participants were required to decide whether, or not, an incoming stimulus (conclusion) had the property described in the category presented before
(premise), reaction time data revealed a significant typicality effect, and ERP data indicated that larger N1, P2, and N400 amplitudes were elicited by atypical words relative to typical
words6. Recently, Wang and colleagues15 explored the typicality effect via different a categorisation method: that of either inclusion or exclusion. Specifically, after being presented with
six consecutive words that shared one feature, participants were required to judge whether the seventh word also possessed that feature (_i.e_., inclusion), or whether it did not. They found
that a larger P2 and smaller N400 were elicited by typical members relative to atypical members in inclusion, whereas typical members elicited a larger N2 than atypical members in the
exclusion15. These results further indicated that the typicality effect has a pervasive influence on the early perceptual and attention processes, as well as later semantic processes and
categorisation. In fact, Lei _et al_.6 mainly explored the typicality effect during category-based deduction, in which the category in the premise included the category in the conclusion
(e.g., Birds have property X; → Sparrows/penguins have property X; The bird includes the sparrow and penguin): as a result, the argument is logically valid16,17,18, yet, little is known
about the neural basis of the typicality effect during category-based induction, in which the category in the premise belongs to the category in the conclusion (e.g., Sparrows/penguins have
property X; → Birds have property X), or both premise and conclusion belong to same basic level category (e.g., Sparrows/penguins have property X; → Chicken/crows have property X; Both of
them are birds). Furthermore, the method in Wang _et al_.15 was also different from category-based induction in essence. Before testing, specifically, participants were required to repeat
category learning and classification until the accuracy reached 90%. In the test, participants were explicitly told that: “All members of this category possess a feature X, whereas
non-members of this category do not possess this feature.” As result, this task is more likely to be a category-based verification, rather than category-based induction. Accordingly, further
studies were needed to explore the effects of typicality on a category-based induction task via ERPs. Based on Lei _et al_.6, and using a simplified category-based deduction task (e.g.,
Bird has property X; → Sparrow), Long _et al_.19 used a similar method to explore semantic category-based induction, in which the premise was represented by a category member and a blank
property linked by a blank space (e.g., Apple X1, which means that the apple has property X1), while an additional “?” was shown at the end of the conclusion (e.g., Banana X1?, which means
that participants were required to determine whether or not the conclusion was acceptable). As the authors said, this way of presenting reasoning tasks had certain advantages (e.g., reducing
the effect of prior knowledge), and the present authors think that it is more appropriate to investigate the neural basis of the typicality effect. Although several ERP studies explored the
time course of category-based induction19,20, little is known about the neural basis of typicality effect when performing category-based induction. Accordingly, we set out to explore this
issue using ERPs. As mentioned above, previous studies revealed that N1, P2, N2, P3, and N400 mean amplitudes or peak-latencies were sensitive to the typicality effect. Indeed, N1 was
sensitive to selective attention, which influenced the further processing of perceptual features21,22. Following N1, the P2 effect reflected the higher-order perceptual processing, which was
modulated by attention23,24,25. For example, when participants were required to make a “high” or “low” similarity judgment for the subsequently presented geometric shapes, a larger P2 was
elicited by stimuli with a feature difference23. Recent studies found that the P2 was also sensitive to semantic processing and language26,27. For example, a larger P2 was elicited by
Chinese characters with low combinability and consistency relative to characters with high combinability and consistency26. Furthermore, previous studies have shown that the N2 effect was
modulated by perceptual mismatching, which has been extended into a reasoning task28,29,30. For example, the minor premise in conditional arguments (affirmation of the consequent: If P then
Q; Q//therefore P) prompted participants to produce an N2 wave related to the violation of expectations29. After N2, the parietal P3 was typically believed to reflect an
information-processing cascade related to attentional and memory mechanisms23,31,32. That is, the P3 amplitude was relatively large when tasks were undemanding, whereas more difficult
demands usually reduced P3 amplitude32,33. Recent studies about reasoning indicated that P3 amplitudes reflected the satisfaction of expectations19,34,35,36,37. That is, the P3 effect
elicited by matched arguments was larger than that for mismatched ones. For example, Long _et al_.19 found a larger P3 amplitude for logically related arguments (Apple X1 → Banana X1?)
relative to arguments that the premises were unrelated to the conclusions (Apple X1 → Telephone X1?). Moreover, late ERP components, such as N400 and LPC, were also found for the processing
of typical effect or category based-induction. Previous studies have found that the N400 effect was sensitive to the strength of semantic relations38,39,40. In priming studies, for example,
a larger N400 effect was elicited by unrelated or less-related words relative to related words41. During reasoning, the LPC (_c_. 600 ms) was modulated by different factors in both EEG and
MEG studies, such as mismatched conclusion or property violations19,35,37. For example, a larger LPC at 700–800 ms was elicited by conclusions with unrelated properties relative to
conclusions with related properties19. In fact, previous studies have found that the LPC amplitude was sensitive to old/new effect42, contextual effect43, processing manipulation44,45, as
well as decision accuracy and confidence46. For example, a larger LPC was elicited by more deeply encoded items, or words attracting correct recognition decisions. Based on the
aforementioned considerations, the main purpose of this study was to explore how types of premises modulated the typicality effect in category-based induction at behavioural and
electrophysiological levels. To achieve this, three types of premises and conclusions (general, typical, and atypical) are manipulated. In the general premise condition, participants reason
from basic level category to general, typical or atypical members of the category (e.g., Bird X → Bird/sparrow/penguin X?). In the typical premise condition, they reason from typical
premises to general, typical or atypical members (e.g., Crow X → Bird/sparrow/penguin X?). In the atypical premise condition, participants reason from atypical premises to general, typical
or atypical conclusions (e.g., Ostrich X → Bird/sparrow/penguin?). Participants are required to assume the that information about the premise is true (e.g., Crow has property X), and to
assess whether, or not, the information about the conclusion (e.g., Penguin has property X) is plausible, and make a “strong” or “not strong” response, which has been used extensively17,18.
The key focus here was on the electrophysiological data elicited by the conclusion (s), upon which certain judgments could be made. Based on previous studies, short RTs and higher “strong”
responses should be found for typical conclusions relative to atypical conclusions1,9. In the field of ERP study, typicality has a pervasive influence on category-based verification and
reasoning, which reflects on early N1 and P2 effects related to perceptual and attention processes, and later P3 or N400 effects related to semantic processes and categorisation6,10,11,15.
Accordingly, significant differences in the ERP indices should be found between typical and atypical members. For example, the P2 effect should be sensitive to the typicality effect in
category-based induction, because the representativeness of typical and atypical conclusions was different. Furthermore, research on reasoning found a larger P3, or LPC, effect for matched
items when performing conditional reasoning35,36, category-based induction19, or transitive inference37. In the present study, a larger P3 or LPC amplitude should be elicited by typical
conclusions, because they tend to match the premises to a greater extent47,48. More importantly, the types of premises should have a critical regulatory role in the typicality effect when
exploring the ERP effects elicited by the conclusions, especially for general premises and specific (typical and atypical) premises. In the general premise condition, specifically, the
category in the premise includes, or is identical to, the category in the conclusion (_e.g_., Bird X; → Bird/sparrow/penguin X?), so if the information about the premises is true, the
information about the conclusions is also true. For example, if all birds have property X is true, sparrows must have property X, because a sparrow is a type of bird; however, in the
typical/atypical premise condition, the information about the conclusions is not necessarily true, but only has a “strong” or “not strong” plausibility. For example, if all sparrows have
property X is true, all birds/penguins do not necessarily have property X. Furthermore, different response patterns should also be found in typical and atypical premises, because typical
premises are more representative than atypical members, especially when the conclusion is a general category. As results, although early ERP effects related to the perceptual and attention
processes for typical and atypical conclusions should be found in different premise conditions (_e.g_., P2), the late ERP effects related to premise-conclusion matching or categorisation
violations should have different response patterns (_e.g_., P3 or LPC). METHODS PARTICIPANTS 15 healthy undergraduate students (nine female) between the ages of 19 and 24 were paid for
participating in the main experiment. Participants that initially rated the stimuli did not participate in the main procedure. All participants were healthy and right-handed with normal or
corrected-to-normal vision, and gave their informed written consent before the experiment. All experimental protocols were approved by the University’s ethics committee (The Medicine Medical
Ethics Committee of Shenzhen University), and the methods were carried out in accordance with the relevant guidelines and regulations. STIMULI Before the main experiment, six natural
categories (_i.e_., birds, fishes, insects, vegetables, flowers, and fruits) and four artificial categories (_i.e_., clothing, musical instruments, furniture, and tools) were selected as
stimuli. In a manner similar to previous studies6,14, forty undergraduates were required to write members of the above categories as much as possible. After this, another 40 undergraduates
participated in a typicality test, in which participants were required to estimate the extent to which these members epitomised the category on a seven-point scale, where 7 indicated the
highest typicality. For example, category members such as “sparrow” and “crow” received a typical rating of “6” or “7” as birds. As a bird, however, the degree of typicality for category
members such as “penguin” or “duck” was lower than that for “sparrow” and “crow”, and they might receive a rating of “3” or “4” as birds. After these studies, five typical members and five
atypical members were selected from each category, plus these categories themselves, composed a set of 110 categories. An independent _t_-test suggested that there was a significant
difference between typical members (_M_ = 6.79, _SD_ = 0.15) and atypical members (_M_ = 4.65, _SD_ = 0.52), _t_ (58) = 21.66, _p_ < 0.001. The premise and conclusion of the arguments
consisted of one of the above selected 110 categories or members (See Supplementary Information for S1 Table, S2 Table and S3 Table), as well as the blank property represented by capital
letters ranging from A-Z (_e.g_., Sparrow A, which meant that sparrows have property A; see Table 1). The single premise category-based induction (_e.g_., Premise: Crows have property A;
Conclusion: Sparrows have property A) was used to induce a memory load1,19. To reduce the effect of prior knowledge, a blank property (_e.g_., A) was used and never any actual properties as
clarified further elsewhere19,49. As mentioned earlier, the types of premises (general, typical, or atypical) and conclusions (general, typical, or atypical) were manipulated, and thus
included nine main experimental conditions. Moreover, the identical conditions for typical and atypical members, as well as control condition, were regarded as baseline tasks. Specifically,
the premise and conclusion for main experimental and identical conditions consisted of natural categories with the same blank property. For the control condition, however, the premise and
conclusion consisted of natural and artificial categories respectively, and their properties were different. As shown in Table 1, the general premise condition included three types of
arguments: (1) General = General (G = G), the premise and conclusion consisted of the same category itself. (2) General-Typical (G-T), in which the premise consisted of a category and the
conclusion consisted of a typical member; (3) General-Atypical (G-A), in which the premise consisted of a category but the conclusion consisted of an atypical member. Furthermore, the
typical premise condition also included three types of argument: (1) Typical-General (T-G), in which the premise consisted of a typical member and the conclusion consisted of a category. (2)
Typical-Typical (T-T), both the premise and conclusion consisted of typical members of the same category. (3) Typical-Atypical (T-A), the premise consisted of a typical member, while the
conclusion consisted of an atypical member of the same category. Similarly, the atypical premise condition included three types of argument: (1) Atypical-General (A-G), in which the premise
consisted of an atypical member and the conclusion consisted of a category. (2) Atypical-Typical (A-T), the premise consisted of an atypical member, while the conclusion consisted of a
typical member of the same category. (3) Atypical-Atypical (A-A), both premise and conclusion consisted of atypical members of the same category. However, the baseline tasks were as follows:
(1) Typical = Typical (T = T), the premise and conclusion consisted of the same typical members. (2) Atypical = Atypical (A = A), the premise and conclusion consisted of the same atypical
members. (3) Control conditions, the premises were members of the natural category, while the conclusions were members of artificial categories. PROCEDURE In the main procedure, participants
judged whether the argument was “strong” or “not strong” by pressing one of two keys. The order of the stimuli within the task was randomised and counterbalanced. Following previous
studies17,18,50, the “strong” argument was defined as: Assuming that the information represented by the premises is true, this makes the information represented by the conclusions
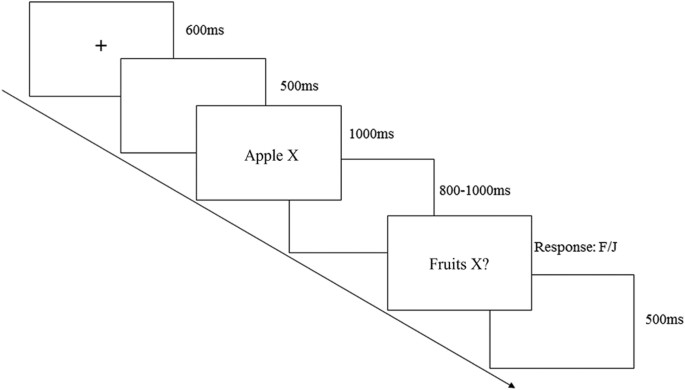
_plausible_. The categories and category members were presented through one to three black Chinese characters, which appeared on a grey background as generated by the E-prime software. As
shown in Fig. 1, a black fixation (“+”) was presented in the centre of the screen for 600 ms at the beginning of each trial, followed by a blank screen for 500 ms. Subsequently, the premise
and a novel property linked by a blank space (_e.g_., Apple X) indicating that the category member had that property, was presented for 1000 ms, followed by a blank screen shown for a random
duration (800–1000 ms). Next, the conclusion and a novel property ended in “?” (_e.g_., Fruits X?) linked by a blank space appeared and remained until participants made a response.
Participants were instructed to respond as rapidly and accurately as possible to the conclusion, and make a “strong” or “not strong” response by pressing “F” or “J” with the left or right
index finger, which was counterbalanced across subjects. The next trial began after the presentation of a blank screen for 500 ms. To ensure that each participant understood the
instructions, they were asked to repeat the instructions in their own words. Furthermore, to reduce the effect of familiarity, all categories and their members were presented by category at
the beginning of experiment. The procedure was divided into practice and test phases. The tests phases consisted of 510 trials under the main experimental conditions (30 trials for G = G, 60
trials for each of the other conditions) and 240 trails for baseline conditions (60 trials for A = A, 60 trials for T = T, and 120 trials for the control condition). The identical condition
(_i.e_., A = A, T = T) served as filler trials in which participants had to make “strong” responses, which was compared with the responses to control condition (“not strong”), to improve
the efficacy of the design51. Furthermore, thirty practice trails were performed to familiarise participants with the procedure: these were selected from unused category members that were
not included in the main experiment. ERP RECORDINGS AND DATA ANALYSIS Brain electrical activities were recorded from 64 tin electrodes mounted on an elastic cap based on the extended 10/20
system (Brain Products, GmbH, Germany; pass band: 0.05–100 Hz, sampling rate: 500 Hz). The ground electrode was on the medial frontal line and references were on the left and right
mastoid52,53. The vertical and horizontal electro-oculograms (EOGs) were recorded from the left eye infra-orbitally and supra-orbitally, and the orbital rim of both eyes, respectively. All
impedances were controlled to below 10 kΩ. All the bioelectric signals were analysed off-line using Brain Vision Analyzer 2.0. The signal was passed through a 0.1 to 35 Hz digital band-pass
filter for off-line analysis. Ocular correction ICA was used to eliminate the artifacts such as blinks and eye movements. Off-line computerised artifact rejection was also used to eliminate
trials with mean EOG (eye blinks and ocular movements), artifacts due to bursts of electromyography activity, amplifier clippings, or peak-to-peak deflections exceeding ± 80 μV. In a manner
similar to previous studies6,19, we focused on data elicited by the conclusion. As a result, epochs of 1000 ms, time-locked to the conclusion, including a 200 ms pre-stimulus baseline were
extracted from the ongoing EEG, segmented and averaged (Fig. 2). In the present study, the identical condition (except for G = G), as well as the control condition, were regarded as baseline
tasks to ensure an effective “strong/not strong” judgment17,51. In fact, participants made a very high “strong” response for the identical condition (_M_ = 0.99, _SD_ = 0.02), but made a
very low response for the control condition (_M_ = 0.08, _SD_ = 0.25). However, including these conditions in the same analysis diluted any possible effect of typicality on induction.
Indeed, we compared these identical conditions, and no significant ACC and RTs, as well as any ERP effects, were found among them. Based on previous studies and the topographies, we focused
our analysis on the mean peak latency, peak amplitude, and the mean amplitude between 50 ms and 150 ms (N1), 150 ms and 250 ms (P2), 250 ms and 350 ms (N2), 350 ms and 450 ms (P3), as well
as the mean amplitude of LPC (500–600 ms, 600–700 ms, and 700–800 ms). Four-way repeated measures ANOVAs were performed for each time window, with premise (three types: general, typical, or
atypical), conclusion (three types: general, typical, or atypical), laterality (three levels, left, middle, and right sites) and frontality (five levels, frontal: left—F3, middle—Fz,
right—F4; frontal central: left—FC3, middle—FCz, right—FC4; central: left—C3, middle—Cz, right—C4; central parietal: left—CP3, middle—CPz, right—CP4; parietal: left—P3, middle—Pz, right—P4)
as repeated factors. For all analyses, the degrees of freedom of the _F_ ratio were corrected for violations of the sphericity assumption based on Greenhouse Geisser, and Bonferroni
corrections were used for each comparison. RESULTS BEHAVIOURAL RESPONSES Two-way repeated measures ANOVAs were performed for the proportion of “strong” responses and reaction times (RTs),
with premise (three types: general, typical, or atypical) and conclusion (three types: general, typical, or atypical) as repeated factors. The main effect of premise on “strong” responses
was significant, _F_ (2, 28) = 7.12, _p_ = 0.014, _η_2 = 0.34. Similarly, there was significant main effect on the conclusion, _F_ (2, 28) = 8.82, _p_ = 0.002, _η_2 = 0.39. In both
situations, the proportion for atypical conditions (Premise: 0.68; Conclusion: 0.71) was lower than general (Premise: 0.94; Conclusion: 0.85) and typical conditions (Premise: 0.78;
Conclusion: 0.82, _ps_ < 0.02), whereas no significant difference was found between general and typical premises (_p_ > 0.26). However, the interaction between premise and conclusion
was not significant, _F_ (4, 56) = 1.45, _p_ = 0.25, _η_2 = 0.09. The main effect of premise on RT was significant, _F_ (2, 28) = 22.60, _p_ < 0.001, _η_2 = 0.62. Similarly, there was
significant main effect on the conclusion, _F_ (2, 28) = 56.98, _p_ < 0.001, _η_2 = 0.80. In both situations, RTs in the atypical conditions were longest (Premise: 945 ms; Conclusion: 806
ms), smallest in the general conditions (Premise: 818 ms; Conclusion: 992 ms), and intermediate in the typical conditions (Premise: 892 ms; Conclusion: 862 ms), which differed from each
other for the three conditions (_ps_ < 0.006). Furthermore, the interaction between premise and conclusion was significant, _F_ (4, 56) = 3.33, _p_ = 0.025, _η_2 = 0.19. Pair-wise
comparison indicated that the RT for a general conclusion was shorter than typical and atypical conclusions in general, typical and atypical conditions (_ps_ < 0.006). However, a shorter
RT was found for typical conclusions relative to atypical conclusions only when the premise was of the general category (_p_ < 0.001) and typical members (_p_ < 0.05), but not for
atypical premise members (_p_ > 0.90). ERP RESULTS As mentioned above, four-way repeated measures ANOVAs were performed for the mean peak amplitude, mean amplitude, and peak latency of
N1, P2, N2, and P3, as well as the mean amplitude of LPC (see Tables 2 and 3, Figs 2 and 3). N1 (50–150 MS) As shown in Tables 2 and 3, the main effect of the premise on the N1 peak was
significant, the N1 elicited by a general premise was larger than that arising from an atypical premise (_p_ = 0.016). The main effects of frontality and laterality on N1 mean amplitude were
significant. Pair-wise comparison indicated the N1 component in frontal, frontal central and central sites was larger than central-parietal and parietal sites (_ps_ < 0.05). The N1 at
left and middle sites was larger than that at right sites (_ps_ < 0.01). The interactions between laterality and premise on N1 mean amplitude and peak were significant. Pair-wise
comparison indicated that the difference between a general premise and an atypical premise was found at middle and right sites (_ps_ < 0.04), but not at left sites (_p_ > 0.10).
Although three way interaction among frontality, premise, and conclusion on the N1 amplitude was found, no significant interaction between premise and conclusion was found at sites with
different frontality (_p_s > 0.10). No other significant difference was found. P2 (150–250 MS) The main effects of conclusion on P2 mean amplitude and peak were significant. Pair-wise
comparison found that the P2 peak elicited by general conclusion was smaller than typical and atypical conclusions (_ps_ < 0.01), and the mean amplitude for general conclusions was
smaller than that for atypical conclusions (_p_ < 0.001). The interaction between premise and conclusion on P2 latency was significant, the P2 latency for general conclusions was shorter
than that for atypical conclusion in the atypical premise condition (_p_ = 0.03), but not in general and typical premise conditions (_ps_ > 0.10). The main effects of laterality on P2
mean amplitude and peak were significant. The P2 at right sites was larger than that at left sites (_p_ = 0.03). Furthermore, the interaction between frontality and conclusion was
significant. In addition to the larger P2 amplitude for atypical members relative to the general category found at all sites (_p_s < 0.04), the P2 elicited by atypical members was larger
than that arising from typical members at frontal, frontal central, and central sites (_ps_ < 0.05), but not at central parietal and parietal sites (_p_s > 0.33). Similarly, the
interaction among frontality, laterality, and conclusion on P2 amplitude was significant. Further analysis indicated that a smaller P2 was elicited by general relative to atypical
conclusions at Fz, F3, F4, FCz, FC3, FC4, and Pz (_p_s < 0.007), whereas such a difference between general and typical conclusions was only found at F3 sites (_p_ = 0.013). Furthermore,
the larger P2 elicited by atypical conclusions relative to typical conclusions was only found at F4 and FC4 (_p_s < 0.05). No other significant difference was found (_p_s > 0.05). N2
(250–350 MS) The main effects of premise, as well as conclusion, on N2 peak and mean amplitude were significant. Pair-wise comparison indicted the N2 elicited by typical premise was larger
than general premise (_ps_ < 0.05). Similarly, the N2 elicited by typical and atypical conclusions were larger than general conclusion (_p_s < 0.02). The interaction between premise
and conclusion on N2 mean amplitude was significant. The N2 elicited by a general conclusion was smaller than typical and atypical conclusions only in general premise conditions (_ps_ <
0.01), but not in typical and atypical conditions (_ps_ > 0.20). The interaction among frontality, premise, and conclusion on N2 mean amplitude was significant. Further analysis indicated
that the smaller N2 elicited by a general conclusion relative to typical and atypical conclusions was only found at frontal, frontal central, and central sites (_p_s < 0.01). The three
way interaction among laterality, premise, and conclusion on N2 mean amplitude and peak was significant. Further analysis found that the interaction between premise and conclusion was only
found at middle sites (_p_s < 0.01), but not at left and right sites (_p_s > 0.10). The main effects of frontality and laterality on N2 mean amplitude and peak were significant. The N2
component in frontal, frontal central sites was larger than central-parietal and parietal sites (_ps_ < 0.05), and the N2 at left and middle sites were larger than that at right sites
(_ps_ < 0.001). The interaction between laterality and premise on N2 mean amplitude was significant. Pair-wise comparison indicated that the N2 elicited by a typical premise was larger
than that of a general premise at middle (_p_ = 0.03) and right sites (_p_ = 0.01), but not at left sites (_p_ = 0.15). Furthermore, the interactions between laterality and conclusion on N2
mean amplitude and peak were significant. That is, the N2 elicited by general conclusions was smaller than that from typical and atypical conclusions at middle and right sites (_ps_ <
0.03), but not at left sites (_ps_ > 0.24). The interaction among frontality, laterality, and conclusion was significant. Further analysis indicated that the difference between general
and typical conclusions was found at Fz, F4, FCz, FC4, Cz, C4, CPz, CP4, Pz, and P4, whereas the difference between general and atypical conclusions was found at Fz, FCz, FC4, Cz, C4, CPz,
CP4, Pz, P4, and P3 (_ps_ < 0.05). P3 (350–450 MS) The main effects of premise, as well as conclusion, on P3 peak and mean amplitude were significant. Pair-wise comparison indicted the P3
elicited by a general premise was larger than that from a typical premise (_p_ < 0.05). Similarly, the P3 elicited by general conclusions was larger than typical and atypical conclusions
(_p_s < 0.03). The interactions between premise and conclusion on P3 mean amplitude and peak were significant. Although the P3 elicited by a general conclusion was larger than that from
typical conclusion in general and typical premise conditions (_ps_ < 0.05), a larger P3 elicited by general conclusion relative to atypical conclusions was found in general and atypical
premise conditions (_ps_ < 0.05). Furthermore, the smaller P3 amplitude elicited by atypical conclusions relative to general and typical conclusions was only found in general premise
conditions (_ps_ < 0.02). The three interactions among frontality, premise, and conclusion on P3 amplitude and peak were significant. Further analysis indicated that the smaller P3
elicited by atypical conclusions relative to general (_p_s < 0.01) and typical conclusions (_p_s < 0.05) was only found in general premise conditions at frontal, frontal central,
central, and central parietal sites. The three way interaction among laterality, premise, and conclusion on P3 amplitude was significant. Further analysis found that the interaction between
premise and conclusion was more significant at middle (_p_ = 0.001) and right sites (_p_ = 0.003) relative to left sites (_p_ = 0.03). No other significant difference was found. The main
effects of frontality and laterality on P3 amplitude and peak were significant. The P3 in central, central-parietal, and parietal sites was larger than that at frontal, frontal central sites
(_ps_ < 0.01), and the P3 at right sites was larger than left and middle sites (_ps_ < 0.01). The interaction between laterality and premise on P3 amplitude was significant. Although
the P3 elicited by a general premise was larger than that arising from a typical premise at all sites (_p_ < 0.05), it was only larger than that arising from an atypical premise at middle
sites (_p_ = 0.025). Furthermore, the interactions between laterality and conclusion on P3 amplitude and peak were significant. That is, the P3 elicited by a general conclusion was larger
than that from an atypical conclusions at all sites (_ps_ < 0.03), whereas it was larger than that arising from typical conclusions only at middle and right sites (_ps_ < 0.05). The
three way interaction among frontality, laterality, and conclusion on P3 amplitude was significant. Further analysis indicated that the difference between general and typical conclusions was
found at F4, FC4, C4, CPz, CP4, and P3, whereas the difference between general and atypical conclusions was found at Fz, F4, FCz, FC4, Cz, C4, CPz, CP4, and Pz (_ps_ < 0.05). LPC
(500–800 MS) The main effect of premise on LPC was significant, pair-wise comparison found that the LPC elicited by a general premise was larger than that arising from typical and atypical
premises at both 500–600 ms and 600–700 ms (_p_s < 0.03), whereas it was just larger than that from an atypical premise at 700–800 ms (_p_ = 0.042). Furthermore, the interaction between
premise and conclusion was significant at 500–700 ms, but not at 700–800 ms. At 500–600 ms, the mean amplitude of LPC elicited by atypical conclusion was smaller than that from a typical
conclusion only in general premise condition (_p_ < 0.03), but not in typical and atypical premise conditions (_p_ > 0.50). At 600–700 ms, however, only larger LPC for atypical
conclusion relative to typical conclusion was found in typical premise conditions. The main effect of frontality, as well as laterality, was significant at 500–800 ms. The LPC component in
central, central-parietal, and parietal sites was larger than frontal, and frontal central, sites (_p_s < 0.05). In addition, the LPC at right sites was larger than that at left and
middle sites (_p_s < 0.01). Furthermore, the interaction between laterality and premise, as well as laterality and conclusion, was significant at 500–600 ms and 600–700 ms. The larger LPC
elicited by general premise relative to typical and atypical premises was found in middle and right sites (_p_ < 0.05), but not in left sites. Although the absolute difference among
conclusions was larger at right sites relative to middle and left sites, they did not reach a significant level. The interaction between frontality and conclusion was significant at 600–700
ms and 700–800 ms. Further analysis indicated that the LPC elicited by atypical conclusions was larger than that from typical conclusions at parietal sites (_p_ = 0.03). The three way
interaction among frontality, laterality, and conclusion was significant. Further analysis indicated that the difference between general and atypical conclusions was found at F4 and FC4
(_ps_ < 0.05), whereas the difference between typical and atypical conclusions was only found at P4 (_ps_ < 0.01). No other difference was found. We also analysed the link between
behaviour and the evoked components of interest across subjects. The results found that there was no significant correlation between RTs and the mean amplitudes of N1, P2, N2, P3, and LPC
for T-T, A-A, and G = G conditions. For the G-T, G-A, T-G, A-G, and A-T conditions, there were significant negative correlations between RTs and the LPC amplitudes at part of the frontal and
frontal-central sites. The significant negative correlation between RTs and P2 amplitudes was only found for T-A condition at frontal sites. No other significant correlation was found.
DISCUSSION The main goal of this study was to examine how types of premises modulate the typicality effect in category-based induction by focusing on the electrophysiological data elicited
by the conclusions. The behaviour data showed that the processing of arguments with typical conclusions was faster than that of arguments with atypical ones in both general and typical
premise conditions, but not in atypical premise conditions. Furthermore, the “strong” rate for arguments with typical conclusions was higher than that for atypical ones under all premise
conditions. According to recent accounts48,54, the typicality was determined by the intercorrelation of semantic features. That is, the features that highly intercorrelated with other
typical items were posed by typical members of the category relative to the atypical items. For example, sparrow and crow are typical birds because of their typical intercorrelated semantic
features (_e.g_., wings, can fly), while ostrich is an atypical item because of its less intercorrelated features (_e.g_., cannot fly). In the present study, there are more common attributes
between the premises and typical conclusions relative to atypical conclusions, resulting in higher inductive strength for typical items. These results were consistent with previous
studies1,4, which suggested that arguments consisting of typical members can improve the acceptability of induction relative to arguments consisting of atypical members. One might suggest
perhaps that typical items are more rapidly/easily processed than atypical items, leading to a greater ease (and more confidence) when people must make inferences about these items belonging
to categories. However, such a view could not explain why no significant difference in RTs was found between typical and atypical conclusions in the atypical premise condition. Furthermore,
the “strong” rate for arguments with general conclusions was higher than atypical conclusions. A smaller P2 and N2, as well as a larger P3 and LPC at 500–600 ms, were elicited by general
conclusions relative to atypical conclusions. These results are consistent with the research about the inclusion fallacy, in which generalisation for general conclusions is considered
stronger than that for atypical conclusions in the specific premise conditions1,55. For example, Liang _et al_.55 found that the left fronto- temporal and superior medial frontal systems
were specifically activated in response to fallacious responses (_e.g_., the argument such as “robins secrete uric acid crystals, therefore, birds secrete uric acid crystals” was considered
more convincing than the argument that “robins secrete uric acid crystals, therefore, ostriches secrete uric acid crystals”). The typicality effect was also present in the ERP data. As shown
in Figs 2 and 3, when performing a category-based induction in general premise condition, a larger P2, as well as smaller P3 and LPC effects, were elicited by atypical conclusions relative
to typical ones. The results in specific premise condition had different response patterns: larger P2 and LPC effects were found for atypical conclusions relative to typical conclusions in
the typical premise condition, whereas only a larger P2 was found for atypical conclusions in the atypical premise condition. The divergence of P2, P3, and LPC effects for the typicality
effect in general, and specific, premise conditions yielded a new insight into the neural underpinnings of the typicality effect in category-based induction task. N1 AND P2 PREDICTS
PERCEPTUAL PROCESSING AND FEATURE DETECTION Previous studies found a larger N1 effect for atypical stimuli relative to typical stimuli6,12,13. In fact, the N1 effect on the typicality effect
was mainly found in studies using signal words or pictures as stimuli12,13. Although Lei _et al_.6 used a category-based deduction task, the conclusions consisted of only one word and a
larger N1 was elicited by atypical ones. In the present study, a word was linked with a capital letter linked by a blank space to represent the argument, and this manipulation might reduce
the difference in N1 effect. This might be the reason why, although the absolute N1 amplitude elicited by atypical conclusions (−1.85 μV) was larger than that for typical conclusions (−1.35
μV) in general premise conditions, the difference was not significant (_p_s > 0.23). Similar to the findings of a previous study6, we also found a larger P2 effect for atypical
conclusions relative to typical ones. As Lei _et al_.6 said, these results indicated that the typicality effect had a significant effect on the verification of an item’s category membership.
In fact, research has found that the verification of typical members was faster than that of atypical ones4. As mentioned earlier, the P2 effect was modulated by higher-order perceptual
processing23,24,25, as well as semantic processing and language26,27. In the present study, the detection of atypical items might involve more cognitive resources (_e.g_., attention
processes increased with the organisational semantic demand), and elicited a larger P2 amplitude, just like the larger P2 elicited by Chinese characters with low combinability and
consistency in orthographic and phonological processing26,27. This view can also be used to interpret the larger P2 effect for atypical conclusions relative to general conclusions, because
the processing of the general category data at a basic level was faster than that for atypical members at subordinate level56. THE P3 WAVE IS SPECIFICALLY TUNED TO CATEGORISATION Of greater
interest was the observation of smaller P3 effect for atypical conclusion relative to typical conclusion in general premise conditions. As mention earlier, the P3 wave reflected the
information-processing cascade related to attentional and memory mechanisms23,31,32. In the present study, the observed differences in P3 effect might reflect the attentional resource
allocation needed for reasoning from general category to its typical or atypical members. That is, the smaller P3 effect indicated that the processing of atypical members involved more
attentional resources during category-based induction. This view was further supported by the result that a larger P3 was elicited by general conclusion relative to typical and atypical
conclusions, because the reasoning about general conclusions (especially in the G = G condition) was the simplest argument, which mobilised minimal cognitive resource and elicited the
largest P3. A related explanation was that the difference in P3 amplitude just reflected the satisfaction of expectations19,34,35,36,37, which was larger for matched conclusions than
mismatched ones. In the general premise condition, a larger P3 amplitude was elicited by typical conclusions relative to atypical ones, because typical members have more features in common
with the prototype induced by the category57,58. In fact, these results were consistent with data from studies during category-based verification, which found larger P3 peak amplitudes
arising from typical items relative to atypical ones11. However, such differences in P3 amplitude between typical and atypical conclusions were not found in typical and atypical premise
conditions. This may be because there was no significant difference in the expectations about the conclusions when reasoning under specific premise conditions. That is, different cognitive
processes might be involved in reasoning with general and specific premises1,59. According to the similarity-based induction model, for example, the strength of the arguments was determined
by the similarity and coverage processes1. Specifically, the similarity process refers to a calculation of the extent to which the premise categories are similar to the conclusion category,
whereas the coverage process needs to calculate the degree of similarity between the premise categories and members of the lowest level category that includes both the premise and the
conclusion categories. The induction using specific premises included both similarity and coverage processes, while only coverage process was involved in the general premise condition1. In
the present study, additional processes (_e.g_., similarity) were involved in specific premise conditions, which reduced the effect of expectation or increased task difficulty, reducing the
sensitivity of P3 thereto. LPC SEMANTIC CONTENT EFFECTS IN THE INFERENCE GENERATION PHASE More importantly, the LPC at 500–600 ms elicited by atypical conclusion was smaller than that
arising from general and typical conclusions in general premise conditions, whereas the LPC at 600–700 ms elicited by atypical conclusion was larger than that for typical conclusions in
typical premise conditions. Furthermore, no significant difference in LPC effect was found in atypical premise conditions. As mentioned earlier, LPC in a reasoning study reflected mismatched
conclusions19,35,37, as well as the decision accuracy and confidence46. In the general premise conditions, one plausible view was that the LPC effect among different conclusions reflected
the old/new effect, as well as the contextual effect42,43. That is, for the G = G condition, same general category was presented in the premise and conclusion, and characterised by increases
in LPC amplitude. Although the processing of typical members in the G-T condition was not repeated, participants could encode more information about the typical conclusion from the context
at general category level, and elicited a larger LPC relative to that arising under atypical conclusions. Another plausible view was that the difference in LPC at 500–600 ms between typical
and atypical conclusions was just a continuous P3 effect as mentioned above, which reflected attentional and memory allocation. In fact, the LPC at 500–600 ms elicited by atypical
conclusions was also smaller than that arising from general conclusions in general premise conditions, which further supported this view. In the typical premise condition, however, no item
was repeated and the context of typical members could not lead to this difference. Similar to the findings of previous studies35,37, one plausible interpretation was that the LPC was more
likely to reflect a mismatched conclusion. For example, research using deductive reasoning tasks has found that a larger LPC effect at 330–630 ms was elicited by a mismatched conclusion
relative to that from a matched conclusion, which reflected the inference violation. In the present study, the mismatch in reasoning from typical premise to atypical conclusion was higher
than reasoning from typical premise to typical conclusion, and thus elicited a larger LPC at 600–700 ms. Another plausible view was that the LPC at 600–700 ms reflected the processing
manipulation, or decision accuracy and confidence22,46. That is, when participants were required to make inferences about different types of conclusion in the typical premise condition, the
inductive strength of, or confidence in, atypical conclusions was smaller than that for typical conclusions, as they were not necessarily true and had different representatives. Or, to make
a similar inductive inference, participants had to encode the atypical conclusion more deeply, which thus elicited a larger LPC. The divergence of the LPC effect between typical and atypical
conclusion in general and typical premise conditions might be caused by reasoning processing and the validity thereof. As mentioned earlier, the information about the conclusions in the
general premise condition must be true, whereas in the typical premise condition they were not necessarily true. Furthermore, different processes (_e.g_., similarity and coverage) might be
involved in the specific and general premise conditions, resulting in different LPC effects1. However, we did not dissociate the general premise from the specific premise by comparing ERP
data directly. One reason was that previous studies have found significant differences in ERP waves elicited by categories with different hierarchical levels, such as a basic level,
superordinate, and subordinate categories60,61. For example, ERP amplitudes between 320 and 420 ms reflected the differentiation between basic level and superordinate categorisations,
whereas the dissociation of subordinate and basic level categorisations was mainly found at 450–550 ms61. As a result, it was difficult to determine whether, or not, the results were induced
by conceptual processing, or reflected inference processing, even though we found significant differences between general and specific premises (_e.g_., LPC). Future research into this
issue was deemed necessary. More generally, diverging evidence was found for the typicality effect in category-based induction under different premise conditions. That is, although P2 has a
stable reaction to the typicality effect under all premise conditions, the P3 and LPC at 500–600 ms were only sensitive to the typicality effect under general premise conditions, and the LPC
at 600–700 ms was only found for the typicality effect under typical premise conditions. These results are consistent with the dual-process accounts of reasoning, which posited that there
are two distinct cognitive systems underlying reasoning62,63. Specifically, system 1 was largely fast, automatic, unconscious, and competed with an analytic system, whereas system 2 was
slower, deliberative, conscious, and based on rules. In the present study, the stable differences in P2 effect might be related to system 1, whereas the diverging evidence pertaining to P3
and LPC were related to system 2. By manipulating the premise-conclusion similarity (or argument length) and logical validity of arguments, recent studies indicated that a two-process
account of reasoning was more suited to interpretation of the relationships between inductive reasoning and deductive reasoning17,18. For example, for a common set of arguments, induction
judgments (“strong” or “not strong”) were more affected by the premise-conclusion similarity, whereas deduction judgments (“valid” or “not valid”) were more affected by validity1,17. In the
present study, the typicality might be another qualitative phenomenon that could be used to support the two-process account of reasoning, just like the premise-conclusion similarity17.
However, only induction judgments were included in the present study, and further study including deduction judgments might help to shed light on this issue. As the spatial resolution of the
ERP is rather low, any future study should combine the fMRI recordings with ERP recordings to explore this issue further. CONCLUSION The present findings have yielded new insights into the
processing of typicality effect in a category-based induction by manipulating the types of premise and conclusion. The larger P2 effect for atypical conclusions relative to typical
conclusions, which was found in all three premise conditions, served as markers of typicality processing and features detection. The larger P3 effect for typical conclusions relative to
atypical conclusions, which was found only in general premise condition, indicated that the P300 amplitude could reflect resource allocation. Furthermore, a larger LPC effect at 500–600 ms
was elicited by typical conclusions relative to atypical conclusions in general premise conditions, which reflected the contextual effect between a category and its members, or just a
continuous P3. However, the LPC at 600–700 ms elicited by typical conclusions was smaller than that arising from atypical conclusions, which is more likely to reflect inference violation or
processing manipulation. Overall, these results suggested that the types of premises had critical regulatory roles in the typicality effect in category-based induction, which reflected on
the P2, P3, and LPC effects. ADDITIONAL INFORMATION HOW TO CITE THIS ARTICLE: Liang, X. _et al_. How types of premises modulate the typicality effect in category-based induction: diverging
evidence from the P2, P3, and LPC effects. _Sci. Rep._ 6, 37890; doi: 10.1038/srep37890 (2016). PUBLISHER’S NOTE: Springer Nature remains neutral with regard to jurisdictional claims in
published maps and institutional affiliations. REFERENCES * Osherson, D. N., Smith, E. E., Wilkie, O., Lopez, A. & Shafir, E. Category-based induction. Psychological review 97, 185–200
(1990). Google Scholar * Rhodes, M., Brickman, D. & Gelman, S. A. Sample diversity and premise typicality in inductive reasoning: Evidence for developmental change. Cognition 108,
543–556 (2008). PubMed PubMed Central Google Scholar * Räling, R., Holzgrefe-Lang, J., Schröder, A. & Wartenburger, I. On the influence of typicality and age of acquisition on
semantic processing: Diverging evidence from behavioural and ERP responses. Neuropsychologia 75, 186–200 (2015). PubMed Google Scholar * Kiran, S. & Thompson, C. K. Effect of
typicality on online category verification of animate category exemplars in aphasia. Brain and Language 85, 441–450 (2003). PubMed PubMed Central Google Scholar * Holmes, S. J. &
Ellis, A. W. Age of acquisition and typicality effects in three object processing tasks. Visual Cognition 13, 884–910 (2006). Google Scholar * Lei, Y. et al. How does typicality of category
members affect the deductive reasoning? An ERP study. Experimental brain research 204, 47–56 (2010). ADS PubMed Google Scholar * Kiran, S., Ntourou, K. & Eubank, M. The effect of
typicality on online category verification of inanimate category exemplars in aphasia. Aphasiology 21, 844–866 (2007). Google Scholar * Garrod, S. & Sanford, A. Interpreting anaphoric
relations: The integration of semantic information while reading. Journal of Verbal Learning and Verbal Behavior 16, 77–90 (1977). Google Scholar * Patterson, K. The reign of typicality in
semantic memory. Philosophical Transactions of the Royal Society B: Biological Sciences 362, 813–821 (2007). Google Scholar * Fujihara, N., Nageishi, Y., Koyama, S. & Nakajima, Y.
Electrophysiological evidence for the typicality effect of human cognitive categorization. International journal of psychophysiology 29, 65–75 (1998). CAS PubMed Google Scholar * Ellis,
A. E. & Nelson, C. A. Category prototypicality judgments in adults and children: Behavioral and electrophysiological correlates. Developmental Neuropsychology 15, 193–211 (1999). Google
Scholar * Hauk, O. et al. [Q:] When would you prefer a SOSSAGE to a SAUSAGE? [A:] At about 100 msec. ERP correlates of orthographic typicality and lexicality in written word recognition.
Journal of Cognitive Neuroscience 18, 818–832 (2006). ADS CAS PubMed Google Scholar * Hauk, O. et al. How the camel lost its hump: The impact of object typicality on event-related
potential signals in object decision. Journal of Cognitive Neuroscience 19, 1338–1353 (2007). CAS PubMed Google Scholar * Núnez-Pena, M. I. & Honrubia-Serrano, M. L. N400 and category
exemplar associative strength. International Journal of Psychophysiology 56, 45–54 (2005). PubMed Google Scholar * Wang, X. et al. Categorization method affects the typicality effect: ERP
evidence from a category-inference task. Frontiers in psychology 7 (2016). * Goel, V. & Dolan, R. J. Differential involvement of left prefrontal cortexin inductive and deductive
reasoning. Cognition 93, B109–B121 (2004). PubMed Google Scholar * Heit, E. & Rotello, C. M. Relations between inductive reasoning and deductive reasoning. Journal of Experimental
Psychology: Learning, Memory, and Cognition 36, 805–812 (2010). PubMed Google Scholar * Rotello, C. M. & Heit, E. Modeling the effects of argument length and validity on inductive and
deductive reasoning. Journal of Experimental Psychology: Learning, Memory, and Cognition 35, 1317–1330 (2009). PubMed Google Scholar * Long, C. et al. Event-related potential parameters of
category and property violations during semantic category-based induction. International Journal of Psychophysiology 96, 141–148 (2015). PubMed Google Scholar * Liang, P., Zhong, N., Lu,
S. & Liu, J. ERP characteristics of sentential inductive reasoning in time and frequency domains. Cognitive Systems Research 11, 67–73 (2010). Google Scholar * Luck, S. J., Woodman, G.
F. & Vogel, E. K. Event-related potential studies of attention. Trends in cognitive sciences 4, 432–440 (2000). CAS PubMed Google Scholar * Rugg, M., Milner, A., Lines, C. &
Phalp, R. Modulation of visual event-related potentials by spatial and non-spatial visual selective attention. Neuropsychologia 25, 85–96 (1987). CAS PubMed Google Scholar * Chen, Q. et
al. The Processing of Perceptual Similarity with Different Features or Spatial Relations as Revealed by P2/P300 Amplitude. International Journal of Psychophysiology, doi:
10.1016/j.ijpsycho.2015.01.009 (2015). * Chen, A. et al. Electrophysiological correlates of category induction: PSW amplitude as an index of identifying shared attributes. Biological
Psychology 76, 230–238 (2007). PubMed Google Scholar * Luck, S. J. & Hillyard, S. A. Electrophysiological correlates of feature analysis during visual search. Psychophysiology 31,
291–308 (1994). CAS Google Scholar * Hsu, C.-H., Tsai, J.-L., Lee, C.-Y. & Tzeng, O. J.-L. Orthographic combinability and phonological consistency effects in reading Chinese
phonograms: an event-related potential study. Brain and Language 108, 56–66 (2009). PubMed Google Scholar * Blanchet, S., Gagnon, G. & Bastien, C. Event-related potential study of
dynamic neural mechanisms of semantic organizational strategies in verbal learning. Brain research 1170, 59–70 (2007). CAS PubMed Google Scholar * Prado, J., Kaliuzhna, M., Cheylus, A.
& Noveck, I. A. Overcoming perceptual features in logical reasoning: An event-related potentials study. Neuropsychologia 46, 2629–2637 (2008). PubMed Google Scholar * Bonnefond, M. et
al. How pragmatic interpretations arise from conditionals: Profiling the Affirmation of the Consequent argument with reaction time and EEG measures. Journal of Memory and Language 67,
468–485 (2012). Google Scholar * Pijnacker, J., Geurts, B., Van Lambalgen, M., Buitelaar, J. & Hagoort, P. Reasoning with exceptions: an event-related brain potentials study. Journal of
Cognitive Neuroscience 23, 471–480 (2011). PubMed Google Scholar * Polich, J. Neuropsychology of P300. Oxford handbook of event-related potential components. 159–188 (2012). * Polich, J.
Updating P300: an integrative theory of P3a and P3b. Clinical neurophysiology 118, 2128–2148 (2007). PubMed PubMed Central Google Scholar * Kok, A. On the utility of P3 amplitude as a
measure of processing capacity. Psychophysiology 38, 557–577 (2001). CAS PubMed Google Scholar * Bonnefond, M., Kaliuzhna, M., Van der Henst, J.-B. & De Neys, W. Disabling conditional
inferences: an EEG study. Neuropsychologia 56, 255–262 (2014). PubMed Google Scholar * Bonnefond, M. & Van der Henst, J.-B. Deduction electrified: ERPs elicited by the processing of
words in conditional arguments. Brain and language 124, 244–256 (2013). PubMed Google Scholar * Bonnefond, M. & Van der Henst, J.-B. What’s behind an inference? An EEG study with
conditional arguments. Neuropsychologia 47, 3125–3133 (2009). PubMed Google Scholar * Bonnefond, M., Castelain, T., Cheylus, A. & Van der Henst, J.-B. Reasoning from transitive
premises: An EEG study. Brain and cognition 90, 100–108 (2014). PubMed Google Scholar * Kutas, M. & Federmeier, K. D. Thirty years and counting: finding meaning in the N400 component
of the event-related brain potential (ERP). Annual review of psychology 62, 621–647 (2011). PubMed PubMed Central Google Scholar * Kutas, M. & Hillyard, S. A. Reading senseless
sentences: Brain potentials reflect semantic incongruity. Science 207, 203–205 (1980). ADS CAS Google Scholar * Chen, Q., Liang, X., Lei, Y. & Li, H. Electrophysiological difference
between the representations of causal judgment and associative judgment in semantic memory. Acta psychologica 157, 176–184 (2015). PubMed Google Scholar * Landi, N. & Perfetti, C. A.
An electrophysiological investigation of semantic and phonological processing in skilled and less-skilled comprehenders. Brain and language 102, 30–45 (2007). PubMed Google Scholar *
Friedman, D. & Johnson, R. Event-related potential (ERP) studies of memory encoding and retrieval: a selective review. Microscopy research and technique 51, 6–28 (2000). CAS PubMed
Google Scholar * Wilding, E. L. & Rugg, M. D. An event-related potential study of recognition memory with and without retrieval of source. Brain 119, 889–905 (1996). PubMed Google
Scholar * Paller, K. A., Kutas, M. & McIsaac, H. K. Monitoring conscious recollection via the electrical activity of the brain. Psychological Science 6, 107–111 (1995). Google Scholar
* Rugg, M. D. et al. Dissociation of the neural correlates of implicit and explicit memory. Nature 392, 595–598 (1998). ADS CAS Google Scholar * Finnigan, S., Humphreys, M. S., Dennis, S.
& Geffen, G. ERP ‘old/new’effects: memory strength and decisional factor (s). Neuropsychologia 40, 2288–2304 (2002). PubMed Google Scholar * Rosch, E. & Mervis, C. B. Family
resemblances: Studies in the internal structure of categories. Cognitive psychology 7, 573–605 (1975). Google Scholar * Rogers, T. T. et al. Structure and deterioration of semantic memory:
a neuropsychological and computational investigation. Psychological review 111, 205–235 (2004). PubMed Google Scholar * Feeney, A. How many processes underlie category-based induction?
Effects of conclusion specificity and cognitive ability. Memory & cognition 35, 1830–1839 (2007). Google Scholar * Rips, L. J. Two kinds of reasoning. Psychological Science 12, 129–134
(2001). CAS PubMed Google Scholar * Blanchette, I. & El-Deredy, W. An ERP investigation of conditional reasoning with emotional and neutral contents. Brain and cognition 91, 45–53
(2014). PubMed Google Scholar * Keil, A. et al. Committee report: Publication guidelines and recommendations for studies using electroencephalography and magnetoencephalography.
Psychophysiology 51, 1–21 (2014). PubMed Google Scholar * Luck, S. J. An introduction to the event-related potential technique. (MIT press, 2005). * McClelland, J. L. & Rogers, T. T.
The parallel distributed processing approach to semantic cognition. Nature Reviews Neuroscience 4, 310–322 (2003). CAS PubMed Google Scholar * Liang, P., Goel, V., Jia, X. & Li, K.
Different neural systems contribute to semantic bias and conflict detection in the inclusion fallacy task. Frontiers in human neuroscience 8 (2014). * Rosch, E., Mervis, C. B., Gray, W. D.,
Johnson, D. M. & Boyes-Braem, P. Basic objects in natural categories. Cognitive psychology 8, 382–439 (1976). Google Scholar * Osherson, D. N. & Smith, E. E. On the adequacy of
prototype theory as a theory of concepts. Cognition 9, 35–58 (1981). CAS PubMed Google Scholar * Rosch, E. Cognitive representations of semantic categories. Journal of experimental
psychology: General 104, 192 (1975). Google Scholar * McDonald, J., Samuels, M. & Rispoli, J. A hypothesis-assessment model of categorical argument strength. Cognition 59, 199–217
(1996). CAS PubMed Google Scholar * Tanaka, J., Luu, P., Weisbrod, M. & Kiefer, M. Tracking the time course of object categorization using event-related potentials. NeuroReport 10,
829–835 (1999). CAS PubMed Google Scholar * Large, M.-E., Kiss, I. & McMullen, P. A. Electrophysiological correlates of object categorization: Back to basics. Cognitive Brain Research
20, 415–426 (2004). PubMed Google Scholar * Evans, J. In two minds: dual-process accounts of reasoning. Trends in Cognitive Sciences 7, 454–459 (2003). PubMed Google Scholar * Evans, J.
S. B. Dual-processing accounts of reasoning, judgment, and social cognition. Annu. Rev. Psychol. 59, 255–278 (2008). PubMed Google Scholar Download references ACKNOWLEDGEMENTS This study
was supported by the National Natural Science Foundation of China (31400961, 31271088, and 31571153), Project funded by China Postdoctoral Science Foundation (2015M582398, 2016T90793), and
Shenzhen Peacock Plan (grant No. KQTD2015033016104926). The funders had no role in study design, data collection and analysis, decision to publish, or preparation of the manuscript. AUTHOR
INFORMATION AUTHORS AND AFFILIATIONS * Institute for Advanced Study, ChengDu University, ChengDu, 610106, China Xiuling Liang & Qingfei Chen * Research Centre for Brain Function and
Psychological Science, Shenzhen University, Shenzhen, 518060, China Xiuling Liang, Qingfei Chen, Yi Lei & Hong Li * China center for special economic zone research, Shenzhen University,
Shenzhen, 518060, China Qingfei Chen Authors * Xiuling Liang View author publications You can also search for this author inPubMed Google Scholar * Qingfei Chen View author publications You
can also search for this author inPubMed Google Scholar * Yi Lei View author publications You can also search for this author inPubMed Google Scholar * Hong Li View author publications You
can also search for this author inPubMed Google Scholar CONTRIBUTIONS Conceived and designed the experiments: X.L., Q.C., Y.L. and H.L. Performed the experiments: X.L. and Q.C. Analyzed the
data: X.L., Q.C., Y.L. and H.L. Contributed reagents/materials/analysis tools: X.L. and Q.C. Wrote the paper: X.L., Q.C. Y.L. and H.L. ETHICS DECLARATIONS COMPETING INTERESTS The authors
declare no competing financial interests. ELECTRONIC SUPPLEMENTARY MATERIAL SUPPLEMENTARY INFORMATION RIGHTS AND PERMISSIONS This work is licensed under a Creative Commons Attribution 4.0
International License. The images or other third party material in this article are included in the article’s Creative Commons license, unless indicated otherwise in the credit line; if the
material is not included under the Creative Commons license, users will need to obtain permission from the license holder to reproduce the material. To view a copy of this license, visit
http://creativecommons.org/licenses/by/4.0/ Reprints and permissions ABOUT THIS ARTICLE CITE THIS ARTICLE Liang, X., Chen, Q., Lei, Y. _et al._ How types of premises modulate the typicality
effect in category-based induction: diverging evidence from the P2, P3, and LPC effects. _Sci Rep_ 6, 37890 (2016). https://doi.org/10.1038/srep37890 Download citation * Received: 01 July
2016 * Accepted: 01 November 2016 * Published: 16 December 2016 * DOI: https://doi.org/10.1038/srep37890 SHARE THIS ARTICLE Anyone you share the following link with will be able to read this
content: Get shareable link Sorry, a shareable link is not currently available for this article. Copy to clipboard Provided by the Springer Nature SharedIt content-sharing initiative


:max_bytes(150000):strip_icc():focal(999x0:1001x2)/jana-kramer-jolie-2-2000-f13677ae4b1f4b168d894b7284a3e7d0.jpg)