- Select a language for the TTS:
- UK English Female
- UK English Male
- US English Female
- US English Male
- Australian Female
- Australian Male
- Language selected: (auto detect) - EN
Play all audios:
ABSTRACT Climate and vegetation change are two dominating factors for soil moisture trend. However, their individual contributions remain unknown due to their complex interaction. Here, I
separated their contributions through a trajectory-based method across the global, regional and local scales. Our results demonstrated that climate change accounted for 98.78% and 114.64% of
the global drying and wetting trend. Vegetation change exhibited a relatively weak influence (contributing 1.22% and −14.64% of the global drying and wetting) because it occurred in a
limited area on land. Regionally, the impact of vegetation change cannot be neglected, which contributed −40.21% of the soil moisture change in the wetting zone. Locally, the contributions
strongly correlated to the local environmental characteristics. Vegetation negatively affected soil moisture trends in the dry and sparsely vegetated regions and positively in the wet and
densely vegetated regions. I conclude that individual contributions of climate and vegetation change vary at the global, regional and local scales. Climate change dominates the soil moisture
trends, while vegetation change acts as a regulator to drying or wetting the soil under the changing climate. SIMILAR CONTENT BEING VIEWED BY OTHERS GLOBAL PATTERNS OF GEO-ECOLOGICAL
CONTROLS ON THE RESPONSE OF SOIL RESPIRATION TO WARMING Article 03 June 2021 SYNERGISTIC EFFECTS OF HIGH ATMOSPHERIC AND SOIL DRYNESS ON RECORD-BREAKING DECREASES IN VEGETATION PRODUCTIVITY
OVER SOUTHWEST CHINA IN 2023 Article Open access 08 January 2025 SOIL MOISTURE-EVAPORATION COUPLING SHIFTS INTO NEW GEARS UNDER INCREASING CO2 Article Open access 01 March 2023 INTRODUCTION
Soil moisture is a critical state variable for the Earth’s system, as its temporal and spatial variations strongly influence the global water and energy cycles1,2. In recent decades, many
regions on land experienced significant drying or wetting trends, which triggered serious social, ecological and environment problems3,4,5,6,7,8. Identification of the driving forces and
their contributions will be helpful for effective management of water resources and climatic adaptation. Several factors could be attributed to these trends, which can be summarized as
natural and anthropogenic effects9,10. The former is characterized by climate change3,11,12, while the latter often is represented by vegetation change13,14. Generally, climate change
affects water supply and demand, while vegetation change strongly influences water distribution by altering the surface properties10. The driving forces interact to create spatial and
temporal patterns of the terrestrial water. Numerous studies have been undertaken to capture the controlling factors of water change. Many scientists hold the views that climate dominates
the water dynamics3,15, while others believe that human plays increasing impacts13,16,17,18. The controversy arises from the interdependent nature of factors and their complex interaction.
Clarification of the individual contributions remains as a challenge, leaving a great gap for understanding the mechanism of global water cycle. Hydrological models and satellite remote
sensing are usually used to monitor global soil moisture. The models estimate soil moisture by physical interactions between the atmospheric and environmental factors. However, their
performances are usually weakened due to the complex physical interactions in them are simplified. In recent decades, satellite remote sensing has been widely adopted to retrieve surface
soil moisture for its spatially consistent view. Here, I use long-term satellite data sets and trajectory-based method to clarify the individual contributions of climate and vegetation
change on the soil moisture trend. The Climate Change Initiative (CCI) soil moisture data set of the European Space Agency (ESA) is adopted to monitor the global water trend from 1982 to
2013. The normalized difference vegetation index (NDVI), observed from the Global Inventory Monitoring and Modeling System (GIMMS) NDVI3g (third generation GIMMS NDVI from AVHRR sensors), is
used to capture the vegetation trend. That is because the indicator could provide a quantitatively way to evaluate the land use and cover change. Specifically, the introductions of CCI and
GIMMS NDVI data sets are shown in the Methods section. Methodologically, linear regression is firstly used to examine the trends of soil moisture and vegetation change for its simple form.
Then vegetation change regions (vegetation degradation, expansion and non-vegetation/change) are extracted from the land. Subsequently, soil moisture change in non-vegetation/change regions
is taken as a synthetic result of climate influences and served as a reference for isolating the contributions of vegetation change in the vegetation degradation and expansion regions (see
the Methods section)19. Considering the spatial variability of terrestrial water patterns, the contributions of vegetation change are evaluated in the drying (soil moisture trend < 0 and
significance < 0.05) and wetting (trend > 0 and significance < 0.05) zones. Both zones comprise the three vegetation change regions (vegetation degradation, expansion and
non-vegetation/change regions). Understanding the terrestrial water trend requires investigating its driving forces over a broad range of scales. Thus, the individual contributions of
vegetation change are evaluated at the global, regional and local scales. Globally, the contributions are identified in the drying and wetting zones. Regionally, the contributions are
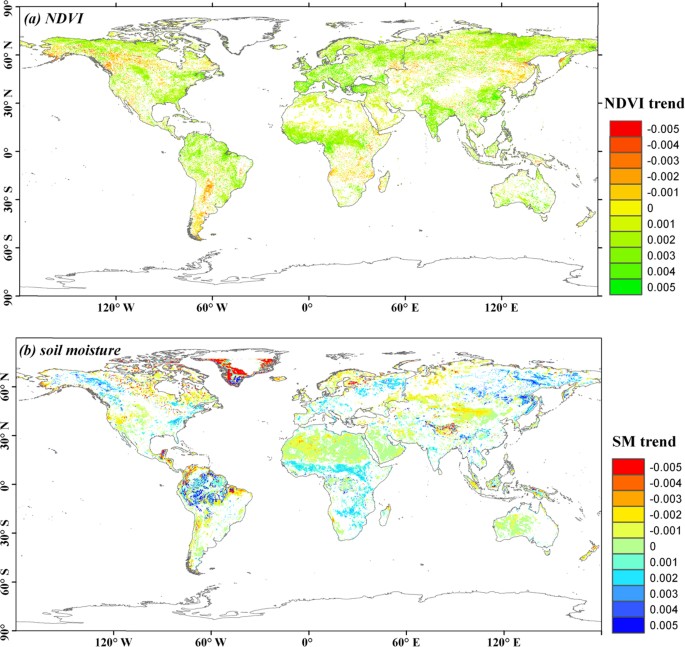
calculated for the vegetation change regions in the drying and wetting zones. Locally, the contribution is mapped at specific sites over land. Figure 1 shows the temporal trends of global
soil moisture and vegetation change in the past 30 years, with the multi-year mean values of soil moisture and NDVI are 0.229 cm3/cm3 and 0.404, respectively. The global soil moisture
decreases slightly with a change rate of −0.002 per decade (R2 = 0.04, p = 0.264). Of the land, 22.76% get drying and 8.76% get wetting, which is consistent with the previous studies
evaluated from satellite-retrieved8,20 or modelled data21,22. Spatially, soil moisture increases in the Amazon basin, southern Africa and north-eastern Asia and decreases in northern Africa
and central Asia. The global vegetation presents a significant expansion trend, which is also consistent with previous studies23,24. The expansion rate of NDVI is 0.004 per decade (R2 =
0.32, p < 0.001). Specifically, 7.94% and 32.01% of the land experience vegetation degradation and expansion, with the corresponding rates of −0.014 and 0.015 per decade. The highest
vegetation expansion occurs in northern North America, northern South America, central Africa, and south Asia. Vegetation degrades significantly in regions of north-central North America and
southern South America. The soil moisture and vegetation trends are spatially correlated for large regions. Specifically, 7.99% and 22.52% of the drying zones experienced vegetation
degradation and expansion, respectively, while these values are 7.49% and 43.19% in the wetting zones, respectively. Further statistics show that the trends of soil moisture are
heterogeneous in both drying and wetting zones. For the drying zones, soil moisture decreases by −0.025 cm3/cm3 per decade. More specifically, the highest decreasing rate occurs in the
vegetation expansion regions (−0.026 cm3/cm3 per decade), followed by the non-vegetation/change regions (−0.024 cm3/cm3 per decade) and finally, the degradation regions (−0.022 cm3/cm3 per
decade). If the soil moisture trend in the non-change/vegetation region is a result of climate change, the trends determined by vegetation change can be isolated in the expansion and
degradation regions. Specifically, −0.002 and 0.002 cm3/cm3 per decade of the trends are generated by vegetation changes in the two vegetation change regions. It indicates that the
vegetation expansion would accelerate the soil moisture decreasing in the drying zones, while the degradation would mitigate the trend. The probable reason is that vegetation strongly
controls evapotranspiration, and the increase of vegetation would strongly accelerate the water deficit in the drying zones17,25,26. In the wetting zones, the soil moisture increases at the
fastest rate in the non-change/vegetation regions (0.030 cm3/cm3 per decade), followed by the degradation (0.028 cm3/cm3 per decade) and expansion (0.021 cm3/cm3 per decade) regions.
Therefore, −0.002 and −0.009 cm3/cm3 per decade of the trends are generated by vegetation degradation and expansion, respectively. This demonstrates that vegetation change would mitigate the
wetting trend, particularly of the vegetation expansion. Effects of vegetation degradation in the wetting regions mainly focus on lengthening the dry season and increasing the streamflow,
which subsequently decreases the rainfall infiltration27. Based on the separating soil moisture trends above, I subsequently quantify the contributions of climate and vegetation change (see
the Methods section). Figure 2 shows the individual contributions at global scale. In the drying zone, −0.77% and 1.99% of the decreasing soil moisture are originated from vegetation
degradation and expansion, respectively. The contribution of climate change is therefore 98.78%. In the wetting zone, the contributions are −0.46% and −14.18% for the vegetation degradation
and expansion, respectively, with climate change contributing 114.64% to the soil moisture increase. It demonstrates that vegetation change exhibits a weak contribution to global drying and
wetting trends. The reason is mainly attributed to their small area. Climate change occurs over the entire Earth, while vegetation change only occurs in a limited region on land (only 40% of
the land). Therefore, the small area of vegetation change weakens its impact on the global moisture trend. Figure 3 further presents the contributions in the regions of soil moisture
change. In the drying zone, the climate and vegetation change account for 110.87% and −10.87%, respectively, of the soil moisture decrease in the vegetation degradation regions. These values
are 91.79% and 8.21% in the vegetation expansion regions. In the wetting zone, the contributions are 105.65% and −5.65% in the vegetation degradation regions and 140.21% and −40.21% in the
expansion regions. Climate change still dominates the soil moisture trend. However, the regional contributions of vegetation change are much greater than those at a global scale,
particularly in the vegetation degradation regions of the wetting zone. These results are very helpful for providing insight into regional land cover and water management. For example,
reforestation could effectively eliminate flooding in humid regions, while deforestation could hold more water in the soil and protect against drought in arid regions. The appropriate forest
planning strategy is helpful for effective management of water resources and climatic adaptation. The spatial pattern of local contribution is also evaluated and mapped for vegetation
change. The averaged soil moisture trend in the non-vegetation/change pixels in a 1.25° × 1.25° window is taken as the local contribution of climate change. Then the contributions of
vegetation change are extracted in the vegetation expansion and degradation pixels. The size of the window is designed for capturing the local climate-soil moisture interaction28,29. Figure
4 further shows the contribution of vegetation change at the local sites. Vegetation change has a significantly positive contribution in South America, a negative contribution in northern
Africa. The contribution is strongly correlated to soil moisture and vegetation trends. Soil moisture is low (0.217 cm3/cm3) and decreased slightly (−0.004 cm3/cm3 per decade) in the areas
with a negative contribution. However, in the areas with a positive contribution, soil moisture is significantly higher (0.227 cm3/cm3) and decreases rapidly (−0.009 cm3/cm3 per decade). In
addition, vegetation is relatively sparse (NDVI = 0.383, with trend of 0.007 per decade) for the negative contributions and dense (NDVI = 0.427, with trend of 0.008 per decade) for the
positive contributions. These results suggest that vegetation expansion would accelerate the soil drying trend in the dry and sparsely vegetated areas. However, in the wet and dense
vegetated areas, the vegetation expansion would mitigate the drying trend. The reason for this difference is due to the higher transpiration rates in the vegetated regions, which aggravates
the water deficit in dry regions. In wet regions, the vegetation would store more water from rainfall, which could compensate the consumption of water from evapotranspiration30,31,32.
Overall, this study uses the satellite-retrieved data to separate the individual contributions of climate and vegetation changes to the soil moisture trend. The surface characteristics,
particularly of land cover, strongly affect the reliability of satellite soil moisture. The validation shows that CCI soil moisture is highly consistent with the ground observation data over
different land covers, with the correlation coefficient (R) and root mean square error (RMSE) range from 0.46 ± 0.23, and 0.03 to 0.09 cm3•cm−3 33. It demonstrates that the CCI data is
suitable for capturing the trend of global soil moisture. Results show that vegetation has a weak global impact due to the relatively small size of the changing areas. Regionally, the
contribution of vegetation change cannot be neglected. Locally, vegetation negatively affected soil moisture variation in the dry and sparsely vegetated areas and positively in the wet and
densely vegetated areas. In conclusion, climate change dominated the global soil moisture trend in both drying and wetting zones. Vegetation change served as a regulator to accelerate or
decelerate the trend under the changing climate. Results of this study could support water adaptation and management at global or regional scales. As vegetation change plays limited
influence on global soil moisture trend, the adaptation of global warming should be paid more attention. On the other hand, vegetation significantly influences regional soil moisture
changes, and the regulation of land cover needs attention to promote regional water management (i.e., drought and flood mitigation). For example, previous studies revealed that forest have a
strong ability to hold soil water19,34. Therefore, reforestation would be an effective way to mitigate the local soil drought, with its effect should be enhanced for water resource
management in a changing climate. METHODS GLOBAL SOIL MOISTURE DATA SET The Climate Change Initiative (CCI) data set of the European Space Agency (ESA) is adopted for monitoring the global
soil moisture trend. This data set contains fusion data with a combination of active and passive microwave satellite observations. The active data sets are generated by the University of
Vienna and based on the observations from C-band scatterometer on board the European Remote Sensing (ERS) satellites (ERS-1 and ERS-2) and the Meteorological Operational Satellite (MetOp-A).
The passive data sets are generated by VU University Amsterdam in collaboration with NASA based on the passive microwave observations from the Scanning Multichannel Microwave Radiometer
(SMMR), Special Sensor Microwave/Imager (SSM/I), Tropical Rainfall Measuring Mission microwave imager (TRMM TMI) and the Advanced Microwave Scanning Radiometer - Earth Observing System
(AMSR-E). The data set is obtained from the ESA website (http://www.esa-soilmoisture-cci.org). The accuracy is acceptable when validated by global ground-based observations, with a mean
correlation coefficient (R) and root mean square error (RMSE) of 0.46 and 0.04 cm3/cm3, respectively33. The spatial gaps are filled by interpolation with the time series trends. GLOBAL NDVI
DATA For the vegetation change evaluation, the Global Inventory Monitoring and Modeling System (GIMMS) NDVI3g (third generation GIMMS NDVI from AVHRR sensors) is obtained from
(http://ecocast.arc.nasa.gov/data/pub/gimms/3g.v0/). The data ranges from July 1981 to Dec. 2013 with a spatial resolution of 0.833 degrees. The data set subsequently is resampled to 0.25
degrees to compare with the data set of CCI soil moisture. CALCULATION OF THE INDIVIDUAL CONTRIBUTIONS A trajectory method is used to quantify the contributions of climate and vegetation
change on the terrestrial water trends19. Soil moisture in non-change vegetation regions represents a synthetic result of climate influences and serves as a reference for isolating soil
moisture alterations due to vegetation in other regions. Globally, the contributions are calculated with area weight summarization: where _Con__GC_ and _Con__GV_ are the global contributions
of climate and vegetation, _S__sub_ is the area ratio of each vegetation change region in the drying or wetting areas, _TSM__NCV_ and _TSM__sub_ are the soil moisture trends in the
non-change and change vegetation regions and _TSM__G_ is the trend in the global drying or wetting zones. At the regional and local scales, climate change and vegetation change influence
soil moisture at certain sites. Their contributions are calculated as where _Con__RC_ and _Con__RV_ are the regional or local contributions of climate and vegetation change, _TSM__NCV_ and
_TSM__sub_ are defined in Eqs (1) and (2) and _TSM__R_ is the regional or local trend in the vegetation change regions. ADDITIONAL INFORMATION HOW TO CITE THIS ARTICLE: Huihui, F. Individual
contributions of climate and vegetation change to soil moisture trends across multiple spatial scales. _Sci. Rep._ 6, 32782; doi: 10.1038/srep32782 (2016). REFERENCES * Jung, M. et al.
Recent decline in the global land evapotranspiration trend due to limited moisture supply. Nature 467, 951–954 (2010). Article CAS ADS Google Scholar * Alexander, L. Climate science:
Extreme heat rooted in dry soils. Nature Geoscience 4, 12–13 (2011). Article CAS ADS Google Scholar * Dai, A. Increasing drought under global warming in observations and models. Nature
Clim. Change 3, 52–58 (2013). Article ADS Google Scholar * Dai, A. Characteristics and trends in various forms of the Palmer Drought Severity Index during 1900–2008. J. Geophys. Res. 116,
D12115 (2011). Article ADS Google Scholar * Donat, M. G., Lowry, A. L., Alexander, L. V., O’Gorman, P. A. & Maher, N. More extreme precipitation in the world’s dry and wet regions.
Nature Clim. Change 7, 1–7 (2016). Google Scholar * Chou, C. et al. Increase in the range between wet and dry season precipitation. Nature Geosci 6, 263–267 (2013). Article CAS ADS
Google Scholar * IPCC. Climate Change 2013. The Physical Science Basis: Working Group I Contribution to the Fifth Assessment Report of the Intergovernmental Panel on Climate Change.
Cambridge, UK:: Cambridge Univ. Press, (2013). * Greve, P. et al. Global assessment of trends in wetting and drying over land. Nature Geosci 7, 716–721 (2014). Article CAS ADS Google
Scholar * Vörösmarty, C. J., Green, P., Salisbury, J. & Lammers, R. B. Global Water Resources: Vulnerability from Climate Change and Population Growth. Science 14, 284–288 (2000).
Article ADS Google Scholar * Haddeland, I. et al. Global water resources affected by human interventions and climate change. P. Natl. Acad. Sci. USA (_PNAS_) 111, 3251–3256 (2014).
Article CAS ADS Google Scholar * Trenberth, K. E. et al. Global warming and changes in drought. Nature Clim. Change 4, 17–22 (2013). Article ADS Google Scholar * Koster, R. D. et al.
Regions of Strong Coupling Between Soil Moisture and Precipitation. Science 205, 1138–1140 (2004). Article ADS Google Scholar * Sterling, S. M., Ducharne, A. & Polcher, J. The impact
of global land-cover change on the terrestrial water cycle. Nature. Clim. Change 3, 385–390 (2012). Article ADS Google Scholar * Barnett, T. P. et al. Human-Induced Changes in the
Hydrology of the Western United States. Science 319, 1080–1083 (2008). Article CAS ADS Google Scholar * Wentz, F. J., Ricciardulli, L., Hilburn, K. & Mears, C. How Much More Rain
Will Global Warming Bring? Science 13, 233–235 (2007). Article ADS Google Scholar * Min, S.-K., Zhang, X., Zwiers, F. W. & Hegerl, G. C. Human contribution to more-intense
precipitation extremes. Nature 470, 378–382 (2011). Article CAS ADS Google Scholar * Douville, H., Ribes, A., Decharme, B., Alkama, R. & Sheffield, J. Anthropogenic influence on
multidecadal changes in reconstructed global evapotranspiration. Nature Clim. Change 3, 59–62 (2013). Article ADS Google Scholar * Woodward, C., Shulmeister, J., Larsen, J., Jacobsen, G.
E. & Zawadzki, A. The hydrological legacy of deforestation on global wetlands. Science 14, 844–847 (2014). Article ADS Google Scholar * Feng, H. & Liu, Y. Trajectory based
detection of forest-change impacts on surface soil moisture at a basin scale [Poyang Lake Basin, China]. J. Hydrol. 514, 337–346 (2014). Article ADS Google Scholar * Feng, H. & Zhang,
M. Global land moisture trends: drier in dry and wetter in wet over land. Sci. Rep 5, 18018(2015). Article CAS ADS Google Scholar * Sheffield, J. & Wood, E. F. Characteristics of
global and regional drought, 1950–2000: Analysis of soil moisture data from off-line simulation of the terrestrial hydrologic cycle. J. Geophys. Res. 112, D17115 (2007). Article ADS Google
Scholar * Sheffield, J. & Wood, E. F. Global Trends and Variability in Soil Moisture and Drought Characteristics, 1950–2000, from Observation-Driven Simulations of the Terrestrial
Hydrologic Cycle. J. Clim 21, 432–458 (2008). Article ADS Google Scholar * Fensholt, R. & Proud, S. R. Evaluation of Earth Observation based global long term vegetation trends —
Comparing GIMMS and MODIS global NDVI time series. Remote Sens. Environ 119, 131–147 (2012). Article ADS Google Scholar * Jong, R. d., Bruin, S. d., Wit, A. d., Schaepman, M. E. &
Dent, D. L. Analysis of monotonic greening and browning trends from global NDVI time-series. Remote Sens. Environ 115, 692–702 (2011). Article ADS Google Scholar * Randow, R. C. S. v.,
Randow, C. v., Hutjes, R. W. A., Tomasella, J. & Kruijt, B. Evapotranspiration of deforested areas in central and southwestern Amazonia. Theor. Appl. Climatol 109, 205–220 (2012).
Article ADS Google Scholar * Jasechko, S. et al. Terrestrial water fluxes dominated by transpiration. Nature 496, 347–351 (2013). Article CAS ADS Google Scholar * Wohl, E. et al. The
hydrology of the humid tropics. Nature Clim. Change 2, 655–662 (2012). Article ADS Google Scholar * Taylor, C. M., Jeu, R. A. M. d., Guichard, F., Harris, P. P. & Dorigo, W. A.
Afternoon rain more likely over drier soils. Nature 489, 423–426 (2012). Article CAS ADS Google Scholar * Seneviratne, S. I. et al. Investigating soil moisture–climate interactions in a
changing climate: A review. Earth-Sci. Rev 99, 125–161 (2010). Article CAS ADS Google Scholar * Huber, S., Fensholt, R. & Rasmussen, K. Water availability as the driver of vegetation
dynamics in the African Sahel from 1982 to 2007. Global. Planet. Change 76, 186–195 (2011). Article ADS Google Scholar * Davidson, E. A. et al. The Amazon basin in transition. Nature
481, 321–328 (2012). Article CAS ADS Google Scholar * Mapa, R. B. Effect of reforestation using Tectona grandis on infiltration and soil water retention. Forest. Ecol. Manag 77, 119–125
(1995). Article Google Scholar * Dorigo, W. A. et al. Evaluation of the ESA CCI soil moisture product using ground-based observations. Remote Sens. Environ 162, 380–395 (2015). Article
ADS Google Scholar * Feng, H. & Liu, Y. Combined effects of precipitation and air temperature on soil moisture in different land covers in a humid basin. Journal of Hydrology 531,
1129–1140 (2015). Article ADS Google Scholar Download references ACKNOWLEDGEMENTS This work was supported in part by the National Natural Science Foundation of China (41430855, 41501034)
and Natural Science Foundation of Jiangsu Province (Jiangsu Provincial Natural Science Foundation (BK20151061, BK20130567). We highly appreciate the anonymous reviewers for their
constructive comments on this manuscript. AUTHOR INFORMATION AUTHORS AND AFFILIATIONS * Key Laboratory of Watershed Geographic Sciences, Nanjing Institute of Geography and Limnology, Chinese
Academy of Sciences, Nanjing, 21008, China Huihui Feng Authors * Huihui Feng View author publications You can also search for this author inPubMed Google Scholar CONTRIBUTIONS H.F. proposed
main idea, carried out data processing and analysis, and wrote the paper. ETHICS DECLARATIONS COMPETING INTERESTS The author declares no competing financial interests. RIGHTS AND
PERMISSIONS This work is licensed under a Creative Commons Attribution 4.0 International License. The images or other third party material in this article are included in the article’s
Creative Commons license, unless indicated otherwise in the credit line; if the material is not included under the Creative Commons license, users will need to obtain permission from the
license holder to reproduce the material. To view a copy of this license, visit http://creativecommons.org/licenses/by/4.0/ Reprints and permissions ABOUT THIS ARTICLE CITE THIS ARTICLE
Feng, H. Individual contributions of climate and vegetation change to soil moisture trends across multiple spatial scales. _Sci Rep_ 6, 32782 (2016). https://doi.org/10.1038/srep32782
Download citation * Received: 12 May 2016 * Accepted: 15 August 2016 * Published: 07 September 2016 * DOI: https://doi.org/10.1038/srep32782 SHARE THIS ARTICLE Anyone you share the following
link with will be able to read this content: Get shareable link Sorry, a shareable link is not currently available for this article. Copy to clipboard Provided by the Springer Nature
SharedIt content-sharing initiative