- Select a language for the TTS:
- UK English Female
- UK English Male
- US English Female
- US English Male
- Australian Female
- Australian Male
- Language selected: (auto detect) - EN
Play all audios:
ABSTRACT Latent human immunodeficiency virus (HIV) infections occur when the virus occupies a transcriptionally silent but reversible state, presenting a major obstacle to cure. There is
experimental evidence that random fluctuations in gene expression, when coupled to the strong positive feedback encoded by the HIV genetic circuit, act as a ‘molecular switch’ controlling
cell fate, i.e., viral replication versus latency. Here, we implemented a stochastic computational modeling approach to explore how different promoter activation mechanisms in the presence
of positive feedback would affect noise-driven activation from latency. We modeled the HIV promoter as existing in one, two, or three states that are representative of increasingly complex
mechanisms of promoter repression underlying latency. We demonstrate that two-state and three-state models are associated with greater variability in noisy activation behaviors and we find
that Fano factor (defined as variance over mean) proves to be a useful noise metric to compare variability across model structures and parameter values. Finally, we show how three-state
promoter models can be used to qualitatively describe complex reactivation phenotypes in response to therapeutic perturbations that we observe experimentally. Ultimately, our analysis
suggests that multi-state models more accurately reflect observed heterogeneous reactivation and may be better suited to evaluate how noise affects viral clearance. SIMILAR CONTENT BEING
VIEWED BY OTHERS STOCHASTIC PAUSING AT LATENT HIV-1 PROMOTERS GENERATES TRANSCRIPTIONAL BURSTING Article Open access 23 July 2021 PRECISE PROGRAMMING OF MULTIGENE EXPRESSION STOICHIOMETRY IN
MAMMALIAN CELLS BY A MODULAR AND PROGRAMMABLE TRANSCRIPTIONAL SYSTEM Article Open access 17 March 2023 HIV-TOCKY SYSTEM TO VISUALIZE PROVIRAL EXPRESSION DYNAMICS Article Open access 20
March 2024 INTRODUCTION Noise in gene expression can lead to detectable phenotypic heterogeneity between cells in an otherwise genetically identical population1. The origins of molecular
noise are biochemical in nature and can result from intrinsic or extrinsic sources, including fluctuations in promoter transitions between inactive and active states, random timing of
transcription or translation reactions, variations in cellular microenvironment, differences in cell size, asymmetric partitioning of cellular components following division, as well as
fluctuations in abundances and availability of transcription factors, polymerases and ribosomes2,3,4,5,6. In eukaryotic systems, the local chromatin environment at the promoter is thought to
contribute significantly to gene expression noise3. A gene is able to transcribe relatively freely when the chromatin environment surrounding the promoter is in an open, acetylated
configuration and nucleosomes are not occluding the transcription start site. However, transcription is repressed when the chromatin is in a condensed state4. Although direct evidence of
chromatin remodeling as the primary cause of stochastic gene expression has proven elusive, several studies have indirectly linked chromatin-related events to stochastic gene
expression7,8,9. Furthermore, recent electron microscopy observations in budding yeast have shown nucleosome configurations to be intrinsically stochastic10. Here, we focused on a clinically
relevant problem–latency in human immunodeficiency virus-1 (HIV) infection–wherein noise at the promoter is regulated by epigenetic features at the integration site8 and may have
significant implications for disease outcomes11. For patients infected with HIV, latent reservoirs of infected resting memory CD4 + T cells escape detection by the immune system and are
unaffected by highly active anti-retroviral therapy (HAART)–thus remaining one of the biggest obstacles to permanent cure12. Clinical research efforts have focused on an ‘activate-and-kill’
strategy to therapeutically reactivate the latent pool with small molecule drugs or cytokines that would result in death of the reservoir by host immune responses or by viral cytopathic
effects13. However, recent experimental evidence from patient samples suggests that reactivation from a latent state may be a probabilistic phenomenon with latent proviruses remaining
inactive despite maximal T cell stimulation14. Biological noise in viral transcription from the HIV promoter could be the cause of such probabilistic reactivation15 and therefore, the
ultimate success of any strategy directed towards purging the latent reservoir may depend on countering the effects of noise generated by the HIV genetic circuit. The HIV promoter has been
put forward as a model for noisy gene expression that is influenced by its local epigenetic environment3. This promoter consists of a 5′ long-terminal repeat (LTR) region that contains a
positioned nucleosome at the transcriptional start site, as well as binding sites for key regulators such as NF-κB and Sp112,16. Experimental studies have revealed a critical role of
nucleosome organization at the LTR and chromatin density at the site of integration in regulating noise8. However, for noise in gene expression to have phenotypic consequences, there must be
a means of stabilizing differences in the cell population that arise stochastically1. Positive feedback provides a mechanism to amplify and stabilize stochastic fluctuations to produce
bimodal and in some cases bistable populations. The HIV genome encodes for such a positive transcriptional regulator called _Tat_, or Trans-activator of transcription. Stochastic
fluctuations in Tat expression play an essential role in the replication-versus-latency decision of proviruses because Tat is capable of powering a strong positive feedback loop that
auto-stimulates its own expression 50- to 100-fold over basal levels17,18. These fluctuations drive phenotypic bifurcation, in which cells with low Tat and high Tat expression co-exist
within clonal populations19,20. High Tat expression results in ‘productive’ viral replication whereas low Tat expression maintains ‘unproductive’ latent infections. Due to probabilistic
initiation of transcription, there can be long delays prior to cells transitioning from an unproductive to a productive state19, which likely contribute to heterogeneous reactivation from
latency21. Consequently, stochastic fluctuations in the underlying regulatory mechanisms controlling HIV gene expression can drive cells to distinct phenotypic states that may be related to
viral latency. If noise-driven gene expression underlies viral latency, then computational models that describe how regulatory mechanisms at the promoter affect heterogeneous viral
activation could be used to assess treatment strategies focused on reducing or eliminating the latent reservoir. Here, we present a computational analysis of stochastic HIV gene expression
coupled with Tat positive feedback for different promoter activation mechanisms. Through systematic evaluation of one-, two- and three-state promoter models, we investigate how noise in
protein production generated by these different promoter configurations–when coupled to the HIV genetic circuit–modulate heterogeneous reactivation from latency. We demonstrate that the
greater parameter space afforded by mathematical models of transcription containing multiple promoter states can reproduce a range of experimentally observed behaviors following virus
reactivation that are indicative of the numerous biological mechanisms that maintain latent infections. RESULTS AND DISCUSSION INTERACTION BETWEEN BASAL TRANSCRIPTION AND STRENGTH OF
POSITIVE FEEDBACK DRIVES HETEROGENEOUS ACTIVATION IN A ONE-STATE PROMOTER MODEL Biologically, we can imagine an ‘ideal’ promoter configuration for HIV reactivation as a fully active provirus
with all transcriptional machinery available in order to induce sustained viral mRNA synthesis. Such a configuration is characterized by binding of NF-κB and Sp1 to their respective sites
on the LTR, acetylated histones at the promoter and a displaced nucleosome-1 (Nuc-1), such that the transcription start site is accessible for continuous binding and initiation of
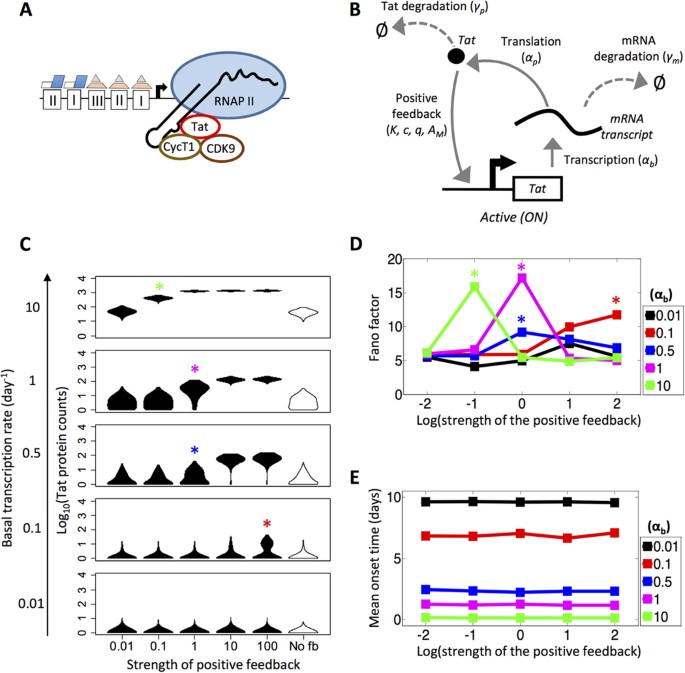
transcription by RNA polymerase II (RNAPII) (Fig. 1A)16,22. Mathematically, the simplest network that permits us to simulate this configuration is a model with a single promoter state
(termed ‘one-state model’) incorporating equations for transcription, translation, degradation and Tat-mediated positive feedback (Fig. 1B). To explore the parameter space of this one-state
model, we first asked how the dynamics of transcription would be affected by varying the basal transcription rate (αb) and the strength of the Tat-mediated positive feedback (c) (see METHODS
for a description of these parameters). We simulated HIV promoter activity up to 10 days and compared how heterogeneous distributions in endpoint protein values changed for different values
of basal transcription and positive feedback strength (Fig. 1C). As basal transcription is increased from 0.01 to 10 day−1, mean counts of Tat steadily increase for every value of positive
feedback strength analyzed (from 0.01 to 100). In particular, for all positive feedback strengths sampled, the distributions transition through three stages characterized by increasing means
(μ) of Tat production: an ‘initial’ state (μ < 1), an ‘intermediate’ state (μ > 1, although some cells still have Tat counts of 0) and a ‘final’ state (μ > 1 and all cells have Tat
> 0). We note that for the lowest feedback strength (c = 0.01), the endpoint protein distributions are similar to a model with no Tat positive feedback (Fig. 1C, FAR RIGHT). To quantify
how varying basal transcription rate and positive feedback strength affects noise in gene expression, we computed Fano factor (defined as variance over mean; ρ = σ2/μ; units of protein
counts) and coefficient of variation squared (CV2; defined as variance over mean-squared; σ2/μ2) for the endpoint protein distributions. Our analysis shows that for basal transcription rates
greater than 0.1 day−1, the Fano factor rises and falls as the strength of the positive feedback increases. Moreover, as the basal transcription rate decreases, peaks in Fano factor occur
at higher feedback strengths (Fig. 1D). For basal transcription rates of 0.1, 0.5 and 1 day−1, the Fano factor peak corresponds to the system in an ‘intermediate’ phenotype (μ > 1, Tat ≥
0) (Fig. 1C, RED, BLUE AND MAGENTA ASTERISKS). However, for a basal transcription rate of 10 day−1, the Fano factor peak is associated with a high productivity state across all cells (μ >
1, Tat > 0) (Fig. 1C, GREEN ASTERISK). The trend in Fano factors in the one-state model suggests that for high basal transcription rates, noise profiles peak when transcription is weakly
amplified by feedback, causing a widening of the endpoint protein distribution. However, for low basal transcription rates, noise profiles peak when transcription is amplified by strong
feedback and cell populations sample an ‘intermediate’ phenotype that may correspond to different cell fates (i.e., the presence and absence of protein product). Meanwhile, CV2 decreases
monotonically as basal transcription is increased (Supplementary Figure S1). Notably, as positive feedback is strengthened and cells transition across ‘initial’ (μ < 1) or ‘intermediate’
(μ > 1, Tat ≥ 0) states to higher productivity phenotypes (μ > 1, Tat > 0), CV2 drops (as can be seen in trend lines for basal transcription rates of 0.1, 0.5 and 1 day−1;
Supplementary Figure S1). Next, we calculated mean onset time under varying conditions of basal transcription and strength of the positive feedback. We defined onset time as the earliest
presence of non-zero protein counts within a time trace. If protein counts were zero for the entire course of the simulation, mean onset time was set artificially as 10 days–the maximum
amount of the time that the simulations were allowed to run. The strength of the positive feedback did not affect mean onset time, while the basal rate of transcription did (Fig. 1E). As the
basal transcription rate was increased, the mean onset time decreased approximately linearly. Note that at lower basal transcription rates, the inverse relationship to mean onset time
appears non-linear due to the upper limit of 10 days. The sensitivity analysis of a one-state model with positive feedback demonstrated that we could simulate a system that exhibited
distinct stages of Tat production under varying basal transcription rates. At a positive feedback strength of 1, the system clearly exhibits three distinct phases as basal transcription is
increased–an ‘initial’ state with low Fano factor, an ‘intermediate’ state with increased Fano factor and a ‘final’ state with low Fano factor and high mean (Fig. 1C). Therefore, for our
remaining simulations, we set positive feedback strength to 1 in order to deemphasize Tat regulation within the cell (see METHODS) and rather focus on assessing noise within the viral
genetic circuit due to promoter activation mechanisms, transcription and translation. Furthermore, we used the one-state model to set a threshold for viral activation, occurring between
‘intermediate’ and ‘final’ states of Tat production (i.e., between basal transcription rates of 1 and 10 day−1 at a feedback strength of 1 from Fig. 1C), beyond which we assumed cells would
be associated with a fully productive infection (or “ON” state). Therefore, we set basal transcription rate to 3 day−1, which resulted in a one-state model that exhibited monostable behavior
with a stable equilibrium point at approximately 316 Tat protein molecules (see METHODS and Supplementary Figures S2). In subsequent analyses, we used this threshold to explore how the
dynamics and noise profiles of two- and three-state promoter models affect heterogeneity of viral activation phenotypes. COOPERATIVITY AND TRANSCRIPTIONAL AMPLIFICATION INCREASE NOISE IN THE
ONE-STATE MODEL We next explored how adding cooperativity to Tat positive feedback would affect dynamics and noise profiles in the one-state model (Supplementary Figure S3A). Biologically,
cooperative feedback describes a mechanism by which multiple copies of Tat are necessary to auto-stimulate Tat expression. The experimental literature demonstrating Tat cooperativity is
limited. While a few studies show that Tat can dimerize23, or multiple Tat molecules interact with the RNAPII-TAR complex during transcription24, most have argued against a cooperative
mechanism25,26. For this reason, previous computational studies have generally modeled Tat positive feedback without requiring cooperativity; however, we include it here to consider how it
affects activation noise. The Hill coefficient (q) was varied from 1 to 5 at a basal transcription rate of 3 day−1. When multiple steady states were present (e.g., for q = 3), the simulation
runs tended to stabilize at the lower steady state value because the model was run with an initial Tat protein count of 0 (Supplementary Figure S3B). When compared to a model without
cooperative feedback at the same basal transcription rate (Supplementary Figures S2), the cooperative feedback model (e.g., for q = 3) exhibited bistable behavior (indicative of two stable
phenotypes) with greater tendency towards the unproductive state (only 103 out of 1000 productive simulations; Supplementary Figure S3C). Overall, cell activation decreased with increasing
q, while Fano factor peaked at a q of 3 (Supplementary Figure S3D). Mean onset time and mean first passage time did not change significantly with increasing q. Finally, in modeling the
one-state system, we had assumed a production of one transcript per event. However, previous studies have demonstrated that transcriptional amplification may play a role in increasing gene
expression noise27,28. Therefore, we assessed the influence of transcriptional amplification (AMP) of 10 and 100 on noise profiles in the one-state promoter model wherein multiple
transcripts are synthesized per event (see METHODS and Supplementary Figure S4A). When basal transcription was again set at a rate of 3 day−1, cell activation was already close to 100%, but
variability in the protein levels of activated cells increased greatly with strong amplification leading to very large differences in Fano factor (Supplementary Figure S4B). ASSESSING
METRICS OF VIRAL ACTIVATION AND NOISE ACROSS VARYING TRANSCRIPTIONAL BURSTING BEHAVIORS IN A TWO-STATE PROMOTER SYSTEM In most eukaryotic cells, transcription occurs in bursts as a gene
transitions infrequently from an inactive to an active state, thus yielding large cell-to-cell variation in mRNA molecules4,9,29. Experimental evidence suggests that nucleosome remodeling
contributes to transcriptional bursting behavior. Promoters are often silenced in the presence of a nucleosome (i.e., produce few to no transcripts), but can drive high levels of
transcription once the nucleosome is displaced or repositioned. Others have speculated that the requirement for transcription factor-mediated recruitment of multi-component transcriptional
complexes could be an underlying cause of transcriptional bursting30,31. In the specific case of the HIV LTR promoter, restrictive Nuc-1 is present immediately downstream of the start site,
occluding transcription and thus needs to be displaced by chromatin remodeling complex PBAF16,22. Moreover, transcription factors NF-κB, NFAT and Sp1 all play a critical role in
transcription initiation and promoter clearance16. For our purposes, we assumed the influence of chromatin and cis-acting regulatory elements were represented by two distinct promoter states
(Fig. 2A). Mathematically, activation from distinct promoter states is represented by probabilistic transitions between inactive and active states (referred to as a ‘two-state model’; Fig.
2B). The bursting behavior of the model is defined by two parameter groups: burst size and normalized burst frequency. Burst size, or the number of transcripts produced when the promoter is
in the active state, is defined as the Tat-independent transcription rate (αb) divided by the inactivation rate of the promoter (ki). Burst frequency is defined as promoter activation rate
(kb) normalized to the transcript degradation rate (γm). We further assumed that Tat positive feedback increases both αb and kb. Two-state models have been used previously to model HIV
transcription8,30,32,33 because constitutive, one-state models of gene expression were unsatisfactory in explaining noise in HIV gene expression. For example, modulation of burst size and
burst frequency parameters in a two-state model was able to accurately describe experimentally observed gene expression variability for LTRs integrated across the genome32,33. Notably, these
experimental systems and computational models lacked Tat-positive feedback. A subsequent study incorporated Tat-positive feedback with a two-state gene model to explore the influence of
mutations at the Sp1 binding site within the HIV LTR on heterogeneous phenotypes19. Here, we investigated how the greater parameter space afforded by the addition of an inactive state would
increase the range of heterogeneous reactivation behaviors when coupled to feedback. To this end, we solved the steady-state deterministic solutions for different parameter sets of burst
size and frequency (Fig. 2C). Then, we identified three parameter regions of interest by simulating two different parameter sets within each region and solved for the end-point protein
distributions using a stochastic modeling approach (Fig. 2D). We categorized these regions as: fully unproductive (all cells have Tat < threshold), variably productive (some cells have
Tat > threshold) and fully productive (all cells have Tat > threshold). Similar to the results for the one-state model, as the basal transcription rate is increased either by
increasing burst size or burst frequency, the cell populations transition from unproductive unimodal states to variably productive, typically bimodal states and then to fully productive
unimodal states. Focusing specifically on the region characterized by variably productive states, we varied burst size and burst frequency and computed mean protein counts (Fig. 3A), cell
activation (Fig. 3B) and mean first passage time (i.e., the minimum amount of time it takes for a cell to transition from an unproductive to a productive state) (Fig. 3C), as well as mean
onset time (Supplementary Figure S5). As burst size and frequency was increased, mean protein counts increased as expected (Fig. 3A). Moreover, the bands of varying mean protein counts are
roughly symmetrical along the diagonal indicating that very high burst frequency coupled with low burst size or very high burst size coupled with low burst frequency will result in similar
means. At the band indicating protein counts between 250 and 500, a small fraction of cells begin to occupy the activated state, as determined by the threshold of ~316 Tat proteins (Fig.
3B). However, on average these cells tend to have a very late first passage time (Fig. 3C). The heat maps for cell activation and first passage time together demonstrate the minimum burst
size and frequency necessary to activate transcription in the two-state model and a full transition from an unproductive to productive cell population occurs within a relatively narrow
parameter region. We note that even for populations with fully productive end points, characterized by relatively high burst sizes and burst frequencies, wide variations in first passage
time exist. For the two-state model, we examined different measures of noise: the square of the coefficient of variation or CV2 (σ2/μ2; Fig. 3D) and Fano factor (σ2/μ; Fig. 3E) of endpoint
protein distributions. Interestingly, these measures of noise peak in different phenotypic regions. We observe that CV2 peaks at low burst frequency and low burst size, when mean protein
counts are very low (Fig. 3D). For any fixed burst size, CV2 decreases monotonically as burst frequency increases, similar to the observation for mean onset time (Supplementary Figure S5).
Likewise, for any fixed burst frequency, CV2 decreases as burst size increases, except at the very low (non-zero) burst frequencies. In contrast, Fano factor is low at low values of burst
size and burst frequency and rather peaks at the highest burst sizes paired with the lower range of burst frequencies sampled (Fig. 3E). The Fano factor is driven largely by burst size in a
two-state model without feedback34; however, in the presence of feedback, it is also dependent on the burst frequency. In contrast to CV2, which reaches a minimum level as the cell
population becomes fully productive, the Fano factor peaks as the cell population moves through a region of variably productive phenotypes and decreases as the cells become fully productive.
The highest Fano factors are thus associated with intermediate levels of cell activation, suggesting that the Fano factor is a more informative measure of phenotypic heterogeneity in this
system. To better understand how Fano factor is coupled to phenotypic heterogeneity, we mapped paths in parameter space that transitioned the population from 0% to >90% cell activation
(i.e., from fully unproductive to variably/fully productive) and calculated the corresponding Fano factor ranges. In the first case, we examined the behavior of cell populations that
transitioned over similar Fano factor ranges but displayed distinct heterogeneous phenotypes. Burst frequency was held constant at 0.7 while burst size was increased (Fig. 3E, PATH 1 and
Fig. 3F), or burst size was held constant at 0.16 while burst frequency was increased (Fig. 3E, PATH 2 and Fig. 3G). While the Fano factor profiles of paths 1 and 2 appeared similar (Fig.
3H), transitioning the population by increasing burst size resulted in bimodal phenotypes for a narrow range of burst sizes, but was associated with a widening “ON” peak and high maximum
protein counts (Fig. 3F). By contrast, when cells were transitioned by increasing burst frequency, cells exhibited distinct bimodal phenotypes over a wide range of burst frequencies, but the
maximum protein count was much lower and the width of “ON” peak plateaued (Fig. 3G). In the second case, cell populations were transitioned from low to high productivity but with low or
high Fano factor peaks. In this case, burst frequency was held constant at 1.4 while burst size was increased (Fig. 3E, PATH 3 and Fig. 3I), or burst size was held constant at 0.47 while
burst frequency was varied (Fig. 3E, PATH 4 and Fig. 3J). For these specific paths, both transitions occur over a narrow parameter range with similar endpoint protein distributions (Fig.
3I,J), but the Fano factor peaks are distinct (Fig. 3K). Path 4 has a high Fano factor peak associated with a region of distinct bimodal populations (Fig. 3J), while Path 3 has a lower Fano
factor peak associated with less distinct bifurcations (Fig. 3I). Interestingly, if the same sets of paths are charted in a plot of coefficient of variation (σ/μ), these noise profiles
appear nearly identical (Supplementary Figure S6). Thus, Fano factor is a good indicator of heterogeneous phenotypes, with the highest values generally associated with bimodal distributions.
Fano factor values are also associated with patterns in first passage time. Examining first passage time for paths 1 and 3, we see that at higher burst frequencies, the transition from an
unproductive to productive state is faster than at lower burst frequencies. Correspondingly, higher burst frequencies are associated with decreased Fano factor. Meanwhile at lower burst
frequencies, cells are delayed in the process of transitioning to a productive state and therefore, they are associated with the highest Fano factors at increasing burst size values. Taken
together, these observations suggest that “tuning” burst size and burst frequency in the two-state model with feedback has differential effects on the distribution of protein counts. For
instance, increasing the burst frequency at low, constant burst sizes reduces the variability in protein count in “ON” cells. By contrast, increasing burst size raises the mean protein count
in “ON” cells by extending the distribution tail length, which results in increased variability. ASSESSING THE EFFECT OF TAT COMPARTMENTALIZATION ON NOISE AND VIRAL ACTIVATION BEHAVIORS IN
A TWO-STATE PROMOTER SYSTEM We also considered the influences of cellular compartmentalization on viral activation and noise in order to understand if additional steps in Tat production and
positive feedback might influence the overall behavior of the system. First, we built a compartmentalized version of the two-state model by introducing additional reactions (see METHODS).
Mainly, an export reaction for mRNA from the nucleus to cytoplasm and an import reaction for Tat from the cytoplasm to the nucleus were both added (Supplementary Figure S7A). We further
replaced generic mRNA and Tat species with nuclear mRNA (mRNAn), nuclear Tat (Tatn), cytoplasmic mRNA (mRNAc), cytoplasmic Tat (Tatc) and modified the reaction propensities such that only
nuclear Tatn affected positive feedback. At physiological rates of mRNA export and Tat import chosen from previous modeling studies (see METHODS for rates), we observed that metrics for
viral activation and noise (mean first passage time, cell activation, Fano factor and mean onset time) did not change significantly from a two-state model without compartmentalization
(compare Supplementary Figure S7B with Fig. 3). Only when the transport rates were slowed 10 to 100-fold did we observe significant variations in viral activation and noise, including
significant delays in onset time of Tat production (Supplementary Figure S7C and S7D). Therefore, we conclude that promoter bursting contributes more to noise in HIV reactivation than Tat
compartmentalization. TRANSCRIPTIONAL BURSTING BEHAVIORS IN A THREE-STATE PROMOTER SYSTEM AND COMPARISON OF NOISE PROFILES WITH A TWO-STATE PROMOTER SYSTEM Although two-state models have
been successfully used to describe experimental observations of transcription from the HIV LTR promoter32,33, in all cases these promoters are more productive (with higher burst sizes) than
we expect for latent viral integrations _in vivo_. In another experimental study of transcriptional bursting across the mammalian genome it was observed that the time spent in the inactive
promoter state can be very long35. In these cases, the inactive state is better described by a refractory period in the “OFF” state modeled by two sequential processes, before the gene can
be switched on again36. Including multiple inactive states via a three-state promoter system could provide a means to model a highly repressed stage characterized by hypermethylated CpG
islands, which are considered distinct from the more reversible form of silencing mediated by the recruitment of histone deacetylases16 (Fig. 4A). To account for the presence of different
silencing mechanisms, we described the three-state model with two inactive states: repressed “OFF” and intermediate “OFF” states. We considered transitions from the repressed to intermediate
state (e.g., indicative of DNA methylation reversal) and from the intermediate to active state (e.g., indicative of acetylation; Fig. 4B). Tat-mediated positive feedback amplified the
transcription rate in the active state (αb) and the transition rate from the intermediate inactive state to the active state (kb), but it did not affect the transition from the repressed to
intermediate “OFF” state, consistent with our biological assumptions. We varied the parameters accounting for the transition between the repressed and intermediate states (kON and kOFF) over
four orders of magnitude (0.01, 0.1, 1 and 10 day−1). This range for kON allowed us to sample rates that are smaller or on the same order of magnitude as kb (0.48 to 7.2 day−1 for the
three-state model). For kOFF, the range of 0.01 to 10 day−1 is slower than the ki value fixed in the model (96 day−1), based on the assumption that these longer-term remodeling events
represented by the transition from the intermediate to repressed state would occur more slowly than the transition from the active to intermediate state. We again varied transcriptional
burst size and frequency as in the two-state model and computed mean protein counts, cell activation, Fano factor and mean first passage time (Fig. 4C and Supplementary Figures S8–S11). We
observed that kON and kOFF rates of 0.01 day−1 are not enough to activate cells by the end of ten days. A small fraction of cells activate at kON and kOFF rates of 0.1 day−1 (Fig. 4C).
Adjusting the rates of kON and kOFF relative to each other produced expected results. For instance, increasing kON while holding kOFF constant produced greater cell activation and trends in
Fano factor began to mimic the two-state model more closely. However, increasing kOFF while holding kON constant decreased cell activation leading to unproductive simulations (Supplementary
Figures S9 and S10). Observing transition rates from kON = kOFF = 0.01 up to kON = kOFF = 10 day−1, relative Fano factor values provide an indication of the most important changes in cell
activation dynamics as compared to a two-state model, but these differences depend on the value of burst frequency for the transition to the active state (Fig. 5). At a low burst frequency
value of 0.3, Fano factor increases with burst size in both the two and three-state models; however, while the two-state model achieves intermediate cell activation (60%), the three-state
models analyzed achieve no more than 11% activation (Fig. 5A,B). Note that for the three-state models, mean protein counts are generally less than the activation threshold for this burst
frequency value (Fig. 5C). At a high burst frequency value of 1.5, the Fano factor trends for the three-state model change significantly for different values of kON and kOFF. For kON = kOFF
= 10, the Fano factor peaks and begins to gradually fall as the cells transition from a fully unproductive to a fully productive state (Fig. 5D,E). In contrast, a three-state model with kON
= kOFF = 0.01 is associated with a very high and increasing Fano factor and a low percentage of cells activating over the analyzed burst size range. At a high burst frequency value, raising
kON from 0.01 to 10 results in a corresponding increase in mean protein counts from below to above the activation threshold (Fig. 5F and Supplementary Figure S8). Overall, Fano factor proves
to be a useful metric to compare and distinguish heterogeneous population behaviors between the two- and three-state models. EXPERIMENTAL MEASUREMENTS OF HIV PROTEIN DISTRIBUTIONS ARE
QUALITATIVELY DESCRIBED BY A THREE-STATE MODEL The three-state model of the LTR promoter can be used to more accurately describe experimental latency cell line models that have multiple
mechanisms of repression, which may in turn require different combinations of drugs to reverse latency. For example, the additional parameter space afforded by a third promoter state can be
used to describe highly restrictive epigenetic modifications such as CpG methylation that are characteristic of some _in vitro_ HIV latency cell lines37, but are not present in others (Fig.
6A versus 6B). Importantly, it can be difficult to detect differences in chromatin repression across different HIV latency cell lines simply by measuring experimental protein distributions
in the basal state by flow cytometry. For example, the basal protein expression for an HIV latency cell line in which transcription is highly repressed by CpG methylation (Fig. 6C, TOP LEFT)
is virtually identical to the basal protein expression for a cell line in which there is relatively little CpG methylation, but hypoacetylation and low transcription factor levels that,
when combined, may only be weakly maintaining the latent state (Fig. 6D, TOP). However, when these different cell lines are stimulated with drugs to reverse latency, the differences in
repression lead to clear differences in response. For example, CpG-methylated LTRs exhibit little expression after tumor necrosis factor (TNF) stimulation (Fig. 6C, BOTTOM LEFT), while
permissive LTRs exhibit strong expression after stimulation (Fig. 6D, BOTTOM). Reversing CpG methylation via chemical perturbation with 5-aza-2-deoxycytidine (Aza), a CpG methylase
inhibitor, does not increase expression on its own (Fig. 6C, TOP RIGHT). However, co-stimulation of the CpG-methylated promoter with TNF and Aza results in expression that is similar to the
permissive HIV latency model cell line (Fig. 6C, BOTTOM RIGHT). A computational model with three promoter states provides the necessary parameters to describe these differences in repressive
mechanisms acting at the promoter and can qualitatively capture the effect of drug combinations. For example, TNF causes acetylation of histones and increased transcription factor binding
at the promoter38, which we model as an increase in both burst size and burst frequency (Fig. 6E,F). Aza reverses CpG methylation39, which we model as an increase in kON. By increasing only
burst size and burst frequency while keeping kON constant (i.e., adding only TNF) or by increasing only kON while keeping burst size and burst frequency constant (i.e., adding only Aza), our
model accurately predicts there will be no increase in expression (Fig. 6E). However, simulating the addition of both drugs by increasing all parameters results in substantial synergistic
activation (Fig. 6E, BOTTOM RIGHT). In contrast, a two-state model is sufficient to capture experimental observations for a non-CpG-methylated promoter (Fig. 6F). We note that this more
permissive behavior could be captured with a three-state model by assuming high initial values of kON. Overall, we conclude that three-state promoter models may provide more accurate
representations of viral latency that results from multiple biological regulatory mechanisms and exhibits complex responses to drug perturbation. CONCLUSIONS Previous efforts to simulate HIV
transcription and latency via mathematical models have assumed either one or two promoter states, with some studies including Tat-positive feedback and others choosing to exclude
it17,19,30,32,33,40,41. In this article, we took a more comprehensive approach and present a comparative analysis of multiple promoter activation mechanisms featuring many feedback
structures and variations in transcriptional bursting behaviors. We also chose to explore parameter space encompassing very low basal transcription rates that was not considered in previous
studies but may be more representative of latent viral behavior. Furthermore, we presented the novel use of a three-state model (consisting of two inactive states and an active state) in the
specific context of HIV and combined with Tat-positive feedback. We find that this model more accurately reflects observed heterogeneous reactivation and thus may be better suited to
evaluate how noise affects viral clearance. While earlier studies have fit experimental chemical perturbation data derived from cell-line HIV latency models to a two-state LTR
model8,30,31,32,33, our results suggest that the addition of a third state provides more parameters with which to describe the mechanisms that maintain latency and may more accurately fit
experimental data. Two classes of compounds–activators of transcription factors and histone deacetylase (HDAC) inhibitors–are promising examples of HIV latency reversing agents (LRA) that
have been tested across multiple latency models and in patient samples42,43,44. However, these drugs often do not result in complete activation, even in cell line latency models, in part due
to additional mechanisms of repression, including CpG methylation and histone methylation37,45. The three-state model provides a means to mathematically describe these additional repressive
states and more effectively simulate how combinatorial treatments will affect integration sites that are highly restrictive to transcription. Ultimately, the modeling frameworks presented
in this article allowed us to explore how stochastic fluctuations at the level of the promoter contribute to experimentally observed cell-to-cell phenotypic variability in reactivation from
latency. Even though simple computational models as presented in this article can recapitulate a tremendous amount of complexity present in experimental observations, future modeling efforts
can center on more detailed and accurate representations of chromatin biology and transcriptional regulation. METHODS THE ONE-STATE MODEL OF HIV LTR PROMOTER WITH TAT-POSITIVE FEEDBACK The
reactions incorporated in the one-state model with feedback (Fig. 1B) are as follows: A deterministic model of the one-state system with feedback can be represented by the following
differential equations: Here, LTR refers to the HIV promoter which is always in the ‘active’ state; is the mRNA translation rate; is the mRNA degradation rate; and is Tat degradation rate.
The function incorporates mRNA transcription from the HIV LTR as well as Tat transactivation and is given in a Hill form: In EQUATION 7, is the basal rate of mRNA transcription, is the
Tat-mediated amplification factor for mRNA transcription, _K_ is the effector concentration for half-maximum response for the feedback as a function of Tat, _c_ is the strength of the
positive feedback and _q_ denotes the Hill co-efficient. The basal HIV transcription rate is the rate of production of viral transcripts in the absence of Tat transactivation. HIV integrates
semi-randomly into the genome46 and therefore, the basal rate of transcription can vary widely depending on the local chromatin environment of the LTR promoter47. Once Tat positive feedback
is initiated, the basal rate of transcription is amplified to account for the Tat-mediated transactivation of transcription. The strength of the Tat-mediated positive feedback describes how
much each Tat molecule contributes to transactivation, which can be affected by the presence of Tat regulators within a cell18,26,48. Here, we assume the level of amplification (AM)
provided by Tat activity is constant across all integration sites and Tat transactivation follows a Hill form with characteristic constant ‘K’ and a Hill co-efficient ‘q’. For the above
model, the chosen parameters are listed in Table 1. The deterministic equations ignore fluctuations in the system with regard to mRNA and Tat counts. Therefore, to capture the effects of
these fluctuations, we employ a stochastic modeling approach. But first, we record the reaction propensity (ν) and reaction stoichiometry (S). The reaction propensity tells us how frequently
a reaction occurs while the stoichiometry tells us how much the system is changed when the reaction is completed. For synthesis: For degradation: Therefore: Because the LTR is always active
in the one-state model, it remains unchanged. DETERMINING AN ACTIVATION THRESHOLD USING THE ONE-STATE MODEL Previous experimental observations have demonstrated that cells with low and high
levels of Tat expression can co-exist within clonal populations and that high Tat expression can result in ‘productive’ viral replication, while low Tat expression allows cells to remain
‘unproductive’17. In our simulations of the one-state model, the three distinct stages of Tat production (‘initial’, ‘intermediate’ and ‘final’) were characteristic of cell populations with
variegated expression profiles. However, we needed to establish an activation threshold, occurring between ‘intermediate’ and ‘final’ states of Tat production, beyond which cells would
always be associated with fully productive infection. To set the activation threshold, the basal transcription rate for the one-state model was fixed at 3 day−1, which resulted in monostable
behavior indicative of a fully productive infection (Supplementary Figure S2). When solved deterministically, the system had a stable equilibrium point at approximately 316 Tat protein
molecules and when implemented stochastically, 962 out of 1000 simulations crossed this threshold at least once during the time trace (see example of “ON” trace in Supplementary Figure S2).
MODELING TRANSCRIPTIONAL AMPLIFICATION USING THE ONE-STATE MODEL To model transcriptional amplification, mRNA synthesis was modeled as: Which altered the stoichiometric matrix as follows:
EXTENSION TO A TWO-STATE MODEL OF THE HIV LTR PROMOTER WITH POSITIVE FEEDBACK The additional reactions incorporated in a two-state model (Fig. 2B) are as follows: The reactions describing
transcript and protein production/degradation (EQUATIONS 1 through 4, ) remain the same. In EQUATIONS 20 and 21, LTRI refers to an ‘inactive’ HIV promoter in the “OFF” state and LTRA refers
to an ‘active’ promoter in the “ON” state. And, the function , similar to (EQUATION 7), incorporates Tat influence on gene activation as follows: In EQUATION 22, _k__b_ is the rate of gene
activation and _A__G_ is the Tat-mediated amplification factor. Below, we record the reaction propensity (ν) and reaction stoichiometry (S) for the two-state model. Promoter transition
states; assume LTR = 1 for active state (LTRA) and LTR = 0 for inactive state (LTRI): The reactions describing mRNA and Tat synthesis (EQUATIONS 8 through 15, ) remain the same. Therefore,
the stoichiometric matrix and reaction propensity vector for the two-state model are as follows: For the above model, the chosen parameters are listed in Table 1. As seen in the two-state
model chosen, Tat positive feedback is modeled to influence both the gene activation rate (kb) as well as the promoter transcription rate (αb). To better understand the contributions of Tat
positive feedback mechanisms to the overall behavior of the two-state model, we ran simulations wherein one of the feedback loops was knocked out each time. The results indicate that the
feedback loop which directly affects the transcription rate from the promoter (as opposed to the gene activation rate) is particularly sensitive across variations in transcriptional burst
size and frequency (see Supplementary Figure S12). The feedback loop affecting the gene activation rate does not by itself lead to productive cell behavior at the sampled transcriptional
burst sizes and frequencies. MODELING THE EFFECT OF TAT COMPARTMENTALIZATION USING A TWO-STATE PROMOTER MODEL The following additional reactions were incorporated into the two-state model:
Here, _M__EXP_ refers to the mRNA export rate of 62.2 day−1 49 and _T__IMP_ refers to Tat import rate of 499.68 day−1 50. Furthermore, both mRNA and Tat are separated into their nuclear
(mRNAn and Tatn) and cytoplasmic (mRNAc and Tatc) components. The rates for transcript and protein degradation ( and) remain the same as before. Additionally, the two-state model was
modified such that only Tatn participated in the transactivation process. EXPERIMENTALLY MEASURED RANGES OF TRANSCRIPTIONAL BURST SIZES AND FREQUENCIES The bimodal state is indicative of a
variegated expression phenotype wherein cells with low and high mean Tat levels can co-exist within a population. Interestingly, we find that this region of interest occurs within a range of
burst frequencies (0.1 to 1.5) that matched those fit from experimental data in previous studies of the LTR8,33. In contrast, the burst size range was at least an order of magnitude lower
than the ranges measured previously (<0.5) (Supplementary Table S1). Burst sizes extending into experimentally measured ranges all produced fully productive cell populations in our
simulations with strong amplification by Tat-mediated positive feedback (Supplementary Figure S13). We hypothesize that the previous experiments, which used HIV LTR-driven GFP reporters that
lacked Tat, were unable to identify cells with these more repressed integration sites characterized by very low burst sizes, but that this parameter regime might be more relevant for
understanding reactivation from latency. EXTENSION TO A THREE-STATE MODEL OF THE HIV LTR PROMOTER WITH POSITIVE FEEDBACK The additional reactions incorporated in a three-state model (Fig.
4B) are as follows: In EQUATIONS 35 and 36, LTRI refers to an ‘intermediate’ HIV promoter in the “OFF” state and LTRR refers to a ‘repressed’ promoter also in the “OFF” state. _k__ON_ and
_k__OFF_ are parameters that account for the transition between the repressed and intermediate states. The reactions describing active to intermediate state transitions (i.e., EQUATIONS 20
and 21) remain the same. Additionally, the reactions describing transcript and protein production/degradation (EQUATIONS 1 through 4, ) remain the same. Recording reaction propensity and
stoichiometry for the three-state model: For the above model, the chosen parameters are listed in Table 1. THEORETICAL SIMULATIONS All simulations were performed in MATLAB (MathWorks, Inc.)
and simulations were run on High Performance Computing (HPC) clusters at Yale University. For stochastic modeling, we implemented the Gillespie algorithm51 (see also tutorial52 as well as
other computational studies implementing this approach53,54,55). All stochastic simulations were run for a period of 10 days. Mean protein counts, Fano factor, CV and CV2 were computed from
endpoint protein distributions; mean first passage time, mean onset time and cell activation were computed from analyzing individual time traces. In all figures in the main article, the
endpoint protein distributions were computed following 1000 independent Gillespie simulations (except when mentioned; specifically in Supplementary Figures S4 and S7–S13, metrics were
computed after performing 100 independent Gillespie simulations as a representative sample). EXPERIMENTAL METHODS Jurkat T cell clones J-Lat 8.4 and J-Lat 10.6 obtained from NIH AIDS
Research and Reference Reagent Program, Division of AIDS, NIAID, NIH56 were used in Fig. 6C,D as examples of HIV integrated into repressed and permissive chromatin environments,
respectively. Cells were cultured in Roswell Park Memorial Institute (RPMI) media 1640 supplemented with 10% fetal bovine serum, penicillin, streptomycin and L-glutamine and grown at 37 °C
and 5% CO2. Cells were maintained at 2 × 10⁵ cells/mL. Cells were grown to 5 × 10⁵ cells/mL and stimulated with indicated combinations of 5-aza-2′-deoxycytidine (Aza) (Sigma-Aldrich) and
tumor necrosis factor alpha (TNF) (Peprotech). After 48 hours, cells were fixed in 4% formaldehyde. At least 10,000 cells were analyzed for LTR-driven GFP expression on an AccuriTM C6 flow
cytometer (BD Biosciences) for each condition. ADDITIONAL INFORMATION HOW TO CITE THIS ARTICLE: Chavali, A. K. _et al._ Distinct promoter activation mechanisms modulate noise-driven HIV gene
expression. _Sci. Rep._ 5, 17661; doi: 10.1038/srep17661 (2015). REFERENCES * Losick, R. & Desplan, C. Stochasticity and cell fate. Science. 320, 65–68 (2008). Article CAS ADS Google
Scholar * Raser, J. M. & O’Shea, E. K. Noise in gene expression: origins, consequences and control. Science. 309, 2010–2013 (2005). Article CAS ADS Google Scholar * Miller-Jensen,
K., Dey, S. S., Schaffer, D. V. & Arkin, A. P. Varying virulence: epigenetic control of expression noise and disease processes. Trends Biotechnol. 29, 517–525 (2011). Article CAS
Google Scholar * Raj, A. & van Oudenaarden, A. Nature, nurture, or chance: stochastic gene expression and its consequences. Cell. 135, 216–226 (2008). Article CAS Google Scholar *
Swain, P. S., Elowitz, M. B. & Siggia, E. D. Intrinsic and extrinsic contributions to stochasticity in gene expression. Proc. Natl. Acad. Sci. USA 99, 12795–12800 (2002). Article CAS
ADS Google Scholar * Kaern, M., Elston, T. C., Blake, W. J. & Collins, J. J. Stochasticity in gene expression: from theories to phenotypes. Nat. Rev. Genet. 6, 451–464 (2005). Article
CAS Google Scholar * Raser, J. M. & O’Shea, E. K. Control of stochasticity in eukaryotic gene expression. Science. 304, 1811–1814 (2004). Article CAS ADS Google Scholar * Dey, S.
S., Foley, J. E., Limsirichai, P., Schaffer, D. V. & Arkin, A. P. Orthogonal control of expression mean and variance by epigenetic features at different genomic loci. Mol. Syst. Biol.
11, 806 (2015). Article Google Scholar * Raj, A., Peskin, C. S., Tranchina, D., Vargas, D. Y. & Tyagi, S. Stochastic mRNA synthesis in mammalian cells. PLoS Biol. 4, e309 (2006).
Article Google Scholar * Brown, C. R. & Boeger, H. Nucleosomal promoter variation generates gene expression noise. Proc. Natl. Acad. Sci. USA 111, 17893–17898 (2014). Article CAS ADS
Google Scholar * Rouzine, I. M., Razooky, B. S. & Weinberger, L. S. Stochastic variability in HIV affects viral eradication. Proc. Natl. Acad. Sci. USA 111, 13251–13252 (2014).
Article CAS ADS Google Scholar * Siliciano, R. F. & Greene, W. C. HIV latency. Cold Spring Harb. Perspect. Med. 1, a007096 (2011). Article Google Scholar * Deeks, S. G. H. I. V. :
Shock and kill. Nature. 487, 439–440 (2012). Article CAS ADS Google Scholar * Ho, Y. C. et al. Replication-competent noninduced proviruses in the latent reservoir increase barrier to
HIV-1 cure. Cell. 155, 540–551 (2013). Article CAS Google Scholar * Weinberger, A. D. & Weinberger, L. S. Stochastic fate selection in HIV-infected patients. Cell. 155, 497–499
(2013). Article CAS Google Scholar * Karn, J. The molecular biology of HIV latency: breaking and restoring the Tat-dependent transcriptional circuit. Curr. Opin. HIV AIDS. 6, 4–11 (2011).
Article Google Scholar * Weinberger, L. S., Burnett, J. C., Toettcher, J. E., Arkin, A. P. & Schaffer, D. V. Stochastic gene expression in a lentiviral positive-feedback loop: HIV-1
Tat fluctuations drive phenotypic diversity. Cell. 122, 169–182 (2005). Article CAS Google Scholar * Singh, A. & Weinberger, L. S. Stochastic gene expression as a molecular switch for
viral latency. Curr. Opin. Microbiol. 12, 460–466 (2009). Article CAS Google Scholar * Miller-Jensen, K., Skupsky, R., Shah, P. S., Arkin, A. P. & Schaffer, D. V. Genetic selection
for context-dependent stochastic phenotypes: Sp1 and TATA mutations increase phenotypic noise in HIV-1 gene expression. PLoS Comput. Biol. 9, e1003135 (2013). Article CAS ADS Google
Scholar * Burnett, J. C., Miller-Jensen, K., Shah, P. S., Arkin, A. P. & Schaffer, D. V. Control of stochastic gene expression by host factors at the HIV promoter. PLoS Pathog. 5,
e1000260 (2009). Article Google Scholar * Ramji, R., Wong, V. C., Chavali, A. K., Gearhart, L. M. & Miller-Jensen, K. A passive-flow microfluidic device for imaging latent HIV
activation dynamics in single T cells. Integr. Biol. (Camb.). 7, 998–1010 (2015). Article CAS Google Scholar * Rafati, H. et al. Repressive LTR nucleosome positioning by the BAF complex
is required for HIV latency. PLoS Biol. 9, e1001206 (2011). Article CAS Google Scholar * Frankel, A. D., Bredt, D. S. & Pabo, C. O. Tat protein from human immunodeficiency virus forms
a metal-linked dimer. Science. 240, 70–73 (1988). Article CAS ADS Google Scholar * Zhou, C. & Rana, T. M. A bimolecular mechanism of HIV-1 Tat protein interaction with RNA
polymerase II transcription elongation complexes. J. Mol. Biol. 320, 925–942 (2002). Article CAS Google Scholar * Kittiworakarn, J. et al. HIV-1 Tat raises an adjuvant-free humoral immune
response controlled by its core region and its ability to form cysteine-mediated oligomers. J. Biol. Chem. 281, 3105–3115 (2006). Article CAS Google Scholar * Weinberger, L. S. &
Shenk, T. An HIV feedback resistor: auto-regulatory circuit deactivator and noise buffer. PLoS Biol. 5, e9 (2007). Article Google Scholar * Lin, C. Y. et al. Transcriptional amplification
in tumor cells with elevated c-Myc. Cell. 151, 56–67 (2012). Article CAS Google Scholar * Piras, V., Tomita, M. & Selvarajoo, K. Transcriptome-wide variability in single embryonic
development cells. Sci. Rep. 4, 7137 (2014). Article CAS ADS Google Scholar * Raj, A. & van Oudenaarden, A. Single-molecule approaches to stochastic gene expression. Annu. Rev.
Biophys. 38, 255–270 (2009). Article CAS Google Scholar * Dar, R. D. et al. Transcriptional burst frequency and burst size are equally modulated across the human genome. Proc. Natl. Acad.
Sci. USA 109, 17454–17459 (2012). Article CAS ADS Google Scholar * Dar, R. D., Hosmane, N. N., Arkin, M. R., Siliciano, R. F. & Weinberger, L. S. Screening for noise in gene
expression identifies drug synergies. Science. 344, 1392–1396 (2014). Article CAS ADS Google Scholar * Singh, A., Razooky, B., Cox, C. D., Simpson, M. L. & Weinberger, L. S.
Transcriptional bursting from the HIV-1 promoter is a significant source of stochastic noise in HIV-1 gene expression. Biophys. J. 98, L32–34 (2010). Article CAS Google Scholar * Skupsky,
R., Burnett, J. C., Foley, J. E., Schaffer, D. V. & Arkin, A. P. HIV promoter integration site primarily modulates transcriptional burst size rather than frequency. PLoS Comput. Biol. 6
(2010). * Sanchez, A. & Golding, I. Genetic determinants and cellular constraints in noisy gene expression. Science. 342, 1188–1193 (2013). Article CAS ADS Google Scholar * Suter,
D. M. et al. Mammalian genes are transcribed with widely different bursting kinetics. Science. 332, 472–474 (2011). Article CAS ADS Google Scholar * Singh, A., Vargas, C. A. &
Karmakar, R. Stochastic analysis of genetic promoter architectures with memory. IEEE Decis. Contr. 10.1109/CDC.2013.6761034, 7217–7222 (2013). * Blazkova, J. et al. CpG methylation controls
reactivation of HIV from latency. PLoS Pathog. 5, e1000554 (2009). Article Google Scholar * Williams, S. A. et al. NF-kappaB p50 promotes HIV latency through HDAC recruitment and
repression of transcriptional initiation. EMBO J. 25, 139–149 (2006). Article CAS Google Scholar * Kauder, S. E., Bosque, A., Lindqvist, A., Planelles, V. & Verdin, E. Epigenetic
regulation of HIV-1 latency by cytosine methylation. PLoS Pathog. 5, e1000495 (2009). Article Google Scholar * Singh, A., Razooky, B. S., Dar, R. D. & Weinberger, L. S. Dynamics of
protein noise can distinguish between alternate sources of gene-expression variability. Mol. Syst. Biol. 8, 607 (2012). Article Google Scholar * Singh, A. Stochastic analysis of genetic
feedback circuit controlling HIV cell-fate decision. IEEE Decis. Contr. 10.1109/CDC.2012.6425836, 4918–4923 (2012). * Reuse, S. et al. Synergistic activation of HIV-1 expression by
deacetylase inhibitors and prostratin: implications for treatment of latent infection. PLoS One. 4, e6093 (2009). Article ADS Google Scholar * Burnett, J. C. et al. Combinatorial latency
reactivation for HIV-1 subtypes and variants. J. Virol. 84, 5958–5974 (2010). Article CAS Google Scholar * Wong, V. C. et al. Quantitative evaluation and optimization of co-drugging to
improve anti-HIV latency therapy. Cell. Mol. Bioeng. 7, 320–333 (2014). Article CAS Google Scholar * Friedman, J. et al. Epigenetic silencing of HIV-1 by the histone H3 lysine 27
methyltransferase enhancer of Zeste 2. J. Virol. 85, 9078–9089 (2011). Article CAS Google Scholar * Schroder, A. R. et al. HIV-1 integration in the human genome favors active genes and
local hotspots. Cell. 110, 521–529 (2002). Article CAS Google Scholar * Jordan, A., Defechereux, P. & Verdin, E. The site of HIV-1 integration in the human genome determines basal
transcriptional activity and response to Tat transactivation. EMBO J. 20, 1726–1738 (2001). Article CAS Google Scholar * Pagans, S. et al. SIRT1 regulates HIV transcription via Tat
deacetylation. PLoS Biol. 3, e41 (2005). Article Google Scholar * Razooky, B. S. & Weinberger, L. S. Mapping the architecture of the HIV-1 Tat circuit: A decision-making circuit that
lacks bistability and exploits stochastic noise. Methods. 53, 68–77 (2011). Article CAS Google Scholar * Likhoshvai, V. A. et al. Mathematical model of the Tat-Rev regulation of HIV-1
replication in an activated cell predicts the existence of oscillatory dynamics in the synthesis of viral components. BMC Genomics. 15 Suppl 12, S1 (2014). * Gillespie, D. T. Exact
Stochastic Simulation of Coupled Chemical-Reactions. J. Phys. Chem. 81, 2340–2361 (1977). Article CAS Google Scholar * Scott, M., Tutorial: Genetic circuits and noise. (2006) Available
at: https://www.math.uwaterloo.ca/~mscott/NoiseTutorial.pdf. (Accessed: 18th October 2015). * Mehta, P., Mukhopadhyay, R. & Wingreen, N. S. Exponential sensitivity of noise-driven
switching in genetic networks. Phys. Biol. 5, 026005 (2008). Article ADS Google Scholar * Koh, R. S. & Dunlop, M. J. Modeling suggests that gene circuit architecture controls
phenotypic variability in a bacterial persistence network. BMC Syst. Biol. 6, 47 (2012). Article Google Scholar * Weber, M. & Buceta, J. Dynamics of the quorum sensing switch:
stochastic and non-stationary effects. BMC Syst. Biol. 7, 6 (2013). Article Google Scholar * Jordan, A., Bisgrove, D. & Verdin, E. HIV reproducibly establishes a latent infection after
acute infection of T cells _in vitro_. EMBO J. 22, 1868–1877 (2003). Article CAS Google Scholar Download references ACKNOWLEDGEMENTS A.K.C. gratefully acknowledges Prof. Abhyudai Singh,
R. Ramji, N. Dogra and N. Khan for insightful discussions and support during the preparation of this manuscript. A.K.C. is also thankful to J. Kubeck from Yale HPC for help in setting up
simulations. This work was supported by National Science Foundation grant CBET-1264246 (to K.M.J.) and NIH pre-doctoral training grants in genetics 2T32GM007499-36, 5T32GM007499-34 and
5T32GM007499-35 (to V.C.W.). AUTHOR INFORMATION AUTHORS AND AFFILIATIONS * Department of Biomedical Engineering, Yale University, 55 Prospect Street, 06511, New Haven, CT Arvind K. Chavali
& Kathryn Miller-Jensen * Department of Molecular, Cellular and Developmental Biology, Yale University, 55 Prospect Street, New Haven, 06511, CT Victor C. Wong & Kathryn
Miller-Jensen Authors * Arvind K. Chavali View author publications You can also search for this author inPubMed Google Scholar * Victor C. Wong View author publications You can also search
for this author inPubMed Google Scholar * Kathryn Miller-Jensen View author publications You can also search for this author inPubMed Google Scholar CONTRIBUTIONS A.K.C. performed the
computational analysis. V.C.W. performed the experiments. A.K.C., V.C.W. and K.M.J. wrote the manuscript. ETHICS DECLARATIONS COMPETING INTERESTS The authors declare no competing financial
interests. ELECTRONIC SUPPLEMENTARY MATERIAL SUPPLEMENTARY INFORMATION RIGHTS AND PERMISSIONS This work is licensed under a Creative Commons Attribution 4.0 International License. The images
or other third party material in this article are included in the article’s Creative Commons license, unless indicated otherwise in the credit line; if the material is not included under
the Creative Commons license, users will need to obtain permission from the license holder to reproduce the material. To view a copy of this license, visit
http://creativecommons.org/licenses/by/4.0/ Reprints and permissions ABOUT THIS ARTICLE CITE THIS ARTICLE Chavali, A., Wong, V. & Miller-Jensen, K. Distinct promoter activation
mechanisms modulate noise-driven HIV gene expression. _Sci Rep_ 5, 17661 (2015). https://doi.org/10.1038/srep17661 Download citation * Received: 28 August 2015 * Accepted: 30 October 2015 *
Published: 15 December 2015 * DOI: https://doi.org/10.1038/srep17661 SHARE THIS ARTICLE Anyone you share the following link with will be able to read this content: Get shareable link Sorry,
a shareable link is not currently available for this article. Copy to clipboard Provided by the Springer Nature SharedIt content-sharing initiative