- Select a language for the TTS:
- UK English Female
- UK English Male
- US English Female
- US English Male
- Australian Female
- Australian Male
- Language selected: (auto detect) - EN
Play all audios:
ABSTRACT The blood oxygenation level dependent (BOLD) functional magnetic resonance imaging (fMRI) signal is a widely-accepted marker of brain activity. The acquisition parameters (APs) of
fMRI aim at maximizing the signals related to neuronal activity while minimizing unrelated signal fluctuations. Currently, a diverse set of APs is used to acquire BOLD fMRI data. Here we
demonstrate that some fMRI responses are alarmingly inconsistent across APs, ranging from positive to negative, or disappearing entirely, under identical stimulus conditions. These
discrepancies, resulting from non-BOLD effects masquerading as BOLD signals, have remained largely unnoticed because studies rarely employ more than one set of APs. We identified and
characterized non-BOLD responses in several brain areas, including posterior cingulate cortex and precuneus, as well as AP-dependence of both the signal time courses and of seed-based
functional networks, noticing that AP manipulation can inform about the origin of the measured signals. SIMILAR CONTENT BEING VIEWED BY OTHERS APPARENT DIFFUSION COEFFICIENT FMRI SHINES
LIGHT ON WHITE MATTER RESTING-STATE CONNECTIVITY COMPARED TO BOLD Article Open access 16 March 2025 FREQUENCY-SPECIFIC BRAIN NETWORK ARCHITECTURE IN RESTING-STATE FMRI Article Open access 20
February 2023 HCP MULTI-PIPELINE: A DERIVED DATASET TO INVESTIGATE ANALYTICAL VARIABILITY IN FMRI Article Open access 04 June 2025 INTRODUCTION Since its discovery in the early 1990s,
functional magnetic resonance imaging (fMRI)1 with blood oxygenation level dependent (BOLD) contrast2,3,4,5 has become the mainstay of human brain imaging. BOLD fMRI reflects changes in
cerebral blood flow, volume and oxygenation. Flow increases contribute to positive BOLD signals, diluting paramagnetic, signal-reducing deoxyhæmoglobin6. Control of blood flow involves
modulations of vessel diameters, thus changing the relative sizes of intravascular (IV) and extravascular (EV) compartments. When the IV compartment expands, the EV compartment shrinks,
meaning that the local fMRI signal also depends on the volume of the EV tissue. Potentially, conformational changes other than vasodilation, such as swelling of activated brain cells7,8,9,
can influence the local volume fractions of tissue and cerebrospinal fluid (CSF) during neuronal activation10,11. The commonplaceness of fMRI has given the impression that this imaging
method can be used in an “automatic” mode, without worrying about the biophysical basis of fMRI signal changes. Some recent studies do not report even the basic acquisition parameters (APs),
such as echo time (_TE_), repetition time (_TR_), or flip angle (_FA_), as if these were well-established defaults with no appreciable influence on the data. However, even though an
informed choice of APs can maximize BOLD contrast, it remains unclear which APs are the most suitable for inferring the actual neuronal function from the signal and whether some APs may
generate sham activations or eliminate neuronal activation-related signals. Although the EV signal that varies under the direct influence of the IV compartment must be regarded as an
integral part of the functional contrast mechanism, the diversity of APs employed in fMRI warrant an inspection of BOLD fMRI signals to evaluate effects confounding their interpretation in
terms of the neuronal origins. Short _TE_ (e.g. ~15 ms at 3 T) yields little BOLD contrast compared with longer (≥30 ms) _TE_, meaning that data acquired at multiple _TE_s could
differentiate between BOLD and non-BOLD signals12,13. On the other hand, flip angle (_FA_) in general alters tissue contrast. In a recent single-_TE_ study14, _FA_ seemed irrelevant to the
_functional contrast_ of the fMRI signal (expressed as percent signal change, %Δ_S_). A low _FA_ has many beneficial effects (reviewed in Ref. 14), including reduced artifacts due to blood
inflow, subject movement and physiological noise (e.g. respiration and cardiac pulsation), reduced radiofrequency energy deposition and improved tissue contrast, with apparently no
detrimental effects on BOLD contrast. Thus, the traditional choice of _FA_ (at the Ernst angle) was challenged and vastly reduced _FA_s were suggested14. Notwithstanding, since
stimulus-related conformational changes remain potential confounds, we varied both _TE_ and _FA_ to assess the effects of tissue contrast weightings on fMRI signals elicited during visual
stimulation and to disambiguate BOLD from non-BOLD signal changes. RESULTS Thirteen healthy subjects were imaged at 3 T with four _FA_s (12.6°, 22.5°, 50.0° and 90.0°, subsequently labeled
as FA12, FA22, FA50 and FA90) and a standard _TE_ (30 ms) while they were viewing a reversing circular checkerboard. To identify BOLD changes, scans were repeated with a shorter _TE_ (16.8
ms) for the highest and lowest _FA_s (_TE_ values later referred to as TE16 and TE30). The _TR_ was 0.8 s except for two subjects whose data were acquired at _TR_ = 0.5 s and 1.0 s. The data
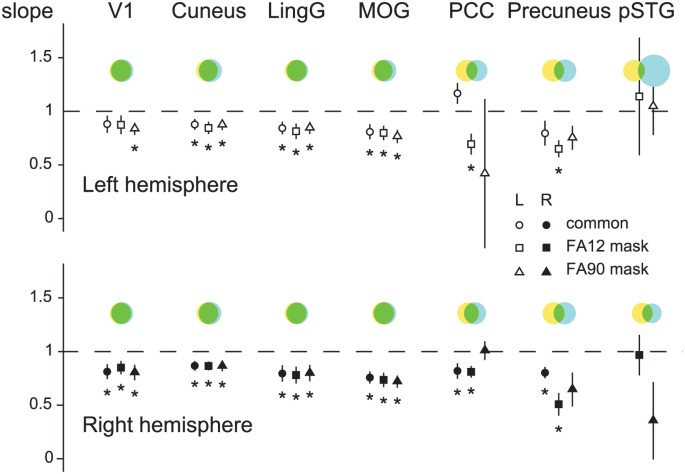
of five subjects had to be rejected for motion- and physiological-related confounds. Figure 1 presents the wide-spread aggregate effects of APs on fMRI responses. The yellow–blue Venn
diagrams, with green overlap areas, indicate that for the two different _FA_s presented, the sets of activated volume image elements (voxels) are largely disparate for three of the seven
anatomical atlas-based regions of interest (ROIs) in both the left and the right hemispheres [posterior cingulate cortex (PCC), precuneus and posterior superior temporal gyrus (pSTG)] but
similar in the four visual areas [primary visual cortex (V1), cuneus, lingual gyrys (LingG) and middle occipital gyrus (MOG); these atlas-derived areas have some overlap]. Fig. 1 further
shows the linear regression of the β-coefficients of the two _FA_s being evaluated in statistical comparison. We applied three different masks to restrict the analysis to the voxels that
responded at both or either _FA_ (see the legend of Fig. 1). The responses from voxels that were responding on both or either _FA_ were different in the majority of cases (slope ≠ 1)
indicating that, on the whole, the two _FA_s produced quantitatively different results. Figure 2 shows the differences of the β-coefficients for all subjects in several ROIs separately as
well as the totals across subjects. These voxel-by-voxel differences, where the β-values at FA90 were subtracted from those at FA12, show that the shapes of the distributions for the visual
areas (cuneus, middle occipital gyrus, lingual gyrus; V1 not shown separately) are regular and quite different from those for PCC and precuneus. For example, the PCC distribution is skewed
toward negative difference (in all subjects except for subject S2 scanned at _TR_ = 0.5 s). This result is also illustrated in the Supplementary Fig. S1, where many PCC voxels are in the
negative region and more negative at FA12 than at FA90. Of the responding voxels, less than 50% reacted at both FA12 and FA90 in PCC, whereas ~80% reacted at both _FA_s in cuneus, in part
due to the higher average response amplitude in cuneus. Interestingly, however, the proportion of “negative” and “positive” voxels responding only at one _FA_ differred according to _FA_s:
in PCC, the proportion of negatives per positives was 5:1 at FA12 and 1:1 at FA90. In cuneus, the proportions were 4:5 and 1:5, respectively. In both areas, these _FA_ dependencies were
statistically significant (_p_ < 0.0007, χ2 test; see Supplementary Tables S1–S2 for voxel counts and test results). Functional connectivity analysis performed using left V1 as a seed
also provided different results for different _FA_s, with the number of significantly responding voxels varying by a factor of two or more in several ROIs, with unlike trends for positive
and negative responses (see Supplementary Table S3). While the above analyses show crude differences between _FA_s at the group and ROI level, we next focus on data from individual subjects
and voxels. To start off, the stimulation-related activation maps in Fig. 3 derived from data acquired from one subject in a single fMRI run, with two _FA_s interleaved in 76-s long blocks
(see Fig. 7 in Methods), reveal striking differences in the precuneus and PCC. For example, the large negative cluster found at FA12 (white dashed oval) is absent at FA90—an effect that is
not explained by the temporal signal-to-noise ratio (tSNR), which was found to slightly favor FA90 (Fig. S2). The tSNR assesses data quality: an equal tSNR warrants the use of a single
statistical threshold, but, if anything, the slightly poorer tSNR at FA12 should yield fewer statistically significant voxels. This one-subject result is congruous with the group results and
once again underlines that fMRI results are strongly dependent on APs: not only is one set of APs more or less sensitive to detect changes, but different sets reveal different attributes.
Interestingly, the deviant voxels correspond closely to the areas of dissimilar tissue contrast at the _FA_ pairs we compared. Finally, we inspect the voxel-by-voxel signal properties.
Figure 4A shows, for one subject, how the _FA_/_TE_ settings affect tissue contrast. Quite saliently, for instance between FA12 and FA90, the appearance of CSF gradually changes from bright
to dark. In the enlarged slice of Fig. 4B (FA12/TE30), the corresponding %Δ_S_ traces for each voxel of the slice are plotted, color-coded by the frames of the slices at the top of the
Figure, in panel A. The four traces in Fig. 4B correspond to FA12 and FA90 at both TE16 and TE30; TE30 with FA22 and FA50 are included in insets E and F. In different voxels, the response
behavior ranged from “Classical BOLD” to “non-BOLD”, illustrated schematically in Figs. 4G–K (the traces in this row are not data but cartoons). Classical BOLD traces (G, _f_(_TE_)) remain
stable for all _FA_s at TE30 (blue, green, yellow and red) but are smaller for TE16 (dark violet and brown traces). Non-BOLD responses deviate from classical BOLD in terms of their _FA_/_TE_
sensitivities, being either _FA_- and _TE_-sensitive (H, _f_(_TE_, _FA_)) to the extent of disappearing at some _FA_ (I, _f_(_TE_, _FA_)), _FA_- and _TE_-insensitive (J), or displaying
inverted polarity (K, _f_(_FA_)), etc. To guide the eye, _FA_-sensitive responses are emphasized with cyan shading in B: the larger the %Δ_S_ discrepancy between _FA_ conditions, the larger
the shaded area. These response patterns are exemplified in two enlarged, numbered voxel grids enclosing an area in the visual cortex (inset E) and a region of variable tissue contrast
around the parieto-occipital sulcus (inset F). Additionally, some classical BOLD responses (type G) are indicated by the dashed boxes in B. Traces with similar %Δ_S_ across APs (type J) were
found in voxel 8 and _f_(_TE,FA_) traces with no abolished responses (type H) were found in voxels 6–7, 11–14 and 16–17. The non-BOLD responses in inset F include those of inverted
polarities (type K) in voxels 43–44 and abolished signals in voxels 28–29 and 46–47. Responses of types H and I are especially disturbing, as they would evade the _TE_-based detection of
non-BOLD responses. Since activation-dependent displacement of unequally-weighted tissues obtained at a given set of scan parameters could produce sham BOLD changes, we further examined the
differential effect of _TE_ and _FA_ on %Δ_S_, curious whether it could be related to changes in voxel composition and thus AP-dependent variation in image intensity (appearance of different
tissues is influenced by both _FA_ and _TE_; see Fig. 4A). Overall tissue contrast was poorest at FA50 and most enhanced at the lowest _FA_ (FA12); correspondingly, we found that voxels
located anterior and posterior to the sulcus (bright area in inset F) were highly responsive in the high-contrast setting (red, voxels 42–44) but the traces were flattened in the
low-contrast setting (green). Interestingly, the high-contrast traces were of inverted polarities on opposing sides of the sulcus (e.g. voxel 33 vs. 43, FA12), suggesting that, in these
locations, differentially bright tissue or CSF was displaced back and forth at the stimulus periodicity. These responses, similar to _FA_-dependent signals with opposite polarities at the
borders of ventricles (Fig. S3), deviate from classical BOLD predictions and would be mistaken for BOLD changes in standard fMRI. Fig. 5 shows, for the same slice as in Fig. 4, different
components of signal change reflecting distinct tissue properties. The area of non-BOLD responses in Fig. 4 is clearly influenced by both _M_0 and T1 effects instead of showing purely
T2*-driven responses. Fig. 5 also provides a semi-quantitative T1-map (bottom-right) as a way to locate CSF-containing voxels. Additionally, to illustrate the potential signal changes due to
dynamic differences in tissue composition, Fig. 5 (bottom-right) provides the %Δ_S_ expected for a hypothetical shift of tissue boundary by 50 μm from gray matter into voxels containing
either CSF or white matter. DISCUSSION While a large share of fMRI studies is conducted with “conventional” APs (including _TR_: 2–3 s, _TE_: 25–40 ms, _FA_: Ernst angle of gray matter, full
or nearly full brain coverage and about 3 × 3 × 3 mm3 voxel size at 3 T), some of the most rigorous work connecting fMRI signal and electrophysiology employ markedly different APs, e.g.
with one or a few imaging slices, a _TR_ of 0.1–1 s, a much higher spatial resolution and an _FA_ chosen appropriately for the purpose, e.g. < Ernst angle to reduce flow effects. Thus,
the fMRI signals of these two types of experiments derive from unequal biophysics, with potential ramifications for the interpretation of conventional fMRI. If fMRI signal changes reflected
similar physiological and biophysical phenomena at different _FA_s, the proportions of negatively vs. positively responding voxels should stay approximately equal across the _FA_s. In our
data, this seems not to be the case as _FA_-dependent effects prevail. The responses appeared largely BOLD in the visual cortices, with non-BOLD features emerging in the other ROIs. Effects
of _M_0 and T2* components remained largely unaffected as _FA_ changed (_TE_ theoretically only modulating the T2* component). However, at higher _FA_s, the T1 component influenced the total
%Δ_S_. The largest observed deviations from BOLD responses coincided with the CSF-containing voxels (see T1-map in Fig. 5); another consideration is that for non-BOLD signals to arise,
responses due to parameters other than T2* must be of at least comparable amplitudes. Detailed examination of single voxels indicated that all of the parameters had accumulative effects in
some brain areas, whereas in other areas the total responses resulted from almost equally strong but counteracting contributions, especially at FA90. PCC and precuneus are nodes of the
“default-mode” resting-state network, which is deactivated during goal-directed behavior as has been shown by positron emission tomography15, electrophysiology16,17 and fMRI (negative BOLD
signals)18. In our data, PCC and precuneus showed prominent non-BOLD effects (activations of inverted polarity in Fig. 4F are from those areas), meaning that the default-mode signal decrease
in fMRI might include non-BOLD effects. Thus, the task-related dampening of fMRI signals in PCC might be a less specific marker for neuronal suppression than is often implied. Besides,
these cortical areas have previously been observed to be prone to physiological noise derived from CSF fluctuations19; on the other hand, large draining veins running through CSF-containing
voxels have been shown to bring about signals that anti-correlate with visual-cortex activations at zero or very short latency, insensitive to _TE_ and not related to physiological noise20.
In our data, many partially CSF-filled voxels contained physiological-like noise, but with non-zero mean. Physiological noise, comprising BOLD-like and non-BOLD-like components, is known to
reduce the gain of SNR due to increased _FA_, with BOLD-like noise at maximum near the T2*21. The origin of the BOLD noise is not fully understood, but it is generally associated with
hemodynamic and metabolic fluctuations in gray matter22. Here the noise did not differ between stimulation and control conditions in responding voxels (see SI and Supplementary Fig. S4) and
was thus not driving the sustained signal changes. Aside from physiological noise, inflow-related signals depend on APs. The inflow signals and their relation to APs are modulated
differently depending whether the inflowing blood enters the imaging partition from another imaging partition or from outside the imaging volume: On one hand, if blood is displaced by an
equal amount of blood that has been targeted by full-amplitude RF excitations within the latest _TR_, the MRI signal decreases. On the other hand, if the newly entering blood comes from
outside the imaging volume and has not been subjected to RF pulses, signal increases (omitting any previous spin history effects). Our data are prone to both kinds of inflow effects;
however, since our imaging volume was thin, the effect from the slow flow from neighboring partitions was assumed to be small and was not considered further. To set a reference with respect
to inflow effects, FA12 gives the least corrupted measurements because, with small _FA_, the magnetization of spins in the imaging volume is more similar to that of the blood inflowing from
outside the imaging volume, while for FA90, inflow effects increase Δ_S_ for the opposite reason—the difference in magnetization between inflowing and present spins is larger. Thus, the
additional signal increase for FA90 with respect to the lower _FA_s seen in a number of positively-responding voxels in our data can in principle be due to increased inflow. However, the
Δ_S_ should be amplified by the inflow effect for negative signal changes too, which was generally not the case and inflow effects cannot explain the Δ_S_ in voxels where the low _FA_s
result in the greatest Δ_S_. Additionally, bulk head movement could induce, conceivably with a stimulus-related temporal pattern, tissue-contrast-based signal changes. While our data remain
partly ambivalent to the nature of this effect, head movement parameters captured by motion correction do not support the bulk movement hypothesis and the measured voxel timecourses are not
consistent with stimulus-locked head motion, e.g. high-contrast borders did not systematically fluctuate in a time-locked fashion, as they should if they were motion-induced. Practically,
scan parameters that result in as poor tissue contrast as possible will minimize functional contrast arising from conformational, partial volume-related non-BOLD changes. However, fMRI
images with anatomical detail are more convenient for analysis. Unfortunately, without obtaining data at different _FA_s, activation maps are prone to misinterpretation. Task-related
non-BOLD signals may themselves provide some information about neuronal activation, despite their putative non-specificity. In future, non-BOLD effects may be further discriminated by, for
example, the use of flow-combating bipolar gradients in the direction of the assumed flow and especially by acquiring data at a higher spatial resolution. The prominence of non-BOLD signals
in our results suggests that their identification, e.g. by modeling different signal components as done here, would crucially improve the extent to which (_i_) positive or negative fMRI
responses are related to neuronal activity and to electrophysiological data, (_ii_) various fMRI studies with different scan parameters are commensurate, (_iii_) functional networks are
reliably detected and (_iv_) fMRI signal changes portray BOLD responses. However, our results are likely less central for traditional group-level analyses of activation locale (brain
mapping) because the discrepancies tend to average out due to anatomical variability and even localized non-BOLD changes still represent functional signal. Also, the main positive BOLD
response is bound to survive due to its strength with respect to e.g. T1-related effects and only some AP-dependent inconsistency will remain. Still, averaging out the details of the signal
prevents gaining a more accurate picture of the complex spatio-temporal patterns of brain function, e.g. whole-brain stimulus-locked activations at individual level23. These types of
analyses are essential for furthering the utility of fMRI in brain research. The central implications of our results are that the BOLD vs. non-BOLD contributions to fMRI signals can be
disambiguated by applying multiple APs in a single experiment and that without disambiguation, the BOLD assumption underlying interpretation of fMRI results—whether portraying brain
dynamics, individual activation locale, or connectivity—is at stake. METHODS SUBJECTS Thirteen healthy young adults (5 females, 8 males) reporting no history of neurological disorders
participated in the fMRI experiments. The study was approved by the Ethics Committee of Helsinki and Uusimaa Hospital District and undertaken after the written informed consent of the
subjects. Five subjects were excluded from analysis: head motion was considered too large (≥1.3 mm) in three subjects and the time series of two subjects were contaminated by large
fluctuations throughout the brain that could not be explained by cardiac and respiratory cycles. The strict inclusion criteria were maintained as our purpose was to examine the method rather
than to generalize brain reactivity beyond the cohort. The remaining eight subjects (4 females, 4 males) were all right-handed and within 20–35 years of age (mean 25). STIMULI During the
control condition, the subjects fixated on a small cross centered on a gray (63 cd m−2) circle of 30° diameter. During the stimulation condition, the subjects continued to fixate on the
cross but the gray background was replaced by a circular black- (0.6 cd m−2) and-white (126 cd m−2) “checkerboard” (Fig. 6) reversing at 8 Hz. The stimuli were delivered with Presentation
software (Neurobehavioral Systems Inc., Albany, CA, USA), projected on a semitransparent back-projection screen with a data projector (Christie X3, Christie Digital Systems Ltd.,
Mönchengladbach, Germany) and viewed via a mirror placed outside the measurement coil. Fig. 7 illustrates the stimulus timing: each stimulation period lasted 20 s, alternating with 56-s
control periods; the runs started and ended in 28-s control periods. To ease the tedium of the experiment, subjects were instructed to silently cycle through the alphabet at their own
leisurely pace, thinking of words beginning with each letter. DATA ACQUISITION FMRI was performed using a 3-T whole-body MRI scanner (Signa VH/i 3.0 T HDxt, GE Healthcare Ltd., Chalfont St
Giles, UK) with a 16-channel head coil (MR Instruments Inc., MN) and gradient-echo echo-planar acquisitions (field-of-view = 19.2 cm2, matrix = 64 × 64). Fourteen (ten for Subject 1, nine
for Subject 2) oblique axial slices were defined in-plane with the _sinus rectus_, crossing the subjects' calcarine sulcus and posterior cingulate cortex (slice thickness = 3 mm,
spacing = 0 mm). The data were acquired with ASSET (SENSE parallel imaging technique) R-factor at 2 and second-order shimming was used. Two experimental runs were acquired (_TE_ = 30 ms)
using alternating, but _fixed_, _FA_ pairs (90.0° and 12.6°, or 50.0° and 22.5°). The order of and within the fixed pairs was randomized across the 13 subjects. Additionally, a third set of
dual-_FA_ (90.0° and 12.6°) fMRI data were acquired at _TE_ = 16.8 ms starting with Subject 3. The _FA_ was switched exactly in the middle of the control condition following each stimulus
block (see Fig. 7). Four trials (consisting of a pre-stimulus control period, the stimulus block and a post-stimulus control period) were acquired for each _FA_ in the pair for a total of
eight trials per run. Each experimental run for Subject 3 onwards contained 760 time points acquired at a repetition time _TR_ = 800 ms; for Subject 1, _TR_ = 1000 ms (608 time points) and
for Subject 2, _TR_ = 500 ms (1216 time points). T1-weighted images were acquired for anatomical reference with a 3D SPGR sequence at a spatial resolution of 1.0 × 1.0 × 1.0 mm3. DATA
ANALYSIS The data for the six _FA_/_TE_ conditions (90/30, 50/30, 22/30, 12/30, 90/16 and 12/16°/ms, decimals omitted) were extracted from the three functional runs with alternating _FA_s
between trials (see Fig. 7 for a schematic of the imaging parameter sequencing, data sorting and stimulation timing). In the beginning of the image acquisition and after each _FA_ change, a
portion of data was discarded to allow the longitudinal magnetization to stabilize and the actual data used began with an abbreviated control block, followed by 20 s of stimulation and 28 s
of the control stimulus. Thus, each of the dual-_FA_ 608-s runs were split and sorted into two concatenated single-_FA_ pseudo runs. Between-AP variation was controlled by within-run _FA_
switching and the limited number of trials per condition was balanced by having two adjacent parameter combinations for each TE30 condition on the _FA_/_TE_ plane, enabling examination of
gradual changes in observables. STATISTICAL REGION-OF-INTEREST PREPROCESSING (FIGURES 1,2,3, S1–S2 AND TABLES S1–S3) The data were analyzed using the Analysis of Functional Neuroimages
(AFNI)24 software and Matlab scripts. Concatenated runs were 320 points long (256 points for Subject 1 and 512 points for Subject 2). The concatenated runs were corrected for head motion,
spatially registered to the first volume of the FA90 functional run and de-obliqued. A brain mask was applied to exclude any non-brain signals. Each trial within the concatenated runs was
then individually intensity-normalized by dividing the time series in each trial by its mean. The time series in each processed, concatenated run was inspected and, where necessary, short
segments containing head motion spikes too large to be corrected by the 3D-registration were excluded from further analysis. Anatomical and EPI datasets were aligned; for one subject, the
AFNI program _align_epi_anat.py_ was used to improve the alignment. The anatomical datasets were then transformed into Talairach space. This transformation was subsequently applied to all
processed EPI datasets and their activation maps. ANALYSIS OF BETA COEFFICIENTS (FIGURES 1 AND 2) A quantitative measure of the relationship between activation amplitude expressed as general
linear model coefficients for the (below) stimulus response function (β) and _FA_ was determined by statistical analysis across individual subject datasets. Anatomically-defined region of
interest (ROI) masks based on the Talairach atlas installed in AFNI (_whereami_ program) were used to extract all voxels in seven ROIs in the left and right hemispheres. We plotted the
voxel-wise beta coefficients for FA90 vs. FA12 and calculated the linear regressions (βFA90 = _m_ βFA12 + _c_, where _m_ = slope, _c_ = intercept) of each of the resulting scatter plots
using the _polyfit_ function in Matlab for each region; only significantly active voxels were used, as described in the figure captions. Slope values for each fit in each ROI were collected
for all subjects and two-tailed _t_-tests were computed to determine whether the mean slopes of the subject group in each ROI differed statistically significantly from 1. Under ideal BOLD
conditions, _m_ = 1; that is, _FA_ has no effect on the beta coefficients. TASK-RELATED ACTIVATION ANALYSIS (FIGURE 3) Individual subjects' activation maps for FA12 and FA90 (TE30, _TR_
= 800 ms) conditions were computed using the _3dDeconvolve_ AFNI program. Head motion parameters and a reference waveform computed by convolving the stimulus time course with an impulse
response function in the AFNI _waver_ program (default parameters: delay time 2 s, rise time 4 s, fall time 6 s, post-stimulus undershoot 0.2 times the peak amplitude) were used as
regressors. The _3dREML_ AFNI program was then used to account for temporal autocorrelations. Statistically-significant maps were thresholded to _p_ < 0.05 (false discovery rate
(FDR)-corrected). TIME COURSE ANALYSIS (FIGURES 4 AND S3) The data presented are from a subject that was scanned at _TR_ = 800 ms; the rest of the subjects were analyzed in the same way and
the results shown are representative. The concatenated runs were corrected for motion, realigned to the first data point of the FA12/TE30 scan, first-order intensity trends were removed,
%Δ_S_ values from four trials were averaged and time courses temporally filtered. See the Supplementary Information for details about data processing and presentation. The resulting time
courses of the six _FA_/_TE_ combinations were plotted for every brain voxel in an image plane (plane 11 of 14 in Fig. 4, chosen to be far from the edge of the image stack, _sinus rectus_
and ventricles to avoid artifacts), overlaid on the gray value of the FA12/TE30 scan for anatomical reference. TISSUE PARAMETER MODELING (FIGURE 5) Tissue parameters _M_0, T1 and T2* were
modeled from the TE30 data using Matlab least-squares optimization for the signal equation for spoiled gradient-echo acquisition25: where _M_0, T1 and T2* are the longitudinal equilibrium
magnetization (in arbitrary units), longitudinal relaxation time and effective transverse relaxation time. T2* was first fitted for , _A_ being a constant, using the FA90 data. The
parameters were extracted from the average signals across 8 s preceding the start (control) and end (stimulation) of each stimulation period, i.e. altogether 2 × 40 data points per AP
condition. The parameters thus acquired were then used (without changing other conditions) to produce the %Δ_S_ contribution of each parameter for each _FA_. Further, the putative location
of CSF was mapped using voxel-vise T1 as a guide, assuming that a T1 of 1.5–2.0 s likely indicates the presence of some CSF in the voxel and a T1 > 2.0 s reflects a substantial partial
volume of CSF. REFERENCES * Belliveau, J. W. et al. Functional mapping of the human visual cortex by magnetic resonance imaging. Science 254, 716–719 (1991). Article ADS CAS Google
Scholar * Ogawa, S., Lee, T. M., Kay, A. R. & Tank, D. W. Brain magnetic resonance imaging with contrast dependent on blood oxygenation. Proc. Natl. Acad. Sci. USA 87, 9868–9872 (1990).
Article ADS CAS Google Scholar * Bandettini, P. A., Wong, E. C., Hinks, R. S., Tikofsky, R. S. & Hyde, J. S. Time course EPI of human brain function during task activation. Magn.
Reson. Med. 25, 390–397 (1992). Article CAS Google Scholar * Kwong, K. K. et al. Dynamic magnetic resonance imaging of human brain activity during primary sensory stimulation. Proc. Natl.
Acad. Sci. USA 89, 5675–5679 (1992). Article ADS CAS Google Scholar * Ogawa, S. et al. Intrinsic signal changes accompanying sensory stimulation: functional brain mapping with magnetic
resonance imaging. Proc. Natl. Acad. Sci. USA 89, 5951–5955 (1992). Article ADS CAS Google Scholar * Buxton, R. B., Uludağ, K., Dubowitz, D. J. & Liu, T. T. Modeling the hemodynamic
response to brain activation. Neuroimage 23, S220–S233 (2004). Article Google Scholar * Le Bihan, D., Urayama, S., Aso, T., Hanakawa, T. & Fukuyama, H. Direct and fast detection of
neuronal activation in the human brain with diffusion MRI. Proc. Natl. Acad. Sci. USA 103, 8263–8268 (2006). Article ADS CAS Google Scholar * Zhou, N., Gordon, G. R. J., Feighan, D.
& MacVicar, B. A. Transient swelling, acidification and mitochondrial depolarization occurs in neurons but not astrocytes during spreading depression. Cereb. Cortex 20, 2614–2624 (2010).
Article Google Scholar * Stroman, P. W., Lee, A. S., Pitchers, K. K. & Andrew, R. D. Magnetic resonance imaging of neuronal and glial swelling as an indicator of function in cerebral
tissue slices. Magn. Reson. Med. 59, 700–706 (2008). Article CAS Google Scholar * Jin, T. & Kim, S.-G. Change of the cerebrospinal fluid volume during brain activation investigated by
T1ρ-weighted fMRI. Neuroimage 51, 1378–1383 (2010). Article PubMed Central Google Scholar * Piechnik, S. K., Evans, J., Bary, L. H., Wise, R. G. & Jezzard, P. Functional changes in
CSF volume estimated using measurement of water T2 relaxation. Magn. Reson. Med. 61, 579–586 (2009). Article CAS Google Scholar * Wu, G. & Li, S. J. Theoretical noise model for
oxygenation-sensitive magnetic resonance imaging. Magn. Reson. Med. 53, 1046–1054 (2005). Article Google Scholar * Kundu, P., Inati, S. J., Evans, J. W., Luh, W. M. & Bandettini, P. A.
Differentiating BOLD and non-BOLD signals in fMRI time series using multi-echo EPI. Neuroimage 60, 1759–1770 (2012). Article Google Scholar * Gonzalez-Castillo, J., Roopchansingh, V.,
Bandettini, P. A. & Bodurka, J. Physiological noise effects on the flip angle selection in BOLD fMRI. Neuroimage 54, 2764–2778 (2011). Article CAS Google Scholar * Raichle, M. E. et
al. A default mode of brain function. Proc. Natl. Acad. Sci. USA 98, 676–682 (2001). Article ADS CAS Google Scholar * Hayden, B. Y., Smith, D. V. & Platt, M. L. Electrophysiological
correlates of default-mode processing in macaque posterior cingulate cortex. Proc. Natl. Acad. Sci. USA 106, 5948–5953 (2009). Article ADS CAS Google Scholar * Jerbi, K. et al. Exploring
the electrophysiological correlates of the default-mode network with intracerebral EEG. Front. Syst. Neurosci. 4, 27 (2010). PubMed PubMed Central Google Scholar * McKiernan, K. A.,
Kaufman, J. N., Kucera-Thompson, J. & Binder, J. R. A parametric manipulation of factors affecting task-induced deactivation in functional neuroimaging. J. Cogn. Neurosci. 15, 394–408
(2003). Article Google Scholar * Birn, R. M., Diamond, J. B., Smith, M. A. & Bandettini, P. A. Separating respiratory-variation-related fluctuations from neuronal-activity-related
fluctuations in fMRI. Neuroimage 31, 1536–1548 (2006). Article Google Scholar * Bianciardi, M., Fukunaga, M., van Gelderen, P., de Zwart, J. A. & Duyn, J. H. Negative BOLD-fMRI signals
in large cerebral veins. J. Cereb. Blood Flow Metab. 31, 401–412 (2011). Article Google Scholar * Triantafyllou, C. et al. Comparison of physiological noise at 1.5 T, 3 T and 7 T and
optimization of fMRI acquisition parameteres. Neuroimage 26, 243–250 (2005). Article CAS Google Scholar * Krüger, G. & Glover, G. H. Physiological noise in oxygenation-sensitive
magnetic resonance imaging. Magn Reson Med 46, 631–637 (2001). Article Google Scholar * Gonzalez-Castillo, J. et al. Whole-brain, time-locked activation with simple tasks revealed using
massive averaging and model-free analysis. Proc. Natl. Acad. Sci. USA 109, 5487–5492 (2012). Article ADS CAS Google Scholar * Cox, R. W. AFNI: software for analysis and visualization of
functional magnetic resonance neuroimages. Comput. Biomed. Res. 29, 162–173 (1996). Article ADS CAS Google Scholar * Bernstein, M. A. Handbook of MRI Pulse Sequences 579–606 (Elsevier
Academic Press, Burlington, MA, 2005). Chapter Google Scholar Download references ACKNOWLEDGEMENTS This work was supported by the Academy of Finland grants #218072, #263800, #265917,
European Research Council Advanced Grant #232946 (R.H.), Finnish Cultural Foundation (C.N.), Instrumentarium Science Foundation (V.R.) and Swedish Cultural Foundation in Finland (V.R).
AUTHOR INFORMATION AUTHORS AND AFFILIATIONS * Brain Research Unit, O.V. Lounasmaa Laboratory and AMI Centre, Aalto NeuroImaging, Aalto University, AALTO, FI-00076, Espoo, Finland Ville
Renvall, Cathy Nangini & Riitta Hari Authors * Ville Renvall View author publications You can also search for this author inPubMed Google Scholar * Cathy Nangini View author publications
You can also search for this author inPubMed Google Scholar * Riitta Hari View author publications You can also search for this author inPubMed Google Scholar CONTRIBUTIONS V.R. and C.N.
designed research; V.R. and C.N. performed research; V.R. and C.N. analyzed the data, V.R., C.N. and R.H. discussed and interpreted the data; and V.R., C.N. and R.H. prepared the paper.
ETHICS DECLARATIONS COMPETING INTERESTS The authors declare no competing financial interests. ELECTRONIC SUPPLEMENTARY MATERIAL SUPPLEMENTARY INFORMATION Supplementary Information RIGHTS AND
PERMISSIONS This work is licensed under a Creative Commons Attribution-NonCommercial-NoDerivs 3.0 Unported License. To view a copy of this license, visit
http://creativecommons.org/licenses/by-nc-nd/3.0/ Reprints and permissions ABOUT THIS ARTICLE CITE THIS ARTICLE Renvall, V., Nangini, C. & Hari, R. All that glitters is not BOLD:
inconsistencies in functional MRI. _Sci Rep_ 4, 3920 (2014). https://doi.org/10.1038/srep03920 Download citation * Received: 17 May 2013 * Accepted: 13 January 2014 * Published: 29 January
2014 * DOI: https://doi.org/10.1038/srep03920 SHARE THIS ARTICLE Anyone you share the following link with will be able to read this content: Get shareable link Sorry, a shareable link is not
currently available for this article. Copy to clipboard Provided by the Springer Nature SharedIt content-sharing initiative