- Select a language for the TTS:
- UK English Female
- UK English Male
- US English Female
- US English Male
- Australian Female
- Australian Male
- Language selected: (auto detect) - EN
Play all audios:
ABSTRACT Many biological processes, including differentiation, reprogramming and disease transformations, involve transitions of cells through distinct states. Direct, unbiased investigation
of cell states and their transitions is challenging due to several factors, including limitations of single-cell assays. Here we present a stochastic model of cellular transitions that
allows underlying single-cell information, including cell-state-specific parameters and rates governing transitions between states, to be estimated from genome-wide, population-averaged
time-course data. The key novelty of our approach lies in specifying latent stochastic models at the single-cell level and then aggregating these models to give a likelihood that links
parameters at the single-cell level to observables at the population level. We apply our approach in the context of reprogramming to pluripotency. This yields new insights, including
profiles of two intermediate cell states, that are supported by independent single-cell studies. Our model provides a general conceptual framework for the study of cell transitions,
including epigenetic transformations. SIMILAR CONTENT BEING VIEWED BY OTHERS DISSECTING TRANSITION CELLS FROM SINGLE-CELL TRANSCRIPTOME DATA THROUGH MULTISCALE STOCHASTIC DYNAMICS Article
Open access 23 September 2021 CONTROL OF CELL STATE TRANSITIONS Article 14 September 2022 GENERATIVE MODELING OF SINGLE-CELL TIME SERIES WITH PRESCIENT ENABLES PREDICTION OF CELL
TRAJECTORIES WITH INTERVENTIONS Article Open access 28 May 2021 INTRODUCTION A number of biologically important processes involve transitions through distinct cell states.
Differentiation1,2,3,4,5,6,7,8,9, reprogramming10,11 and disease initiation and progression12,13,14 are among the many examples of this kind. State changes in such processes are in general
stochastic, as reflected in experimentally observed variation in transition latency even in the setting where transitions arise in homogenous cell cultures subjected to defined driving
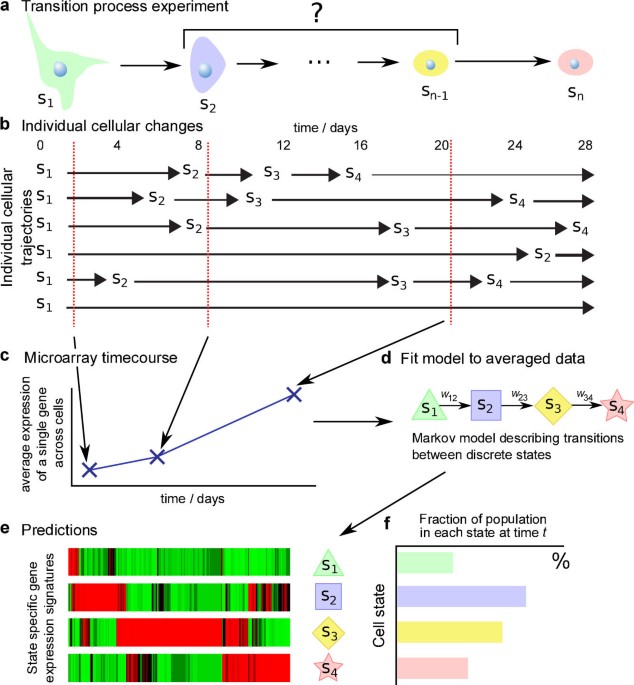
events (e.g. Hanna et al.17). Stochasticity of transitions at the single-cell level (Fig. 1a) imply that during such a process a cell population is a mixture of cells in different states,
with the state composition of the cell population itself time-varying (Fig. 1b). Studying single-cell events in heterogenous, time-varying populations is challenging and the global changes
in single-cell transcriptional, metabolic and epigenetic state that are involved in these processes remain incompletely understood. High-throughput assays based on homogenates provide only
population-averaged data; in transition processes such data represent averages over heterogenous states (Fig. 1c). Genome-wide single-cell protocols are now emerging2,4, but their
efficiency, availability and depth remain limited. Furthermore, these are not live cell assays, so cannot be used to directly track genome-wide molecular profiles of single cells undergoing
state transitions. Here we present a general stochastic model of transition processes that links parameters at the single cell level to time-course data at the cell population level, as
obtained for example in conventional expression, proteomic or epigenetic assays based on homogenates. The key novelty of our approach is to specify latent stochastic models at the
single-cell level and then (mathematically) aggregate the models to give a likelihood at the level of homogenate data. As we show below, this allows parameters specific to single-cell states
and transitions between them to be estimated from homogenate, time-course data. To facilitate analysis of data collected at non-uniform time points we use continuous-time Markov processes
as the single-cell models. Estimation of model parameters from population-averaged time-course data then gives information on several aspects of the single-cell states and transitions,
including: * Single-cell state profiles (e.g. state-specific expression, protein or epigenetic profiles); * State markers (e.g. genes, proteins or marks that are highly specific to
individual states); and, * Dynamical information concerning transition rates, cell residence times and population composition through time. To fix ideas and illustrate our approach, we
develop and apply our model in the context of reprogramming of mouse embryonic fibroblasts (MEFs) to a state of pluripotency10,15,16. This is a process that has been widely studied in recent
years and where a number of advanced experimental approaches have been brought to bear. Recent studies have shown that reprogramming has a substantial stochastic component. Subclones
derived from the same transduced somatic cells activate pluripotency markers, such as Nanog-GFP, at very different times, over a range of a few weeks10,15,16. Further, there is evidence that
the entire cell population has the potential to give rise to pluripotent cells during direct reprogramming, i.e., there is not an “elite” group of cells that are uniquely able to do so17.
Thus, current evidence suggests reprogramming is an inherently stochastic process17 in which individual cells change from an initial differentiated state to an induced pluripotent stem cell
(iPSC) state. Single-cell studies using pre-selected sets of genes have begun to elucidate cellular events in reprogramming19,20,21,22. However, at the genome-wide level many questions
remain open and our understanding of the state transitions, including the number of traversed states, their marker genes and transition rates, remains limited. In our model, we suppose that
a cell can stochastically visit a set of _n_ states during the transition process (Fig. 1d). Transitions between these states are described by a latent continuous-time Markov process whose
discrete state space is identified with cell states (see Methods and SI for details). The model parameters are (i) the transition rates _w__i_,_i_′ between states _i_ and _i_′ and (ii)
state-specific parameters β_ij_ that represent the mean expression level for gene _j_ in state _i_ (we focus on transcriptomic data here, but the analysis could be readily applied to e.g.
proteomic or epigenomic data). We refer to the β's as state-specific signatures (Fig. 1e). The population dynamics are characterized solely by the transition rates: given the rates
_w__i_,_i_′, the Markov model yields the probability _p__i_(_t_) of being in state _i_ at time _t_. For a large number of cells, the population-averaged expression _x__j_(_t_) of gene _j_ at
time _t_ is then a combination of state-specific expression levels weighted by the probability of being in each state (Fig. 1f): Both _w__i_,_i_′ and β_ij_ can be estimated from time-course
data. Complicated transition networks may require ancillary data to ensure identifiability. Here, for simplicity, here we limit ourselves to consider only linear forward-transition models
(i.e., no reverse arrows in Fig. 1d); this constraint allows direct application to conventional, time-course data. In the reprogramming context, we note that recent data17 support the idea
that almost all donor cells eventually give rise to iPS cells. These results were determined from single cell assays that observed the appearance of one marker for the final state,
expression of the Nanog pluripotency gene and indicated an irreversible switch to pluripotency during reprogramming11. For the reprogramming application we present, as discussed in detail
below, we further assume that all cells in the starting population are in an initial (differentiated) state. We put forward a computationally efficient approach for estimation, as
implemented in software called STAMM (State Transitions using Aggregated Markov Models; see Methods and SI for details). As we illustrate below, STAMM can be readily applied to full-genome
studies. Furthermore, since STAMM is rooted in a probabilistic model, model selection methods allow exploration of the likely number of single-cell states in a transition process of
interest. Hidden Markov models (HMMs) are widely used to describe latent processes in biological applications and have previously been used to describe cell populations26 and model the cell
cycle27,28. It is interesting to contrast our model with a classical HMM. The key differences are twofold. First, our model involves aggregation of single-cell level Markov chains, thus it
deals with states that are not only hidden, but whose connection to population-level observables necessarily involves averaging over multiple instances of the latent process. In contrast, a
HMM applied to time-course data from a transition process does not provide a model at the single-cell level. Second, our model operates in continuous time and applies naturally to
non-uniformly sampled data. In contrast, in a HMM the underlying Markov process operates in discrete time, such that the probability of a state transition is the same between successive time
points regardless of the intervening time period. This assumption generally will not hold at all under uneven time sampling of a heterogenous population. Due to these reasons, in our view
HMMs are intrinsically ill-suited to the study of transition processes of the type we consider here. An alternative approach to using HMMs is to attempt direct deconvolution based on a model
of single-cell expression profiles, e.g.29,30,31. These approaches have greater deconvolution power but are hindered by the upfront requirement for an expression model. For example,
Siegal-Gaskins et al.29 established a model for the progression of _Caulobacter_ cells through their own cell cycle. Similarly, Rowicka et al.31 measured the distribution of cell cycle
time-shifts based on well-known cell cycle regulated genes. While these methods can in principle be adapted for other organisms and systems, the STAMM method presented here is immediately
and directly applicable to time-course data from general transition processes. In particular, it is not necessary to find genes following regular expression profiles, nor is it necessary to
have an _a priori_ knowledge of the phases of the process of interest, which in many applications, including reprogramming as considered here, remain incompletely understood. Differential
expression analysis is widely used to highlight potentially important players in high-throughput studies. Approaches have also been proposed for time course data that rank genes (or
proteins) according to whether they show evidence of change over time or relative to a control time course23,24,32 or that cluster together genes that show similar temporal profiles25.
However, these approaches do not attempt to model single-cell state transitions nor account for cellular heterogeneity. RESULTS Our main results were obtained by application of STAMM to
genome-wide gene expression time-course data due to Samavarchi-Tehrani _et al._18 (hereafter referred to as “the Samavarchi-Tehrani data”). These data were obtained during reprogramming of a
“secondary” mouse embryonic fibroblast (MEF) system that expresses _Oct4_, _Sox2_, _Klf4_ and _cMyc_ for 30 days. The starting MEF culture was isolated from chimeric mice and maintained for
less than 5 passages; under these conditions the simplifying assumption of an initially homogeneous cell population is arguably a reasonable one, since substantial long-term changes are
unlikely. Below we describe the results we obtained from analysis of these data, including detailed profiles of intermediate states and insights regarding transition rates and population
dynamics. Furthermore, we compare these results with recent single-cell data19,20,21,22 from related secondary MEF reprogramming systems. NUMBER OF INTERMEDIATE SINGLE-CELL STATES We
explored the number of model states using several criteria (Fig. 2). Model fit (as captured by the squared difference between output of the fitted model and observed expression, i.e. the
residual sum-of-squares) improves with number _n_ of states; this is unsurprising as the number of model parameters increases with _n_. However, models with too many states may overfit.
Overfitting can occur by introduction of artifactual states that are not transcriptionally or biologically distinct (e.g., splitting of a state into two; Supplementary Fig. S3b). Alongside
fit-to-data, we therefore also monitored the extent to which state signatures were mutually distinct (Fig. 2b) quantified using a standard linear algebraic quantity called the condition
number (see SI). We find that already with just five states the condition number is sharply increased and signatures are no longer distinct (Fig. 2b), suggesting that the improved fit is
simply due to artifactual splitting of states. In addition, we carried out a Bayesian model selection, computing a probability score over number of states that takes account of both
fit-to-data and model complexity in a principled way (see Methods and SI for details and discussion). This analysis supports the existence of intermediate states, with highest posterior
probability associated with a four-state model (Fig. 2c). Thus, a four-state model appears to strike a good balance between parsimony and fit-to-data. The model shows clearly distinct state
signatures (Fig. 2b and Fig. 3e and f) yet, despite having only three dynamical parameters, fits diverse time-courses well (see, e.g., Fig. 3d where some of the genes considered by
Samavarchi-Tehrani _et al._18 are shown). Taken together, these results suggest that a total of four single-cell states with distinct expression profiles, including two, new intermediate
states, are visited during reprogramming of secondary MEFs to pluripotency. Below we explore the four-state model in detail. CELL STATE-SPECIFIC TRANSCRIPTIONAL PROFILES We identify a total
of four cell states as visited in the transition from MEF to iPSC. Genome-wide transcriptional profiles for these four states are shown in Figure 3e (full list in Supplementary Table S2;
genes were filtered as described in Methods and SI and a total of 4383 genes were fit; parameter estimation and checks of robustness appear in Methods and SI). Figure 3f shows signatures for
a subset of core reprogramming-related genes (listed in Supplementary Table S1). The sets of genes that characterize individual states broadly recapitulate known functional groups and the
order in which the states appear are consistent with specific roles. The initial state (_S_1, triangle) is marked by high expression of MEF marker genes such as _Cdh2_ and _Thy1_ and
mesenchymal genes including _Snai2_ (also known as _Slug_) and _Zeb1_. Many of these genes remain on in the first intermediate state (_S_2, square), but _Jag1_, _Notch1_ and _Cdh2_ have been
switched off. Correspondingly, expression of proliferation genes, such as _Ccnd1_, start increasing. The second intermediate state (_S_3, diamond) is marked by epithelial-associated genes
such as _Epcam_, _Ocln_, _Cdh1_ and the loss of the MEF markers. Thus, our model identifies a mesenchymal-to-epithethial transition (MET) of a group of genes from state _S_2 to _S_3 that is
consistent with previous observations18. However, our results reveal that the MET is just one aspect of a much broader change of state involving a dramatic, global reconfiguration of the
transcriptional program of a substantial fraction of genes (more than 70% of the genes show two-fold or greater change in state-resolved expression between successive states, as illustrated
by the heat-map of Fig. 3e). The final state (_S_4, star) is negative for genes such as _Tgfb1_ and positive for ESC markers such as _Nanog_, _Zfp42_ (also known as _Rex1_), _Esrrb_,
_Dppa5a_, _Utf1_, _Dppa3_, consistent with its iPSC nature. FUNCTIONAL ENRICHMENT IN INDIVIDUAL STATES To further characterize the functional nature of the states identified by STAMM we
carried out a Gene Ontology (GO) analysis using the estimated state-specific expression profiles. Specifically, we identified GO terms that are over-represented among genes up- or
down-regulated in individual states: the over-representation _p_-values are shown in Supplementary Figure S4 (see Supplementary Methods for details). The broad categories highlighted reveal
the progression of reprogramming seen in the single-cell states identified by STAMM. Overall, GO analysis of the states traversed during reprogramming of secondary MEF into iPSC in the
Samavarchi-Tehrani system illustrates that after the typical MEF signature of state _S_1, in state _S_2 reprogramming factors seem to trigger a broad range of cell activities including
signaling, morphogenesis, differentiation and transcription regulation; in _S_3 a narrowing seems to occur around fewer key activities in preparation for state _S_4 where convergence towards
the iPSC state occurs. The latter state is high in activities related, among other processes, with cycle regulation and chromatin organization. CELL POPULATION DYNAMICS STAMM gives
estimates of transition rates in the latent stochastic process (that describes changes in cell state) that give information on the dynamics of the changing cell population. Figure 3c shows
the distribution of the cell population across states as a function of time; the changing fraction of cells in each state result from single cell transitions between states (Fig. 3b). The
transition from _S_1 to _S_2 takes on average about 4 days and the transition between _S_2 and _S_3 has a similar timescale. We find, however, that the final step of the process, from second
intermediate (_S_3) to final state (_S_4), is the slowest to occur, taking on average 15 days. Our model predicts therefore that the last transition is the process bottleneck, implying that
it would be natural to act on it to try to increase reprogramming speed and efficiency. The average transition rates that we determine shed light on the strong stochasticity of
reprogramming, whereby even identical subclones reach the iPSC state with very different latency times16. In fact, each intermediate transition is a Poisson process and the variance of its
transition time is proportional to its transition rate. Since the overall process comprises multiple steps, its overall variance is roughly the sum of the single step variances. Thus, our
model predicts a variance of the total reprogramming time of the order of 3 weeks, a value consistent with experimental findings16. CELL STATE MARKERS AND THE MOLECULAR CIRCUITRY OF
REPROGRAMMING STAMM allows ranking of genes according to state-specific expression and can be used to provide insights and hypotheses concerning how specific genes are modulated during state
transitions. We focus, in particular, on: * _Switch_ genes, which are expressed in a particular state and persist at moderate-to-high expression levels in subsequent states; and * _Pulse_
genes, which are switched on in a particular state, but turned off in all other states (see also Methods; full ranked lists of state genes are reported in Supplementary Table S2). Gene lists
for each pulse and switch were further analyzed using the Gene Set Enrichment Analysis tool (GSEA; www.broadinstitute.org/gsea/msigdb/; see also Methods and SI) to investigate overlap with
published gene sets (Supplementary Table S4). We sought to investigate whether STAMM is able to identify genes that are known to play a role in reprogramming and further to identify new
insights, including potentially novel players in the process, from our genome-wide analysis. We focused on a selected group of the top-5% high ranked switch and pulse genes (see
Supplementary Fig. S7); these are shown in Figure 4, which also highlights micro-RNAs (MIRs) and transcription factors whose DNA binding motifs and known occupancy of promoters through ChIP
data show targeting of those genes. Switches identify genes which can be turned on to drive reprogramming via the induced factors (OSKM) and genes which can serve as reprogramming factors.
The histone demethylase _Utx_, for instance, turns on quickly in _S_2 and remains active: it has been recently shown to be indispensable for reprogramming33. The _S_3 switch contains _Wdr5_,
which mediates reprogramming34. Expression of _Gnl3_ is specific to the _S_4 switch and promotes reprogramming35. _Myc_ and _MIR-302_ regulate subsets of genes in these switches and are
have been shown to promote reprogramming36. Intriguingly, several commonly accepted pluripotent marker genes, such as _Nanog_ and _Sall4_ are already activated in the _S_3 switch, despite
the fact that cells in _S_3 are on average 15 days away from the final state. In contrast, _Klf5_ and _Sox2_ are highly specific to _S_4 alone (Fig. 4). These observations are supported by
recent independent single-cell experiments that indicate activation of _Klf5_ and _Sox2_ are late steps in reprogramming19. Other factors specifically marking iPS cells in these single-cell
studies were _Dppa4_, _Utf1_ and _Esrrb_; all of these genes are highly specific to _S_4 in our analysis. The single cell analysis also indicated that _Gdf3_ was activated in partially
reprogrammed cells while _Sox2_ was not, consistent with the putative pre-pluripotent nature of that state and with our observation that _Gdf3_ is switched on in _S_3. Other poor markers of
iPS cells in the single-cell assays were _Sall4_ and _Kdm1_ which are promiscuously turned on in _S_3 or earlier. Pulses identify genes that we hypothesize must be tightly controlled during
reprogramming, as they are turned on in only one state. Indeed, constitutive over-expression of these factors has a complex relationship with reprogramming. Notably the _Tcf3_ binding motif
is highly represented in the _S_3 pulse group (_p_ = 1.83 × 10⁻¹², hypergeometric test) and expression of these genes is lost in _S_4. _Tcf3_ forms an interconnected autoregulatory loop with
_Oct4_, _Sox2_ and _Nanog_ in pluripotent stem cells and is mainly in a repressive complex promoting differentiation, although some _Tcf3_ associates with β-catenin to activate target genes
and promote pluripotency37. _Tcf3_ deletion increases reprogramming38 and Wnt signaling is known to accelerate reprogramming39. Our results suggest that _Tcf3_ needs to be recruited to form
a repressive complex on the differentiation genes in _S_3, so that proper programming of the pluripotent state can occur. The _S_3 pulse further reveals that other master regulators of
differentiated lineages - _Pax4_, _Zeb1_, _Foxo4_ and _Sox11_ - also need to be turned off during this final transition. Several annotated sets of known pluripotency genes have significant
overlap with the top 5% genes of the _S_4 switch (_p_ < 10−15; see Methods and Supplementary Table S4 for gene lists). The top 5% genes of the _S_3 switch also have significant overlap
with pluripotency gene lists (_p_ ≤ 1.35 × 10⁻⁶) indicating that _S_3 may represent a pre-pluripotent state. STAMM differs fundamentally from existing gene-ranking approaches because it
estimates expression profiles that are specific to cell states. Thus, although existing gene ranking approaches based on differential expression are certainly informative, STAMM offers
complementary insights, rooted in a state-specific view. Indeed, genes highly ranked under STAMM that are implicated in reprogramming and shown in Figure 4 are not highly ranked under
conventional differential expression or temporal change criteria (Supplementary Fig. S7). STAMM can also be extended to identify pairs of genes that can jointly act as state markers (see SI
and Supplementary Fig. S9). TESTING MODEL PREDICTIONS AGAINST SINGLE-CELL DATA The foregoing results were obtained from analysis of homogenate time-course data only (the microarray data due
to Samavarchi-Tehrani _et al._18). To test the ability of our approach to uncover information on cell states we compared results with recent independent single-cell datasets on
reprogramming. We focused first on a single-cell mRNA expression dataset due to Buganim _et al._19 that considered a different secondary MEF system under reprogramming by the transduction of
_Oct4_, _Sox2_, _Klf4_ and _cMyc_. The data were obtained using the Fluidigm assay and included single-cell gene expression data for 48 genes in up to 96 cells, in a variety of populations,
ranging from starting MEFs, to cells at the 2-to-6 days stage of reprogramming, to iPS cells (see Fig. 5). Since these data are single-cell readouts, clustering of the data can be used to
identify cell states that are distinct with respect to expression patterns, as individual cells belonging to the same state with similar single-cell expression profiles should lie close to
each other in gene expression space. We carried out a cluster analysis of the data (using a widely-used multi-variate clustering tool called mclust, see SI) and selected the number of
clusters using a score known as the Bayesian Information Criterion (BIC). Although single cell technologies are still not fully mature and remain affected by relevant experimental errors, we
find that the BIC from the single-cell data (see Fig. 5a) has a large increase above two clusters but plateaus above three clusters. This does not support a single-step (two clusters) model
but is consistent with the existence of one or two intermediate states, in line with our predictions using independent microarray data. Next, we asked whether the state-specific expression
profiles we identified in the four-state model (as estimated from microarray time-course data only) were consistent with single-cell expression profiles. To this end, we computed the
distance of the gene expression profile of each single cell in the Buganim _et al._ data from each of the four state signatures that we estimated and assigned each individual cell to the
state that was closest to it in expression space. The fraction of single cells assigned to each state in the various experimental populations is shown in Figure 5b. In contrast to a random
assignment that would populate each state roughly equally, we find that specific states are highly represented in specific cell populations. The MEFs show a clear population peak in state 1,
while MEFs at the 2-to-6 days stage of reprogramming have an heterogeneous population spread over the first three states, with a peak at state 3. Finally, dox-independent colonies and iPS
cells have a population distributed over state 3 and 4, peaking respectively at 3 and 4. The state assignment is consistent with the nature of the states and the progression through the
reprogramming process. Thus we find that individual cells from an independent single-cell study of a different secondary MEF system project consistently onto the four states we identified
using microarray time-course data only. We also briefly discuss three very recent comprehensive single-cell studies of secondary reprogramming systems20,21,22. A key result in those studies
is the discovery of two intermediate “transcriptional waves” that occur in the first 12 days of reprogramming and mark the transition from initial MEF to two subsequent “stages”, which are
later followed by a “DNA methylation wave” when cells acquire stable pluripotency. These observations strongly support our independent, model-based prediction of two intermediate states and
their appearance within the first 10 days of reprogramming, followed by the establishment of a fourth (iPSC-like) state. Thus, several recent single-cell studies appear to support the
results we obtain from application of STAMM to homogenate time-course data. APPLICATION TO OTHER SYSTEMS While note must be taken of the diversity of different reprogramming systems, a
four-state model also fits data from the primary Mikkelsen _et al._40 system (see Supplementary Methods and Supplementary Fig. S8 for results), with severals genes, including _Cdh1_, _Cdh2_,
_Zeb1_ and _Nanog_ having similar state profiles, although others are dissimilar, such as _Zeb2_, _Epcam_, _Gata4_ and _Thy1_. This highlights the possible existence of common reprogramming
mechanisms between primary and secondary systems. However, the small number of time points in the Mikkelsen data currently preclude a fuller comparison of commonalities and differences
between state transitions and dynamics in the two systems. The model proposed in Hanna _et al._ for a B-cell based system17 can be recovered as a simpler case of the model presented here,
with exactly two states (one transition). Such a two-state model does not give a good fit to the Samavarchi-Tehrani data (see Supplementary Fig. S3a), indicating that intermediate states are
needed to explain the dynamics seen in the secondary MEF system. Also in a single-cell mRNA-seq dataset due to Tang _et al._2 obtained during the derivation of embryonic stem cells from the
inner cell mass, we found that the number of states seen for gene pairs in the single-cell data mirrors the corresponding discriminatory scores obtained from our analysis of the
Samavarchi-Tehrani reprogramming data (see Supplementary Methods and Supplementary Fig. S9). DISCUSSION We put forward a new stochastic model for the investigation of cellular transition
processes. We showed how the model can be used to explore transition processes in a genome-wide fashion using conventional, population-averaged time-course data, in this way providing new
insights as well as detailed guidance for single-cell studies with smaller, selected sets of genes (or other molecular readouts). Application of our approach to stem-cell reprogramming
recapitulated a wealth of known biology. Furthermore, the analysis shed new light on the process, including several insights that we found to be consistent with recent single-cell studies
and novel hypotheses that could be tested in future experiments. The approach could be similarly applied to differentiation, development or oncogenic transformation, to provide insights and
hypotheses concerning cell states visited during these processes. Our model provides a bioinformatics tool as well as a conceptual framework that should be useful in helping to better
understand cell states and their transitions. However, several questions concerning the meaning and interpretation of cell states remain open and were not addressed in our analysis. Our
model seeks to identify states that are distinct with respect to the molecular data type used for analysis (here gene expression), but cannot itself determine whether such differences
correspond to states that are distinct in a deeper sense, for example in terms of a specific, discrete phenotype of interest. This limitation is analogous to that faced by cluster analysis:
identifying groups of samples (e.g. cells, genes or patients) that are distinct with respect to certain measured variables may or may not correspond to a specific functional difference of
interest. Our approach provides detailed information regarding putative cell states; such information should be regarded as providing testable hypotheses and guidance for the design of
follow-up experiments. In the case of stem-cell reprogramming we concluded that a four state model can be used to explain transcriptional dynamics observed during reprogramming of MEFs into
iPSCs in a secondary system18 (see Fig. 2). This led to detailed molecular profiles of two new, intermediate single-cell states. Our results suggested that the transition between the second
intermediate (_S_3) to the final reprogrammed state (_S_4) is the process bottleneck. This multiple-state model also explains the variance (over weeks) of subclone reprogramming times,
consistent with experimental observations16. Our results show how state transitions in reprogramming involve global transcriptional changes (see Fig. 3). As one part of these global changes,
we observed a mesenchymal-to-epithelial transition that takes place between states _S_2 and _S_3, in agreement with previous experimental observations18. Interestingly, our analysis
contradicts the view that genes such as _Nanog_ and _Sall4_ are true markers of pluripotency, since these genes are already expressed in the penultimate state _S_3 which is 15 days away from
the final state _S_4. Strikingly, this observation is supported by recent single-cell data19. Output from our model provides immediate and detailed guidance for the design of future
single-cell experiments. We showed how state-resolved analysis using STAMM complements and extends available analyses and tools, providing new insights into the molecular circuitry of
reprogramming, including lists of single-cell state specific “switch” and “pulse” genes (see Fig. 4). Since the STAMM gene lists and markers were obtained via an unbiased, genome-wide
analysis, highly-ranked genes may represent important candidates for future investigation. Moreover, since the model yields mean transition times between states, our results suggest specific
times at which to optimally isolate intermediate states. In the reprogramming context, such insights can also help to design strategies to optimally accelerate the transitions. We tested
our model predictions against recent single cell data from a different secondary MEF system19. This analysis suggests that a four state model is consistent with such data and moreover that
individual cells project in a consistent manner onto the states that we identified using the Samavarchi-Tehrani microarray time-course data18 (see Fig. 5). Our predictions are also
consistent with and allow the interpretion of, a number of very recent comprehensive studies20,21,22 which revealed intermediate transcriptional waves in iPSC reprogramming. Overall, the
available single-cell experimental data support the picture of the structure of reprogramming that emerges from our genome-wide analysis. Large-scale epigenetic changes are also observed
upon reprogramming11,41. The method we propose should be applicable to time-varying epigenetic data42 to directly identify state-specific epigenetic signatures along with expression
patterns. The model we propose and its future extensions can provide a starting point for a comprehensive interpretation of the next-generation of single-cell data on reprogramming and other
cellular transition processes in development, differentiation and disease. METHODS Here, we briefly describe Methods used in the paper. Further information, including full technical
details, appear in SI. THE MODEL Our model describes state changes at the single-cell level using a latent continuous-time Markov process. Here, we restricted attention to forward-only state
transitions, such that transitions between _n_ states indexed by _i_ are parameterized by (_n_ − 1) transition rates _w__i_,_i_+1 (collectively denoted by W). Our general approach could in
principle be extended to more general transition topologies, but depending on the specific application and model constraints further data could be required to ensure identifiability. The
rates _w__i_,_i_+1 fully determine the dynamics (assuming rates of cell division and death are independent of state). We assume that the initial population is homogeneous (all cells in an
initial state). Under these model assumptions, the master equation for the latent Markov process can be solved fully (see SI for details) to give the probabilities _p__i_(_t_) that an
individual cell is in state _i_ at time _t_ (Fig. 3c). Each state in the model has state-specific parameters β_ij_ that represent the mean expression level for gene _j_ in single-cell state
_i_ (“state-specific signatures”). Each cell in the population is associated with its own latent Markov process; we assume the cell-specific processes are stochastically independent. We link
the single-cell latent processes to population-level observables by aggregating over individual cells. At any given time _t_ each individual cell in the population is in one of the _n_
states, with the probability of being in state _i_ given by the solution _p__i_(_t_) to the master equation. For a large number of cells, the fraction of cells in each state _i_ at time _t_
is therefore given by _p__i_(_t_). Population average expression of gene _j_ at time _t_ can now be written in terms of expression per state weighted by the fraction of cells in each state
at the given time; this yields the expression shown in the Introduction and reproduced below where the dependence of _p__i_(_t_) on transition rates W is made explicit. The above expression
links the parameters of the latent processes at the single-cell level to population-level observables _x__j_(_t_). Making the noise model explicit we arrive at where denotes a Normal density
and denotes gene-specific variance. This latter expression gives the likelihood. We estimated the parameters β_ij_ and _w__i_,_i_+1 using a estimator related to the maximum _a posteriori_
estimator for the Bayesian formulation below (see SI for details). For complex models with many parameters, it is important to check stability of estimation to guard against artifactual
results. To check stability of the penalized estimator, we re-estimated parameters following perturbation of the data and compared with estimates obtained from the original data. We
perturbed the data in two ways: a) adding Gaussian noise and b) removing an entire time point (see Supplementary Fig. S5 and below). We found that results reported were robust to such
perturbations, suggesting that overall estimator variance is well controlled. We also carried out a re-analysis under permutation of the temporal order of the data (Supplementary Fig. S6).
We found that both model fit and distinctness of state signatures were systematically worse under such temporal permutation, suggesting that our simple model of transition dynamics captures
real temporal structure in the data. STAMM software, implementing the above model and associated estimators and gene ranking tools (see below) is provided as part of the Supplementary
Information and at mukherjeelab.nki.nl/CODE/STAMM.zip. MODEL SELECTION We used a Bayesian model selection procedure to complement the model selection heuristics reported in the Main Text. A
full description of the Bayesian formulation, including details of the Markov chain Monte Carlo (MCMC) appear in SI. Let _M__n_ denote the model with _n_ states and Y = {_y__j_} denote
observed data for all genes. Taking a flat prior over models _P_(_M__n_) ∝ 1, the posterior probability over models is _P_(_M__n_|Y) ∝ _p_(Y|_M__n_). The marginal likelihood, _p_(Y|_M__n_),
is obtained by integrating out all model parameters (β's, _w_'s and σ's) from the likelihood corresponding to the noise model in Eq. (3) above. This gives a score for each
model that takes account of both fit-to-data and model complexity that is then normalized to give the posterior probability over number of states. We further investigated model selection by
applying it to the data with time points permuted (Supplementary Fig. S6); while application to the original data showed clear evidence of intermediate states, this is completely lost under
temporal permutation, suggesting that the evidence for intermediate states is rooted in real temporal structure in the data. GENE RANKING STAMM ranks genes by using estimated state-specific
signatures β. For each state _i_ and gene _j_ we call the score the “state-specific score”, since it indicates state-specific expression relative to all states for that gene (up-regulated
genes in a given state are the top scoring genes while down-regulated genes are the lowest scoring). Gene lists for Fig. 4 were then obtained as follows. For profiles with expression
switched on in one state only (_S_2 pulse, _S_3 pulse and _S_4 switch) genes were ranked under the respective state-specific scores _s__ij_. For the _S_2 and _S_3 switch profiles, in which
genes are switched on in multiple states, rankings were carried out with respect to fold change in state-specific expression β before and after a switch: this was done using the minimum fold
change between β's for any state after the switch with respect to any state before the switch. GENE ONTOLOGY (GO) ANALYSIS State-specific gene lists were obtained from STAMM rankings
as described above. To form a list of genes up-regulated in state _i_, we retained those genes _j_ with pulse score _s__ij_ ≥ 2 and to form a list of genes down-regulated we retained those
genes _j_ having _s__ij_ ≤ 0.5. GO analysis was performed using the Cytoscape plugin BINGO43. In Supplementary Fig. S4, for clarity, only the significant GO terms with number of descendants
between 200 and 800 are shown. REFERENCES * Evans, M. J. & Kaufman, M. H. Establishment in culture of pluripotential cells from mouse embryos. Nature 292, 154–156 (1981). Article ADS
CAS PubMed Google Scholar * Tang, F. et al. Tracing the derivation of embryonic stem cells from the inner cell mass by single-cell RNA-seq analysis. Cell Stem Cell 6, 468–478 (2010).
Article CAS PubMed PubMed Central Google Scholar * Vierbuchen, T. et al. Direct conversion of fibroblasts to functional neurons by defined factors. Nature 463, 1035–1041 (2010). Article
ADS CAS PubMed PubMed Central Google Scholar * Pang, Z. P. et al. Induction of human neuronal cells by defined transcription factors. Nature 476, 220–223 (2011). Article ADS CAS
PubMed PubMed Central Google Scholar * Caiazzo, M. et al. Direct generation of functional dopaminergic neurons from mouse and human fibroblasts. Nature 476, 224–227 (2011). Article ADS
CAS PubMed Google Scholar * Ieda, M. et al. Direct reprogramming of fibroblasts into functional cardiomyocytes by defined factors. Cell 142, 375–386 (2010). Article CAS PubMed PubMed
Central Google Scholar * Efe, J. A. et al. Conversion of mouse fibroblasts into cardiomyocytes using a direct reprogramming strategy. Nat. Cell Biol. 13, 215–222 (2011). Article CAS
PubMed Google Scholar * Huang, P. et al. Induction of functional hepatocyte-like cells from mouse fibroblasts by defined factors. Nature 475, 386–389 (2011). Article CAS PubMed Google
Scholar * Sekiya, S. & Suzuki, A. Direct conversion of mouse fibroblasts to hepatocyte-like cells by defined factors. Nature 475, 390–393 (2011). Article CAS PubMed Google Scholar *
Takahashi, K. & Yamanaka, S. Induction of pluripotent stem cells from mouse embryonic and adult fibroblast cultures by defined factors. Cell 126, 663–676 (2006). Article CAS PubMed
Google Scholar * Hanna, J. H., Saha, K. & Jaenisch, R. Pluripotency and cellular reprogramming: Facts, hypotheses, unresolved issues. Cell 143, 508–525 (2010). Article CAS PubMed
PubMed Central Google Scholar * Okita, K. & Yamanaka, S. Induced pluripotent stem cells: opportunities and challenges. Philos. Trans. R. Soc. Lond. B Biol. Sci. 366, 2198–2207 (2011).
Article CAS PubMed PubMed Central Google Scholar * Wilmut, I., Sullivan, G. & Chambers, I. The evolving biology of cell reprogramming. Philos. Trans. R. Soc. Lond. B Biol. Sci. 366,
2183–2197 (2011). Article CAS PubMed PubMed Central Google Scholar * Vogel, G. Diseases in a dish take off. Science 330, 1172–1173 (2010). Article ADS CAS PubMed Google Scholar *
Wernig, M. et al. In vitro reprogramming of fibroblasts into a pluripotent ES-cell-like state. Nature 448, 318–324 (2007). Article ADS CAS PubMed Google Scholar * Jaenisch, R. &
Young, R. Stem cells, the molecular circuitry of pluripotency and nuclear reprogramming. Cell 132, 567–582 (2008). Article CAS PubMed PubMed Central Google Scholar * Hanna, J. et al.
Direct cell reprogramming is a stochastic process amenable to acceleration. Nature 462, 595–601 (2009). Article ADS CAS PubMed PubMed Central Google Scholar * Samavarchi-Tehrani, P. et
al. Functional genomics reveals a BMP-driven mesenchymal-to-epithelial transition in the initiation of somatic cell reprogramming. Cell Stem Cell 7, 64–77 (2010). Article CAS PubMed
Google Scholar * Buganim, Y. et al. Single-cell expression analyses during cellular reprogramming reveal an early stochastic and a late hierarchic phase. Cell 150, 1209–1222 (2012). Article
CAS PubMed PubMed Central Google Scholar * Polo, J. et al. A molecular roadmap of reprogramming somatic cells into iPS cells. Cell 151, 1617–32 (2012). Article CAS PubMed PubMed
Central Google Scholar * Hansson, J. et al. Highly coordinated proteome dynamics during reprogramming of somatic cells to pluripotency. Cell Report 2, 1579–92 (2012). Article CAS Google
Scholar * O'Malley, J. et al. High-resolution analysis with novel cell-surface markers identifies routes to iPS cells. Nature 499, 88–91 (2013). Article ADS CAS PubMed PubMed
Central Google Scholar * Tai, Y. & Speed, T. A multivariate empirical Bayes statistic for replicated microarray time course data. Ann. Stat. 34, 2387–2412 (2006). Article MathSciNet
MATH Google Scholar * Kalaitzis, A. & Lawrence, N. A simple approach to ranking differentially expressed gene expression time courses through gaussian process regression. BMC Bioinf.
12, 180 (2011). Article Google Scholar * Heard, N., Holmes, C., Stephens, D., Hand, D. & Dimopoulos, G. Bayesian coclustering of Anopheles gene expression time series: study of immune
defense response to multiple experimental challenges. Proc. Natl. Acad. Sc. USA 102, 16939–16944 (2005). Article ADS CAS Google Scholar * Roy, S., Lane, T., Allen, C., Aragon, A. &
Werner-Washburne, M. A hidden-state Markov model for cell population deconvolution. J. Comp. Bio. 13, 1749–74 (2006). Article MathSciNet CAS Google Scholar * Bar-Joseph, Z., Farkash, S.,
Gifford, D., Simon, I. & Rosenfeld, R. Deconvolving cell cycle expression data with complementary information. Bioinformatics 20, i23–i30 (2004). Article CAS PubMed Google Scholar *
Bar-Joseph, Z. et al. Genome-wide transcriptional analysis of the human cell cycle identifies genes differentially regulated in normal and cancer cells. Proc. Natl. Acad. Sci. USA 105,
955–60 (2009). Article ADS Google Scholar * Siegal-Gaskins, D., Ash, J. & Crosson, S. Model-based deconvolution of cell cycle time-series data reveals gene expression details at high
resolution. PLoS Comput. Biol. 5, e1000460 (2009). Article ADS MathSciNet PubMed PubMed Central CAS Google Scholar * Orlando, D. et al. A probabilistic model for cell cycle
distributions in synchrony experiments. Cell Cycle 6, 478–488 (2007). Article CAS PubMed Google Scholar * Rowicka, M., Kudlicki, A., Tu, B. P. & Otwinowski, Z. High-resolution timing
of cell cycle-regulated gene expression. Proc. Natl. Acad. Sci. USA 104, 16892–16897 (2007). Article ADS CAS PubMed PubMed Central Google Scholar * Costa, I., Roepcke, S.,
Hafemeister, C. & Schliep, A. Inferring differentiation pathways from gene expression. Bioinformatics 24, i156–64 (2008). Article CAS PubMed PubMed Central Google Scholar * Mansour,
A. et al. The H3K27 demethylase Utx regulates somatic and germ cell epigenetic reprogramming. Nature 488, 409–413 (2012). Article ADS CAS PubMed Google Scholar * Ang, Y. et al. Wdr5
mediates self-renewal and reprogramming via the embryonic stem cell core transcriptional network. Cell 145, 183–197 (2011). Article CAS PubMed PubMed Central Google Scholar * Qu, J.
& Bishop, J. M. Nucleostemin maintains self-renewal of embryonic stem cells and promotes reprogramming of somatic cells to pluripotency. J. Cell Biol. 197, 731–745 (2012). Article CAS
PubMed PubMed Central Google Scholar * Subramanyam, D. et al. Multiple targets of miR-302 and miR-372 promote reprogramming of human fibroblasts to induced pluripotent stem cells. Nat.
Biotechnol. 29, 443–448 (2011). Article CAS PubMed PubMed Central Google Scholar * Cole, M., Johnstone, S., Newman, J., Kagey, M. & Young, R. Tcf3 is an integral component of the
core regulatory circuitry of embryonic stem cells. Genes Dev. 22, 746–755 (2008). Article CAS PubMed PubMed Central Google Scholar * Lluis, F. et al. T-cell factor 3 (Tcf3) deletion
increases somatic cell reprogramming by inducing epigenome modifications. Proc. Natl. Acad. Sc. USA 108, 11912–917 (2011). Article ADS CAS Google Scholar * Marson, A. et al. Wnt
signaling promotes reprogramming of somatic cells to pluripotency. Cell Stem Cell 3, 132–135 (2008). Article CAS PubMed PubMed Central Google Scholar * Mikkelsen, T. S. et al.
Dissecting direct reprogramming through integrative genomic analysis. Nature 454, 49–55 (2008). Article ADS CAS PubMed PubMed Central Google Scholar * Koche, R. P. et al. Reprogramming
factor expression initiates widespread targeted chromatin remodeling. Cell Stem Cell 8, 96–105 (2011). Article CAS PubMed PubMed Central Google Scholar * Deal, R. B., Henikoff, J. G.
& Henikoff, S. Genome-wide kinetics of nucleosome turnover determined by metabolic labeling of histones. Science 328, 1161–1164 (2010). Article ADS CAS PubMed PubMed Central Google
Scholar * Maere, S., Heymans, K. & Kuiper, M. BiNGO: a Cytoscape plugin to assess overrepresentation of Gene Ontology categories in biological networks. Bioinformatics 21, 3448–3449
(2005). Article CAS PubMed Google Scholar Download references ACKNOWLEDGEMENTS This work was supported by UK EPSRC EP/E501311/1 and the Cancer Systems Biology Center grant from the
Netherlands Organisation for Scientific Research. AUTHOR INFORMATION AUTHORS AND AFFILIATIONS * Centre for Complexity Science, University of Warwick, Coventry, UK Jonathan W. Armond, Anas A.
Rana & Chris J. Oates * Department of Biomedical Engineering, University of Wisconsin-Madison, Madison, WI, USA Krishanu Saha * The Whitehead Institute for Biomedical Research,
Massachusetts Institute of Technology, Cambridge, MA, USA Rudolf Jaenisch * Division of Biochemistry, The Netherlands Cancer Institute, Amsterdam, The Netherlands Anas A. Rana, Chris J.
Oates & Sach Mukherjee * Department of Statistics, University of Warwick, Coventry, UK Chris J. Oates * Department of Biology, Massachusetts Institute of Technology, Cambridge, MA, USA
Rudolf Jaenisch * Dip.to di Scienze Fisiche, Univ. di Napoli “Federico II”, INFN, Napoli, Italy Mario Nicodemi Authors * Jonathan W. Armond View author publications You can also search for
this author inPubMed Google Scholar * Krishanu Saha View author publications You can also search for this author inPubMed Google Scholar * Anas A. Rana View author publications You can also
search for this author inPubMed Google Scholar * Chris J. Oates View author publications You can also search for this author inPubMed Google Scholar * Rudolf Jaenisch View author
publications You can also search for this author inPubMed Google Scholar * Mario Nicodemi View author publications You can also search for this author inPubMed Google Scholar * Sach
Mukherjee View author publications You can also search for this author inPubMed Google Scholar CONTRIBUTIONS J.W.A., A.A.R. and C.J.O. did computational analyses; they and K.S. performed
research; J.W.A., K.S., C.J.O., R.J., M.N. and S.M. wrote the manuscript; M.N. and S.M. conceived and led the project. ETHICS DECLARATIONS COMPETING INTERESTS The authors declare no
competing financial interests. ELECTRONIC SUPPLEMENTARY MATERIAL SUPPLEMENTARY INFORMATION Table S2 SUPPLEMENTARY INFORMATION Table S3 SUPPLEMENTARY INFORMATION Table S4 SUPPLEMENTARY
INFORMATION Supplementary Information RIGHTS AND PERMISSIONS This work is licensed under a Creative Commons Attribution-NonCommercial-ShareAlike 3.0 Unported License. To view a copy of this
license, visit http://creativecommons.org/licenses/by-nc-sa/3.0/ Reprints and permissions ABOUT THIS ARTICLE CITE THIS ARTICLE Armond, J., Saha, K., Rana, A. _et al._ A stochastic model
dissects cell states in biological transition processes. _Sci Rep_ 4, 3692 (2014). https://doi.org/10.1038/srep03692 Download citation * Received: 28 June 2013 * Accepted: 03 December 2013 *
Published: 17 January 2014 * DOI: https://doi.org/10.1038/srep03692 SHARE THIS ARTICLE Anyone you share the following link with will be able to read this content: Get shareable link Sorry,
a shareable link is not currently available for this article. Copy to clipboard Provided by the Springer Nature SharedIt content-sharing initiative