- Select a language for the TTS:
- UK English Female
- UK English Male
- US English Female
- US English Male
- Australian Female
- Australian Male
- Language selected: (auto detect) - EN
Play all audios:
ABSTRACT To identify major active constituents and measure their levels in a typical medicinal herb–_Rhizoma coptidis_, we applied the concept of removing and adding, taking inspiration from
functional genetic methods. As this herb has bacteriostatic properties and is used to treat bacterial diarrhea, we examined the effects of individual constituents (berberine, palmatine,
coptisine, epiberberine, jateorrhizine and columbamine) on the growth of _Shigella dysenteriae_ with microcalorimetry. The removing and adding procedures revealed that berberine and
coptisine were the main antibacterial constituents of _R. coptidis_, with bacteriostatic activities of 54.10% and 39.75%, respectively. The relative levels of berberine and coptisine in _R.
coptidis_ were 8.08%–31.92% and 4.05%–14.45%, respectively. On the basis of whole effect, the method of constituents removing and adding, coupled with a bioassay, is a useful strategy to
identify the active constituents and measure their levels in herbal medicines, which may provide reference to other natural products. SIMILAR CONTENT BEING VIEWED BY OTHERS EXPLORING THE
ANTIOXIDANT AND ANTIMICROBIAL PROPERTIES OF FIVE INDIGENOUS KENYAN PLANTS USED IN TRADITIONAL MEDICINE Article Open access 09 January 2025 PHYTOCHEMICAL SCREENING, UPLC ANALYSIS, EVALUATION
OF SYNERGISTIC ANTIOXIDANT AND ANTIBACTERIAL EFFICACY OF THREE MEDICINAL PLANTS USED IN KINSHASA, D.R. CONGO Article Open access 24 March 2025 PHYTOCHEMICAL PROFILING, ANTIOXIDANT POTENTIAL,
AND UHPLC-HRMS ANALYSIS OF _PHLOMIS_ GENUS AERIAL PARTS FOR THERAPEUTIC APPLICATIONS Article Open access 25 February 2025 INTRODUCTION The quality of a medicine provides an important
foundation for its clinical efficacy. Unlike pharmaceutical drugs that contain specific active constituents and exhibit clear dose-dependent effects, herbal medicines are often derived from
complex systems containing multiple components1,2. For a long time, the content detection of constituents is the main quality control (QC) method for herbal medicines. While as we
know3,4,5,6,7,8, herbal medicines are prepared from complex organisms that contain multiple active constituents that act additively to elicit effects that greater than those of the
individual components9,10,11. And the determination of indicators and their content level of the existing quality standard (QS) are often subjective without powerful evidences, which lead to
the uncorrelation between the QS and clinical efficacy12,13,14. Consequently, herbal medicines are poorly accepted by the mainstream of medical community, including medical experts,
clinical pharmacists, economists, sociologists and patients1,15,16,17,18. There are both genetic information (gene) and chemical information (constituent) existing in organisms. In the
identification of functional genes, the discovery and validation of each gene is closely related to the strategy of gene targeting and related techniques, including knockout and knock-in
methods19,20,21,22,23. This strategy has been successfully used to determine the contributions of functional genes within organisms, providing the basis for genetic screening and gene
therapy (Supplementary Fig. S1a). By this inspiration (Supplementary Fig. S1b), methods to identify the active constituents and measure their levels in herbs, as complex organisms, can
involve constituent removing (similar to knockout) and adding (similar to knock-in), which makes the setting of QS more well-founded related to the whole effect. As the discovery of
functional genes is closely related to the phenotypic analysis, the validation of active constituents in herbal medicines cannot be separated from the bioactivity detection.
Microcalorimetry, an automatic and quantifiable method that measures changes in energy levels at the cellular, tissue, organ, or whole organism levels etc., has been used in physical,
chemical and biochemical fields18,24,25,26,27,28. Compared with conventional methods (e.g., microplate and turbidimetry assays), microcalorimetry can provide detailed information on the
bacteriostatic effects of drugs in real-time, online and high-throughput screening assays. Therefore, microcalorimetry is widely used to assess the bacteriostatic activity of
drugs29,30,31,32,33. _Rhizoma coptidis_ (_R. coptidis_), an important herbal medicine to treat bacterial diarrhea, constipation, diabetes and other major diseases in Asia, Africa and Latin
America for a long history32,34 (Supplementary Fig. S2), was studied in this research. There are a lot of protoberberine alkaloids in _R. coptidis_, of which the structure belongs to
isoquinoline alkaloids. The structural differences of those alkaloids are mainly caused by different groups bound to C2, C3, C9 and C10 (Supplementary Fig. S3). But their contributions to
the bacteriostatic activity of _R. coptidis_ and the content levels have not been clearly specified. Thus, we put forward the strategy of constituent removing and adding, hoping to discover
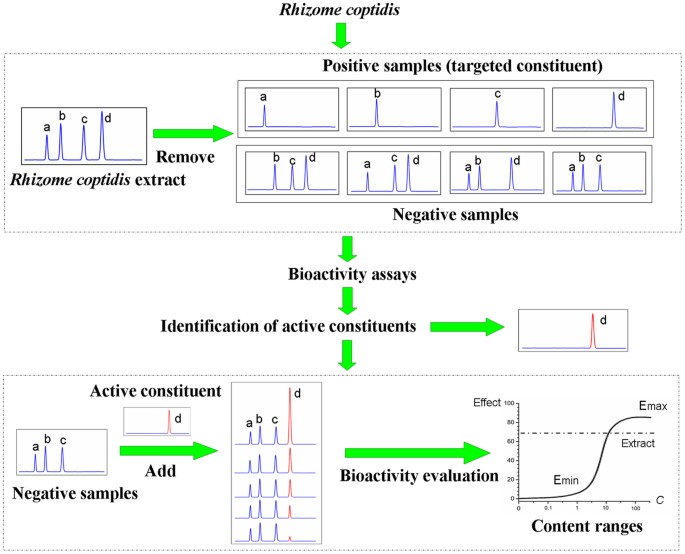
active constituents of _R. coptidis_ inhibiting _Shigella dysenteriae_ (_S. dysenteriae_) and their content limits. Specifically, we first removed the targeted constituents from _R.
coptidis_ to evaluate the inhibitory effects of the targeted constituent and its negative sample (samples lacking the targeted constituent) on the activity of _S. dysenteriae_, with
unmodified _R. coptidis_ extract as a reference sample. After confirming the identities of the active constituents, the targeted constituents were added into the negative samples
individually to measure their bacteriostatic effects. We believe that the difficulty of characterizing the active constituents and measuring their levels in herbs can be overcome by applying
the removing and adding strategy together with a bioassay. This method can provide an important reference for the establishment of QS related to the clinical efficacy. The experimental
strategy used in this study is shown in Fig. 1. RESULTS CONSTITUENT REMOVING AND CHEMICAL IDENTIFICATION A preparative thin layer chromatography plate (PTLCP) was used to achieve constituent
removal. Each band on the plate corresponded to one constituent and was regarded as a positive sample (namely targeted constituent marked by letter M+). The rest of bands was defined as the
corresponding negative sample (marked by letter M−). Next, we used Ultra-performance liquid chromatography (UPLC) and quadrupole time-of-flight mass spectrometry (Q-TOF MS) to identify the
constituent of each band and to determine whether there were residual compounds in the corresponding negative sample. Using this method, the constituents in the positive samples were
preliminarily identified (Supplementary Fig. S4) as berberine (BER), palmatine (PAL), coptisine (COP), epiberberine (EPI), jateorrhizine (JAT) and columbamine (COL), respectively. The levels
of the removed constituents in the negative samples were nearly undetectable (Supplementary Fig. S4). Furthermore, the molecular structures of the removed constituents were not damaged by
the removal procedure (Supplementary Fig. S5). IDENTIFICATION OF THE ACTIVE CONSTITUENTS The growth and metabolism of living organisms are accompanied by heat/energy production, which can be
affected by pathological changes or the action of drugs. Therefore, it is possible to evaluate changes in microbial heat production in the presence or absence of different drugs using
microcalorimetry. Accordingly, we determined the bioactivity of _R. coptidis_ extract, removed samples and added samples in terms of bacteriostasis. The normal growth thermogenic curve for
_S. dysenteria_e at 37°C is shown in Fig. 2a. The heat flow power-time (HFP-_t_) curve showed that the _S. dysenteriae_ metabolic profile included two main stages (stages 1 and 2) and five
phases, (lag phase [a–b], the first exponential growth phase [b–c], transition phase [c–d], the second exponential growth phase [d–e] and the decline phase [e–f]). The quantitative
thermokinetic parameters of the HFP-_t_ curve for _S. dysenteriae_ growth could be delineated using the equation (1): where _P_0 and _P_t represent the heat flow power at time 0 or time
(min), respectively. To test the reliability of the microcalorimetry, we repeated the experiment on eight occasions in untreated bacteria and obtained good reproducibility. We then
quantified the following thermokinetic parameters from the HFP-_t_ curves in the presence of difference concentrations of the samples: _p_1, _p_2, _t_1 and _t_2 (Table 1). PCA revealed that
_k_2 and _t_2 explained 87% of the variation of samples, including the _R. coptidis_ extract, removed samples and added samples. Therefore, we focused on parameters _k_2 and _t_2 in this
study. Figures 2b, c illustrate the effects of _R. coptidis_ (0.8 mg/mL) extract, removed constituents and corresponding negative samples on the HFP-_t_ curves of _S. dysenteriae_. We found
that, compared with the control and the _R. coptidis_ extract, the kinetics of the removed and negative samples showed marked variation (Supplementary Table S1). Next, we calculated the
inhibition ratio _I_ as equation (2) and the relative inhibition ratio _RI_ as equation (3) to quantify the contributions of the individual constituent to the bacteriostatic activity of _R.
coptidis_ extract. As shown in Fig. 2d, BER, COP, EPI, PAL and JAT + COL removed inhibited the growth and metabolism of _S. dysenteriae_; of which BER and COP had the greatest effects. The
bacteriostatic activities of BER− and COP− were significantly lower than that of _R. coptidis_ extract (_P_ < 0.01). Furthermore, the bacteriostatic activities of EPI−, PAL− and (JAT +
COL)− were not significantly different to that of _R. coptidis_ extract. Thus, BER and COP appear to be the main bacteriostatic constituents of _R. coptidis_ extract with contributions to
the bacteriostatic activity of 54.10% and 39.75%, respectively (Fig. 2d). where _K_2c is the growth rate constant of the second exponential growth phase of _S. dysenteriae_ in the culture
medium alone; _k_2s is the growth rate constant of the second exponential growth phase of _S. dysenteriae_ exposed to the test samples; _I_s is the inhibition ratio of samples under
evaluation; _I_e is the inhibition ratio of _R. coptidis_ extract (reference); and _RI_ is the relative inhibition ratio. CONSTITUENT ADDING AND CHEMICAL IDENTIFICATION After confirming that
BER and COP were the main bioactive constituents of _R. coptidis_, we added BER to its negative sample (BER−) to final concentrations of 0, 15, 45, 60, 80 and 120 μg/mL, which was
equivalent to the relative content of BER in _R. coptidis_ extract was (14.52%, based on the no-show detection process). HPLC was used to confirm the chemical compositions of the added
samples. We also prepared added samples of COP at concentrations of 0, 8, 16, 32, 64 and 128 μg/mL, similar to the COP content in _R. coptidis_ extract (5.3%, based on the no-show detection
method). The HPLC profiles are shown in Fig. 3a, b and Supplementary Fig. S6. LEVELS OF THE ACTIVE CONSTITUENTS The bacteriostatic activity of samples adding BER or COP was assessed by
microcalorimetry (Fig. 3c,d) and _I_ and _RI_ were calculated (Tables 1 and 2). The relationship between _RI_ and BER or COP concentrations are shown in Fig. 4. To determine the correlation
between the concentrations of active constituents in added samples and _I_, we calculated the change in _I_ induced by the each concentration of active constituents (_P_) using equation (4):
where _I_n is the inhibition ratio of the negative sample lacking the targeted constituent; _I_i is the inhibition ratio of the negative sample following the targeted constituent added; and
_W_ is the corresponding total concentration of the targeted constituent causing _I_i. As illustrated in Fig. 4, the relative potencies of COP (i.e., _P_COP) and BER (i.e., _P_BER) were
similar (red curves in Fig. 4). For both constituents, their relative potencies increased with increasing weight. However, the potency started to decrease when the weight passed a threshold
level. Therefore, the peak values in the _P_COP and _P_BER curves (e and f in Fig. 4) are likely to show the greatest potencies. Therefore, the concentrations of COP and BER that showed the
greatest efficiency were 32 μg/mL and 80 μg/mL, respectively. We calculated that the greatest efficiency of COP and BER is at the relative concentrations 14.45% and 31.92%, respectively. The
dose–response curves in Fig. 4 (blue curves) revealed some differences in _I_COP and _I_BER. Points a and b in Fig. 4 correspond to the _RI_s of COP and BER, respectively. These values
differed because the corresponding negative samples contained other constituents. Points c and d in Fig. 4 correspond to the _RI_s of 8 μg/mL COP and 15 μg/mL BER, respectively. At
concentrations of COP and BER exceeding 8 μg/mL and 15 μg/mL, respectively, the _RI_s increased rapidly and there was a significant difference between _I_i and _I_n. We also found that the
relative compositions of COP and BER which showed the best efficiency were 4.05% and 8.08%, respectively (Tables 1 and 2). The _RI_ of COP did not increase markedly with further increases in
concentrations after point g. Thus, the concentration of 32 μg/mL, corresponding to point g, might be the maximum dose of COP. By contrast, because there was no apparent plateau for _I_BER,
we could not determine the maximum dose of BER. Although this finding might be due to synergistic effects of BER combined with other constituents of the negative samples, further studies
are needed to confirm this possibility. By comparing the _I_BER and _P_BER curves, we found that _P_BER decreased sharply after point f, but _I_BER did not increase substantially.
Accordingly, we speculate that the concentration of 80 μg/mL, which corresponds to point f, could be the maximum dose limit of BER. By comparing the relative compositions of the knocked in
constituents (Table 1), we found that the relative composition of BER with the greatest efficiency was 31.92%. DISCUSSION Currently, the choice of QC indicators for herbal medicines is often
subjective without forceful evidences12,13,14. Inspired by the discovery of functional genes, we put forward the strategy of constituent removing and adding according to the dual attributes
of genetic information (genes) and chemical information (constituents) of organisms, hoping to promote the QC of herbal medicines. With this method, we found that the main bioactive
constituents in _R. coptidis_ that inhibited the growth of _S. dysenteriae_ were BER and COP, with contributions to the bacteriostatic activity of 54.10% and 39.75%, respectively. By adding
BER and COP into their negative samples, we found that the relative concentrations of BER and COP were 8.08%–31.92% and 4.05%–14.45%, respectively. We also found that BER alone did not fully
account for the bacteriostatic activity of _R. coptidis_, although BER preparations are now widely used in clinical settings. Although our strategy was inspired by gene knockout and
knock-in, there are fundamental differences between these methods. In particular, gene knockout and knock-in involves gene recombination and changes to the expression of genes through
knockout, knock down and silencing, which has dynamic features and can be expanded19,20,21,22,23. In terms of removing and adding of the constituents of an herbal medicine, there are five
technical issues that need to be considered: (1) What constituent is being removed? (2) Was the removed constituent a single compound? (3) Does removal affect the structure of the targeted
constituent? (4) How to add the constituent? (5) Are there any sensitive and high-throughput methods that can be used to assess the bioactivity? To deal with those issues in the study of
constituent removing and adding of herbs, we used the convenient and reliable PTLCP to remove the bioactive constituents capable of inhibiting the growth of _S. dysenteriae_. Although JAT
and COL were not separated completely, the result showed that the combination of them contributed little to the bacteriostatic activity of _R. coptidis_ extract, which meant that the two
constituents were not mainly active ones. Additionally, we performed HPLC and MS-MS to confirm that the removed constituents were not damaged and there were almost no residual constituents
in the negative samples. We also verified that the active constituents were added correctly. By using PTLCP, we were able to prepare sufficient quantities of samples. Although there are many
methods available to assess bacteriostatic activity, we used a sensitive and high-throughput method called microcalorimetry to assess the bioactivity of the removed and added constituents.
A common characteristic of complex living organisms, such as herbal medicines, is that all of the constituents work together to produce an effect that is greater than the effects of the
individual constituents. Unlike the traditional method of separating and then testing the activity of individual phytochemicals, we tried to avoid the limitations of reductionism in studies
of complex systems without considering the interactions among constituents. Instead, we removed the targeted constituents from a complex system and then added them into the system to
investigate the activity of samples. In this way, we ensure our conclusions can be used to establish a QS for herbs that is suitable for the clinical use and has guaranteed the clinical
efficacy. Although there is a limitation of the strategy for its dependence on the separation of constituents, the combination of multiple techniques such as preparative high performance
liquid chromatography and high speed counter current chromatography could be used to remove the targeted constituent35,36,37. Meanwhile, with the development of further researches on the
constituent separation of herbal medicines, we believe that the strategy will also be improved better. Further studies that evaluate the synergistic and antagonistic properties of the
bioactive constituents of herbs would aid the development of multicomponent drugs. METHODS MATERIALS _R. coptidis_ (_Coptis chinensis_ Franch.) samples of about 5 years old were obtained
using Good Agricultural Practice from Shizhu county, Chongqing province, China, in October 2010. All of the samples satisfied the standard for _R. coptidis_ in the Chinese Pharmacopoeia and
the Japanese Pharmacopoeia. Reference compounds, including BER, PAL, COP, EPI, JAT and COL were obtained from the National Institutes for Food and Drug Control (NIFDC) (Beijing, China);
their purities were not less than 99.0% by high-performance liquid chromatography (HPLC). _S. dysenteriae_ (CMCC B 51252) was provided by the China Center for Type Culture Collection (Wuhan
University, Wuhan, China). _S. dysenteriae_ is the main pathogen causing dysentery. _R. coptidis_ cures dysentery by inhibiting such pathogens. _S. dysenteriae_ is frequently used to study
the bioactivity of drugs used to treat diarrhea. Luria-Bertani (L.B.) culture medium was used in the bioassay and contained 5 g yeast extract, 5 g sodium chloride and 10 g peptone in 1000 mL
(pH = 7.2–7.4). The culture medium was sterilized at 121°C under 0.1 MPa for 30 min and stored at 4°C until required. Acetonitrile and methanol (chromatographic grade) were purchased from
Fisher Chemicals (Pittsburgh, PA). Water was purified using a Milli-Q Water Purification System (Millipore, Bedford, MA). Silica Gel G preparative thin layer chromatography plates (PTLCP, 20
× 20 cm wide, 1 mm thick) were purchased from Yantai Chemical Industry Research Institute (Shandong, China). All other chemicals were purchased from Beijing Chemical Factory (Beijing,
China) and were of analytical grade. PREPARATION OF THE STANDARD SOLUTIONS AND THE _R. COPTIDIS_ EXTRACT Standard solutions containing BER, PAL, COP, EPI, JAT and COL were prepared by
accurately weighing specific amounts of each substance and dissolving them in methanol in a volumetric flask. The concentrations of the standard solutions were as follows: BER 0.155 mg/mL,
PAL 0.045 mg/mL, COP 0.032 mg/mL, EPI 0.035 mg/mL, JAT 0.016 mg/mL and COL 0.018 mg/mL. The _R. coptidis_ extract was prepared as follows. The herb was first dried at room temperature and
milled into a powder. Then, about 50 g of the powder was transferred to a flask containing 500 mL of purified water and mixed for 30 min. Reflux extraction was performed twice for 1.0 h
each. The resulting solution was filtered while it was still hot and the filtrate was collected. Finally, the filtrate was evaporated to dryness and the solid residue was dried in a
desiccator. CONSTITUENT REMOVING A silica Gel G PTLCP was used to separate and obtain the constituents of _R. coptidis_. The water extract of _R. coptidis_ and standard solutions of BER,
PAL, COP, EPI, JAT and COL were spotted onto the same plate and developed in a mixture of toluene, ethylacetate, methanol, isopropanol and ammonia water (6:3:1.5:1.5:0.5, _v_/_v_). After
observing the plate under daylight, the bands corresponding to the relative retention values of each reference compound were retrieved. These procedures were repeated. Then, the merged
silica chips were extracted with methanol and the suspensions were filtered and centrifuged. The supernatants were collected and evaporated to dryness for further chemical analysis and for
use in bioassays to identify the active constituents in _R. coptidis_. CONSTITUENT ADDING After identifying the bioactive constituents of _R. coptidis_, we applied the added procedure. In
this phase, the active constituents were dissolved in L.B. culture medium to the required concentrations. Then, the dissolved constituent was added into the negative sample (prepared in L.B.
culture medium) without the corresponding constituent. Then, we performed chemical analyses to characterize the constituents. Finally, microcalorimetry was performed to determine the
bioactivity of different amounts of each active constituent to determine their levels in the herbal extract. CHEMICAL ANALYSIS HPLC was performed to determine the levels of the active
constituents in _R. coptidis_ extract, evaluate the changes in the chemical constituents following removing and adding, as follows. HPLC was performed using an Agilent 1200 HPLC system
(Agilent Technologies, Santa Clara, CA). Chromatographic separation and detection of samples were performed on a Kromasil™ C18 column (250 mm × 4.6 mm, 5 μm) at a column temperature of 30°C
with a flow rate of 0.6 mL/min using a solution of acetonitrile/water (0.05 mol/L potassium dihydrogen phosphate) (50:50, _v_/_v_). Then, sodium dodecyl sulfate was added to a concentration
of 0.4 g/100 mL of solution (pH = 4.0). The standard solutions, _R. coptidis_ extract, active constituents obtained by PTLCP separation and the added samples were filtered through a 0.22 μM
Millipore membrane (Carrigtwohill, Co. Cork, Ireland) and injected into the HPLC system for chemical analysis. BIOACTIVITY ASSAY The bioactivity experiments were performed using the ampoule
method at 37°C with a 3114/3236 TAM air isothermal microcalorimeter (Thermometric AB, Jarfalla, Sweden). _S. dysenteriae_ were inoculated into 100 mL of L.B. culture medium at an initial
density of 1 × 10⁶ colony forming units (CFU) per mL. Then, 10 mL of the bacterial suspension was added to sterilized 20-mL glass ampoules. The _R. coptidis_ extract, removed samples and
added samples were then added to the bacterial suspension. Each ampoule was sealed and placed in an eight-channel calorimeter. When the temperature of the ampoules reached 37°C, heat flow
power-time (HFP-_t_) curves were recorded for each sample until the values returned to baseline. Each experiment was repeated three times. All data were continuously recorded using PicoLog
TC-80 software (TA Corporation, New Castle, USA). Microcalorimetry data are repeatable and the method provides real-time, online, dynamic information to characterize the amount of heat
produced by organisms. We measured the following thermokinetic parameters: the growth rate constants of the first and second exponential phases (_k_1 and _k_2), the heat flow power (HFP) of
the first and the second highest peaks (_p_1 and _p_2) and the appearance time of the first and second highest peaks (_t_1 and _t_2) from the HFP-_t_ curves. DATA ANALYSIS Quantitative
thermokinetic parameters were analyzed using Origin 8.5 software (OriginLab Company, Northampton, USA) to plot the HFP-_t_ curves and calculate the thermokinetic parameters. Principal
component analysis (PCA) is a data reduction technique that can be used to extract data, remove redundant information, highlight hidden features and visualize the relationships among
numerous variables with a small number of underlying factors (principal components or PCs) without losing crucial information38. Therefore, we performed PCA to identify the main parameters
derived from the HFP-_t_ curves. We also applied analysis of variance (ANOVA) to test for differences in the bioactivity of different samples and identify the active components. This
procedure calculates whether there is a significant difference between the observed value (i.e., _F_ value) and the corresponding probability (_P_ value). REFERENCES * Cheung, F. TCM: made
in China. Nature 480, S82–S83 (2011). Article CAS ADS Google Scholar * Wang, L. et al. Dissection of mechanisms of Chinese medicinal formula realgar-indigo naturalis as an effective
treatment for promyelocytic leukemia. Proc Natl Acad Sci U. S. A. 12, 4826–4831 (2008). Article ADS Google Scholar * Fan, G. et al. Quality evaluation and species differentiation of
_Rhizoma coptidis_ by using proton nuclear magnetic resonance spectroscopy. Anal. Chim. Acta 747, 76–83 (2012). Article CAS Google Scholar * Wu, H. W., Chen, M. L., Fan, Y. C., Elsebaei,
F. & Zhu, Y. Determination of rutin and quercetin in Chinese herbal medicine by ionic liquid-based pressurized liquid extraction–liquid chromatography–chemiluminescence detection.
Talanta 88, 222–229 (2012). Article CAS Google Scholar * Yan, D., Li, G., Xiao, X. H., Dong, X. P. & Li, Z. L. Direct determination of fourteen underivatized amino acids from
_Whitmania pigra_ by using liquid chromatography–evaporative light scattering detection. Acta J. Chromatogr. A 1138, 301–304 (2007). Article CAS Google Scholar * Inbaraj, B. S., Lu, H.,
Kao, T. H. & Chen, B. H. Simultaneous determination of phenolic acids and flavonoids in _Lycium barbarum_ Linnaeus by HPLC–DAD–ESI-MS. J. Pharmaceut. Biomed. 51, 549–556 (2010). Article
CAS Google Scholar * Grabenauer, M., Krol, W. L., Wiley, J. L. & Thomas, B. F. Analysis of synthetic cannabinoids using high-resolution mass spectrometry and mass defect filtering:
implications for nontargeted screening of designer drugs. Anal. Chem. 84, 5574–5581 (2012). Article CAS Google Scholar * Chen, J. H. et al. Analysis of alkaloids in _Coptis chinensis_
Franch by accelerated solvent extraction combined with ultra performance liquid chromatographic analysis with photodiode array and tandem mass spectrometry detections. Anal. Chim. Acta 613,
184–195 (2008). Article CAS Google Scholar * Luo, J. Y., Yan, D., Yang, M. H., Dong, X. P. & Xiao, X. H. Multicomponent therapeutics of berberine alkaloids. Evid-based Compl. Alt.
10.1155/2013/545898 (2013). * Zhang, A. H., Sun, H. & Wang, X. J. Potentiating therapeutic effects by enhancing synergism based on active constituents from traditional medicine.
Phytother. Res. 10.1002/ptr.5032 (2013). * Rather, M. A., Bhat, B. A. & Qurishi, M. A. Multicomponent phytotherapeutic approach gaining momentum: Is the “one drug to fit all” model
breaking down? Phytomedicine 10.1016/j.phymed.2013.07.015 (2013). * Chinese Pharmacopoeia Commission. COPTIDIS RHIZOMA. Pharmacopoeia of the People's Republic of China Yan, L. (ed.)
127–128 (China Medical Science Press, Beijing, 2011). * Society of Japanese Pharmacopoeia. COPTIDIS RHIZOMA. The Japanese Pharmacopoeia Sixteenth Edition Ritsuo, H. (ed.) 1628–1629 (Ministry
of Health, Labour and Welfare, Tokyo, 2011). * Jiang, Y., David, B., Tu, P. & Barbin, Y. Recent analytical approaches in quality control of traditional Chinese medicines–a review. Anal.
Chim. Acta 657, 9–18 (2010). Article CAS Google Scholar * Qiu, J. Traditional medicine: A culture in the balance. Nature 448, 126–128 (2007). Article CAS ADS Google Scholar * Xue,
T., Roy, R. Studying traditional Chinese medicine. Science 300, 740–741 (2003). Article CAS Google Scholar * Fan, T. P. et al. Future development of global regulations of Chinese herbal
products. J. Ethnopharmacol. 140, 568–586 (2012). Article Google Scholar * Yan, D. et al. Forensic DNA barcoding and bio-response studies of animal horn products used in traditional
medicine. PLoS One 8, e55854 (2013). Article CAS ADS Google Scholar * Lewandoski, M. Conditional control of gene expression in the mouse. Nature Reviews Genetics 2, 743–755 (2001).
Article CAS Google Scholar * Rudolph, U., Crestani, F. & Möhler, H. GABAA receptor subtypes: dissecting their pharmacological functions. Trends Pharmacol. Sci. 22, 188–194 (2001).
Article CAS Google Scholar * Zwaka, T. P. & Thomson, J. A. Homologous recombination in human embryonic stem cells. Nat. Biotechnol. 21, 319–321 (2003). Article CAS Google Scholar *
Manis, J. P. Knock out, knock in, knock down–genetically manipulated mice and the Nobel Prize. N. Engl. J. Med. 357, 2426–2429 (2007). Article CAS Google Scholar * Tong, C., Li, P., Wu,
N. L., Yan, Y. & Ying, Q. L. Production of p53 gene knockout rats by homologous recombination in embryonic stem cells. Nature 467, 211–213 (2010). Article CAS ADS Google Scholar *
Cirak, F. et al. Oscillatory thermomechanical instability of an ultrathin catalyst. Science 300, 1932–1936 (2003). Article CAS ADS Google Scholar * Charlebois, S., Daniels, A. &
Lewis, G. Isothermal microcalorimetry: an analytical technique for assessing the dynamic chemical stability of UHMWPE. Biomaterials 24, 291–296 (2003). Article CAS Google Scholar *
McGuinness, S. M. & Barisas, B. G. Acute toxicity measurements on aquatic pollutants using microcalorimetry on tissue-cultured cells. Environ. Sci. Technol. 25, 1092–1098 (1991). Article
CAS ADS Google Scholar * Critter, S. A., Freitas, S. S. & Airoldi, C. Microcalorimetric measurements of the metabolic activity by bacteria and fungi in some Brazilian soils amended
with different organic matter. Thermochim. Acta 417, 275–281 (2004). Article CAS Google Scholar * Wenzler, T. et al. Isothermal microcalorimetry, a new tool to monitor drug action against
trypanosoma brucei and plasmodium falciparum. PLoS Negl. Trop. Dis. 6, e1668 (2012). Article CAS Google Scholar * Kong, W. J., Wang, J. B., Xiao, X. H., Chen, S. L. & Yang, M. H.
Evaluation of antibacterial effect and mode of _Coptidis Rhizoma_ by microcalorimetry coupled with chemometric techniques. Analyst 137, 216–222 (2012). Article CAS ADS Google Scholar *
Ah, U. V., Wirz, D. & Daniels, A. Isothermal micro calorimetry–a new method for MIC determinations: results for 12 antibiotics and reference strains of _E. coli_ and _S. aureus_. BMC
Microbiol. 9, 106 (2009). Article Google Scholar * Kwon, H., Kwon, Y. J., Kwon, D. Y. & Lee, J. H. Evaluation of antibacterial effects of a combination of _Coptidis Rhizoma_, _Mume
Fructus_ and _Schizandrae Fructus_ against _Salmonella_. Int. J. Food Microbiol. 127, 180–183 (2008). Article Google Scholar * Li, J. X. et al. A quality evaluation strategy for _Rhizoma
coptidis_ from a variety of different sources using chromatographic fingerprinting combined with biological fingerprinting. Chin. Sci. Bull. 58, 4092–4100 (2013). Article CAS Google
Scholar * Furustrand, T. U. et al. Isothermal microcalorimetry: a novel method for real-time determination of antifungal susceptibility of _Aspergillus_ species. Clin. Microbiol. Infec. 18,
241–245 (2012). Article Google Scholar * Jung, W. C. et al. Anti-diarrheal effects of a combination of Korean traditional herbal extracts and dioctahedral smectite on piglet diarrhea
caused by _Escherichia coli_ and _Salmonella typhimurium_. Pak. Vet. J. 31, 336–340 (2011). Google Scholar * Wei, Y., Xie, Q. Q., Dong, W. T. & Ito, Y . Separation of epigallocatechin
and flavonoids from _Hypericum perforatum_ L. by high-speed counter-current chromatography and preparative high-performance liquid chromatography. J. Chromatogr. A 1216, 4313–4318 (2009).
Article CAS Google Scholar * Guo, Y. X., Zhou, L. L., Li, T. & Wang, L. H. Preparative separation of lithospermic acid B from _Salvia miltiorrhiza_ by polyamide resin and preparative
high-performance liquid chromatography. J. Chromatogr. A 1218, 4606–4611 (2011). Article CAS Google Scholar * Huang, X. Y., Fu, J. F. & Di, D. L. Preparative isolation and
purification of steviol glycosides from _Stevia rebaudiana_ Bertoni using high-speed counter-current chromatography. Sep. Purif. Technol. 71, 220–224 (2010). Article CAS Google Scholar *
Bruce, S. J. et al. Investigation of human blood plasma sample preparation for performing metabolomics using ultrahigh performance liquid chromatography/mass spectrometry. Anal. Chem. 81,
3285–3296 (2009). Article CAS Google Scholar Download references ACKNOWLEDGEMENTS This study was supported by the National Natural Science Foundation of China (Grant No. 81274078,
81322052, 81073043 and 81303222), China Postdoctoral Science Foundation (Grant No. 2013M532130) and the Open Research Fund of the State Key Laboratory Breeding Base of Systematic Research,
Development and Utilization of Chinese Medicinal Resources. The funding sources were not involved in study design, data collection or analysis, writing of the manuscript or the decision to
publish the results. AUTHOR INFORMATION Author notes * Yan Dan, Li Junxian and Xiong Yin contributed equally to this work. AUTHORS AND AFFILIATIONS * China Military Institute of Chinese
Materia Medica, Military 302 Hospital, Beijing, 100039, China Dan Yan, Junxian Li, Yin Xiong, Congen Zhang, Ruiling Wang, Cheng Jin, Jiangyu Li, Lingling Qiu, Xueai Song & Xiaohe Xiao *
National Center of Biomedical Analysis, Beijing, 100850, China Dan Yan * College of Traditional Chinese Pharmacy, Beijing University of Chinese Medicine, Beijing, 100102, China Yin Xiong *
Institute of Medicinal Plant Development, Chinese Academy of Medical Sciences, Beijing, 100094, China Jiaoyang Luo & Yuling Lin * Beijing Physical Examination Center, Beijing, 100077,
China Yumei Han & Hong Qian * Chengdu University of Traditional Chinese Medicine, Chengdu, 610075, China Cheng Peng Authors * Dan Yan View author publications You can also search for
this author inPubMed Google Scholar * Junxian Li View author publications You can also search for this author inPubMed Google Scholar * Yin Xiong View author publications You can also search
for this author inPubMed Google Scholar * Congen Zhang View author publications You can also search for this author inPubMed Google Scholar * Jiaoyang Luo View author publications You can
also search for this author inPubMed Google Scholar * Yumei Han View author publications You can also search for this author inPubMed Google Scholar * Ruiling Wang View author publications
You can also search for this author inPubMed Google Scholar * Cheng Jin View author publications You can also search for this author inPubMed Google Scholar * Hong Qian View author
publications You can also search for this author inPubMed Google Scholar * Jiangyu Li View author publications You can also search for this author inPubMed Google Scholar * Lingling Qiu View
author publications You can also search for this author inPubMed Google Scholar * Cheng Peng View author publications You can also search for this author inPubMed Google Scholar * Yuling
Lin View author publications You can also search for this author inPubMed Google Scholar * Xueai Song View author publications You can also search for this author inPubMed Google Scholar *
Xiaohe Xiao View author publications You can also search for this author inPubMed Google Scholar CONTRIBUTIONS D.Y., J.L. and C.Z. conducted the experiments. D.Y., J.L. and Y.X. wrote the
manuscript and prepared figures. J.L., Y.H., H.Q. and L.Q. conducted sample collection and data analysis. C.P., X.S., J.L., R.W., C.J. and Y.L. provide materials and data. D.Y. and X.X.
conceived the study. All authors reviewed the manuscript. ETHICS DECLARATIONS COMPETING INTERESTS The authors declare no competing financial interests. ELECTRONIC SUPPLEMENTARY MATERIAL
SUPPLEMENTARY INFORMATION Supporting Information RIGHTS AND PERMISSIONS This work is licensed under a Creative Commons Attribution 3.0 Unported License. To view a copy of this license, visit
http://creativecommons.org/licenses/by/3.0/ Reprints and permissions ABOUT THIS ARTICLE CITE THIS ARTICLE Yan, D., Li, J., Xiong, Y. _et al._ Promotion of quality standard of herbal
medicine by constituent removing and adding. _Sci Rep_ 4, 3668 (2014). https://doi.org/10.1038/srep03668 Download citation * Received: 09 July 2013 * Accepted: 11 December 2013 * Published:
13 January 2014 * DOI: https://doi.org/10.1038/srep03668 SHARE THIS ARTICLE Anyone you share the following link with will be able to read this content: Get shareable link Sorry, a shareable
link is not currently available for this article. Copy to clipboard Provided by the Springer Nature SharedIt content-sharing initiative