- Select a language for the TTS:
- UK English Female
- UK English Male
- US English Female
- US English Male
- Australian Female
- Australian Male
- Language selected: (auto detect) - EN
Play all audios:
Owing to the variety of possible charge and spin states and to the different ways of coupling to the environment, paramagnetic centres in wide band-gap semiconductors and insulators exhibit
a strikingly rich spectrum of properties and functionalities, exploited in commercial light emitters and proposed for applications in quantum information. Here we demonstrate, by combining
synchrotron techniques with magnetic, optical and ab initio studies, that the codoping of GaN:Mn with Mg allows to control the Mnn+ charge and spin state in the range 3≤n≤5 and 2≥S≥1.
According to our results, this outstanding degree of tunability arises from the formation of hitherto concealed cation complexes Mn-Mgk, where the number of ligands k is pre-defined by
fabrication conditions. The properties of these complexes allow to extend towards the infrared the already remarkable optical capabilities of nitrides, open to solotronics functionalities
and generally represent a fresh perspective for magnetic semiconductors.
Group III nitrides currently dominate the field of visible and ultraviolet photonics, due to the flexibility of gap engineering, to the availability of both n- and p-type material, to their
high thermal stability and large heat conductivity (ref. 1 and references therein). Moreover, recent studies of magnetically doped semiconductors2,3,4,5 and oxides6,7 have pointed out how
crucial is the spatial distribution of dopants in the host matrix. In particular, the aggregation of magnetic impurities resulting at the nanoscale in the formation of chemical and/or
crystallographic inhomogeneities has a dramatic influence on the magnetic, electronic and optical properties of the systems. The possibility to reach a control over the formation, structure,
arrangement and effect of inhomogeneities on the chemical and physical behavior of the host material, can be envisaged to have outstanding consequences in the design and functionality of
the next generation of devices. The manipulation of the charge-state of paramagnetic centres in wide band gap semiconductors by modifying the local electric field with a gate voltage8 or
chemically by changing the termination of the surface9, has already been reported.
Here, we demonstrate the efficiency of an alternative approach based on the controlled formation of complexes, involving one magnetic impurity and one or more electrically active dopant.
Peculiar arrangements in the electronic structure of simple paramagnetic complexes have previously been theoretically investigated10. With synchrotron radiation methods supported by ab
initio computations, we show that codoping of GaN with Mn and Mg results in the formation of cation complexes Mn–Mgk. Depending on the number of ligands k predefined by fabrication
conditions, a strong electron-phonon interaction and consequently an efficient and broadband infrared (IR) photoluminescence (PL) are promoted. Furthermore, we find that the Mn–Mgk cation
complexes allow to control the charge and spin states of the transition metal (TM) ions, with prospective implications in the design of the coupling between localized spins in magnetic
semiconductors and in the optimisation of centres for solotronic applications11.
The samples studied are single-crystal GaN layers, codoped with Mn and Mg, each with concentrations lower than 1%. Their fabrication, architecture and preliminary characterisation are
summarised in the Methods. Aware that the incorporation of interstitial hydrogen forming complexes with Mg is a recurrent challenge associated with Mg-doping of GaN, we have performed a
careful chemical analysis, detailed in the Supplementary Figure S1, showing that in our case we can reasonably neglect the effect of interstitial hydrogen.
Having established the single crystallinity and chemical homogeneity of the samples via a spectrum of both local and averaging characterisation techniques, we discuss the lattice positions
of Mn and Mg impurities in GaN, as determined from extended x-ray absorption fine structure (EXAFS) measurements at the Mn K-edge and by ab initio computations. We find that within a
confidence of 90% the Mn ions occupy exclusively Ga-substitutional positions. This result is consistent with the ab initio computations reported in the Supplementary Table S1 showing that
the energy required to place a Mn or Mg ion in either octahedral or tetrahedral interstitial positions of GaN is more than 4 eV higher than the one needed to incorporate it in a
Ga-substitutional site.
According to our previous EXAFS and electron energy loss spectroscopy (EELS) results, Mn is randomly and homogeneously distributed in GaN:Mn, at least up to a Mn concentration of 3% (refs.
12,13). While in the conventional treatment of dilute magnetic semiconductors, the spatial distributions of co-dopants and TM ions are assumed to be uncorrelated, a quantitative analysis of
our EXAFS data points to a substantial correlation between the positions occupied by Mn and Mg in the host lattice. Simulations of EXAFS spectra for a large variety of relaxed defects in GaN
were performed and reported in the Supplementary Information and indicate that the combination of substitutional Mn and Mg is the most likely to account for the experimental EXAFS data. The
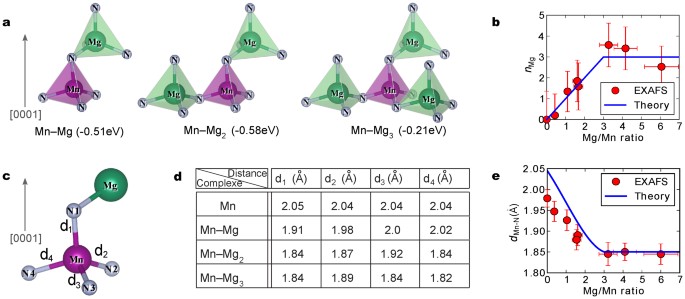
experimental EXAFS spectra are then fitted, according to the procedure described in the Supplementary Information. As shown in Fig. 1b, the number of substitutional Mg atoms (nMg) in the
first cation coordination sphere of Mn increases linearly with the ratio between the Mg and Mn concentrations, y = xMg/xMn, up to y = 3 and then saturates at higher y values. Simultaneously,
the average distance beween Mn and the nearest neighbour N atoms dMn–N diminishes in range up to y = 3 and then levels off, as seen in Fig. 1e. The experimental EXAFS spectra from which
dMn–N and nMg are extracted are plotted in Supplementary Figure S4 for different values of y. It is possible to confirm the correlation between the Mn and Mg positions by comparing the
spectra for y > 0 (correlated) and y = 0, the latter being strictly equivalent to the not correlated case where Mn does not interact with any Mg atom.
Mn–Mgk complexes predicted by theory and experimental demonstration by EXAFS.
(a) most stable Mn–Mgk complexes (k = 1,2 and 3) and their pairing energies – computed by DFT within the GGA+U approximation – relatively to the previous Mn-Mgk–1 complex. A gray arrow
indicates the [0001] direction, i.e. the GaN c-axis; (b) number of Mg atoms seen by Mn in the first cation coordination sphere (nMg), extracted from EXAFS measurements and DFT predictions;
(c) schematic representation of a Mn–Mg complex; (d) detailed values of the bond lengths for different complexes, calculated by DFT; (e) average Mn-N bond length (dMn–N) as a function of the
Mg/Mn ratio, from EXAFS analysis and DFT calculations.
These results can be explained by our ab initio computations. In particular, the estimated values of the pairing energies Ep shown in Fig. 1a for up to three Mg per Mn are all negative,
demonstrating the tendency of Mg to form the Mn-Mgk complexes sketched in Fig. 1a and in Supplementary Figure S8. Taking into account the statistical distribution of k, implying that some of
these complexes can coexist at a given y, we have obtained with no adjustable parameters a remarkable agreement between the experimental and computed trends, describing how the number of
bound Mg atoms (Fig. 1b) and the shortening of the bond length (Fig. 1c,d,e) depend on y. This agreement with the theory based on the statistical distribution of the complexes populations
detailed in the Methods implies a comparable stability of the complexes with different k, up to k = 3. According to the DFT calculations and as reported in Fig. 1a, a similar binding energy
(0.5 eV) is indeed computed for Mn-Mg and Mn-Mg2 but a lower value (0.2 eV) is expected for Mn-Mg3. If these DFT predictions are quantitatively correct, we may await a concentration of
Mn-Mg3 complexes somewhat lower than the one resulting from P3(y) for y 1, extra holes would be directed to the valence band, increasing the p-type conductivity. However, layers containing a
small concentration of Mg (y 2. According to Fig. 4b, the PL intensity increases with the concentration of the Mn-Mg3 complexes P3(y) = (y/3)3, demonstrating that Mn5+, in presumably two
slightly different environments, accounts for the photoluminescence in GaN:(Mn,Mg).
(a) evolution of the PL spectra (excited with a 442 nm (2.8 eV) laser) as a function of the y ratio, measured at 2 K (a multiplying factor of 1.4 has been applied between consecutive spectra
for clarity); (b) integrated PL intensity normalized by the Mn concentration and sample thickness as a function of the y ratio (red circles, left scale) and evolution of the fraction of
different complexes, calculated as a function of y (lines, right scale); (c) evolution of the PL spectra with temperature, for a sample with y = 4.1; the background at 296 K is also
included. A factor of 1.4 has been applied between consecutive spectra for clarity. (d) evolution of the integrated PL intensity as a function of the inverse temperature, normalized to the
value at T = 5 K; the line is a guide for the eye. Inset: levels relevant to PL as discussed in the Supplementary Information.
Importantly, as one sees in Fig 4c and d, the spectrally broad infrared emission persists up to room temperature and is very attractive for ultrashort pulse generation as well as for wide
infrared tunability.
In order to understand the photoluminescence related to Mn–Mgk cation complexes, it is necessary to consider first the reason of the poor luminescence of Mn3+ in GaN. In contrast to Cr2+ in
Al2O3 and ZnSe, Mn3+ in GaN does not show the strong and application-relevant red or infrared emission associated with optical transitions between the 5E and 5T2 crystal field multiplets of
the 3d4 shell. This surprising result is however in agreement with previous extensive studies of GaN:Mn (refs 23, 24, 25, 26), in which the intra-centre photoluminescence of Mn3+ was found
to be hardly detectable. This puzzling result can be traced back to an abnormally small value of the Huang-Rhys factor implied by optical absorption24,27, this observation being
interpreted19 in terms of a strong p-d coupling in GaN:Mn, leading to a significant admixture of anion t2 orbitals with the wave functions of the 5E and 5T2 states. Such delocalization of
the centre wave function, clearly visible in Fig. 2c, reduces the electron-phonon coupling. As a result, the oscillator strength is shifted to the zero-phonon line at the expense of the
phonon-assisted transitions that cease to constitute the channel for PL excitation.
On the other hand, highly efficient and Stokes shifted PL, similar to the one presented in Fig. 4, was found for GaN:(Mn,Mg) and assigned to intra Mn4+ transitions26,28,29. However, we have
demonstrated here that following the evolution of the PL as a function of the different populations of complexes (Fig. 4b), the Mn5+ present in the complexes are likely to be at the origin
of the infrared PL signal. This assignment is consistent with the shape of the PL spectrum in a 10 T magnetic field – given in the Supplementary Figure S7 – which can be described by a
splitting of the ground state into three components. This splitting is expected for S = 1, as observed previously30 for V3+ in AlN.
In order to explain the origin of the PL activation upon codoping with Mg evidenced in Fig. 4a, we refer to Fig. 2d–f where the variations in the local spin densities brought about by the
binding of an increasing number of Mg ions are shown. According to these data, the complexing with one Mg ion enhances the delocalization of the spin density over neighbouring N anions.
However, with the binding of two and then three Mg ions, the delocalization of the spin density decreases. Accordingly, a strong electron-phonon coupling and, thus, a large magnitude of SHR
is restored, particularly for Mn–Mg3 complexes, where two d electrons reside in the e orbitals of the 3A2 ground state.
This IR broadband PL promoted by Mn–Mgk cation complexes is of high relevance in e.g. laser and telecommunication technologies. Actually, in comparison with Al2O3 and ZnSe, GaN has
respectively seven and twelve times better thermal conductivity, lessening thermal effects even for high laser powers and intensities.
We conclude that the data presented here indicate a new way to manipulate the charge and spin state of single paramagnetic centres by complexing a magnetic impurity with electrical dopants.
The demonstration of these new degrees of freedom opens wide prospects illustrated here by the infrared emission of GaN:(Mn,Mg). Another line of research is to explore the potential of these
Mn–Mgk cation complexes for mediating the coupling between localized spins in magnetic semiconductors. Furthermore, these centres may serve for storing and manipulating information in a
single qubit or for single photon generation11. Interestingly, unlike the case of CdTe:Mn (ref. 31) or InAs:Mn (ref. 32), it is not necessary to place GaN:(Mn,Mg) in a quantum dot, as Mn in
GaN can bind the exciton33 needed to read or write information. The possibility to change energy level splitting, excitation channel and excited state lifetime by manipulating the Mn charge
and spin state through Mn–Mgk cation complexes offers a not yet explored spectrum of opportunities for further investigations.
The samples consist of single crystal wurtzite (wz) GaN codoped with Mn and Mg grown by metalorganic vapor phase epitaxy (MOVPE) on a 1 µm GaN buffer layer on c-plane sapphire, according to
the procedure described elsewhere12,13. The doped layer is 600 nm thick. The samples are grown under H2 atmosphere, with a pressure of 200 mbar and a temperature of 850°C. The precursors
used are ammonia (NH3) for nitrogen, trimethylgallium (TMGa) for Ga, dicyclopentadienyl-magnesium (Cp2Mg) for Mg and dicyclopentadienyl-manganese (Cp2Mn) for Mn. The source flow of ammonia
was kept constant at 1500 sccm, the TMGa at 5 sccm and Cp2Mg was varied between 150 and 450 sccm as Cp2Mn was varied between 75 and 490 sccm. The Mn and Mg concentrations considered in this
work are both between 0 and 1% as measured by secondary ion mass spectroscopy (SIMS). The absence of parasitic elements like hydrogen or oxygen has been carefully checked with SIMS, energy
dispersive x-ray spectropscopy (EDX), Raman spectropscopy and electron energy loss spectroscopy (EELS). Prior to the extensive synchrotron investigations by EXAFS and XES, the structure of
the layers has been characterised by high-resolution x-ray diffraction (HRXRD) on a X'Pert PRO MRD system with a dynamics as high as 107 between the GaN (002) peak and the noise. In
addition, high-resolution transmission electron microscopy (HRTEM) was performed on a JEOL 2011 Fast TEM microscope operating at 200 kV and capable of an ultimate point-to-point resolution
of 0.19 nm and allowing to image lattice fringes with a 0.14-nm resolution. The combination of the two techniques has allowed us to rule out the presence of precipitation in the layers.
EXAFS spectroscopy has been carried out at the BM08–GILDA Italian beamline34 at the ESRF (Grenoble, France). The Mn K edge x-ray absorption spectra have been acquired using a monochromator
equipped with a pair of Si(311) crystals and run in dynamical focusing mode. Harmonics rejection is achieved through a pair of Pd-coated mirrors and the monochromator de-tuning. The data are
collected in the fluorescence mode using a 13-element hyperpure Ge detector and normalized by the incoming flux measured with an ion chamber. The incident beam is at 55.7° in respect to the
sample surface to avoid dichroic effects. The samples are cooled down to liquid nitrogen temperature. The counting time and the number of scans for each sample have been chosen in order to
collect at least 106 counts per point. The EXAFS signal, χ(k), is extracted from the absorption data, µ(E), using a smoothing spline algorithm (as implemented in the viper program) and
choosing the energy edge, E0, at the maximum of the derivative. The data analysis is detailed in the Supplementary Information.
Non resonant XES has been measured at the ID26 beamline of the ESRF35. The optics for the incoming beam consists of three coupled undulators, a double Si crystal monochromator and three Si
coated mirrors working at 2.5 mrad incidence for harmonics rejection and beam focusing. The emission spectrometer is run in a vertical Rowland geometry with five Si(110) analyzer crystals
working at the (440) reflection, that is, around a Bragg angle of 84.2°. The spectrometer energy broadening is approximately 0.9 eV at Mn K-edge (6539 eV). The experimental geometry consists
of the spectrometer and the incoming beam at 90° on the same scattering plane (to minimize the elastic contribution) with the sample surface placed vertically to this plane and at 55.7°
incidence angle, that is, the magic angle for wurtzite symmetry in order to avoid dichroism effects due to the linearly polarized beam36. All the samples are measured at room temperature and
are tested against radiation damage. The emitted fluorescence is scanned around the Mn Kβ main line with the incoming excitation at 6700 eV. The quantitative data analysis is based on the
integrated absolute values of the difference spectra (IAD) and is performed as a function of the Mg/Mn concentration ratio, y. The data have been calibrated by the IAD values obtained from
commercial Mn-oxides powders, assuming the ionic approximation and considering the high-spin scenario for both systems. The details of the analysis are reported in the Supplementary
Information.
The magnetic anisotropy energy density has been assessed by integrating the area between the magnetization curves measured along easy (H ⊥ c) and hard (H || c) directions and expressed as
energy per one Mn atom in the given layer. Magnetization curves are measured at 1.85 K using a superconductor quantum interference device (SQUID), as described previously12,13. The size of
the error bars for the anisotropy is determined mostly by the errors related to the inaccuracy of substrate signal compensation and do not include the uncertainty generated by the
insufficient strength of the magnetic field to saturate M for hard direction in our SQUID magnetometer (50 kOe).
Photoluminescence is excited with a continuous wave 404 nm (3.1 eV) or 442 nm (2.8 eV) laser with the excitation power up to tens of mW. The temperature has been varied in the range between
2 K and 296 K. An InGaAs type CCD camera coupled to a grating (either 300 grooves/mm or 1200 grooves/mm) monochromator is used as detector. A long wavelength pass filter is placed at the
entrance of the monochromator for cutting off the stray laser light. The detection is carried out in the range from 0.7 eV to 1.5 eV with a spectral resolution of 0.5 meV. The integration of
the PL signal in Fig. 4b and 4d has been performed between 900 meV and 1100 meV. The magnetooptical measurements reported in the Supplementary Information are performed in Faraday
configuration (B || k) using a cryostat equipped with a superconducting coil providing a magnetic field up to 10 T.
Calculations for Mn-Mgk complexes in wz-GaN are performed within the GGA+U approximation using the Quantum Espresso code37. A 96-atoms supercell and a 3×3×3 Monkhorst-Pack grid for Brillouin
zone sampling are employed. The pairing energies are calculated from the following formula: ΔE = Etot(MnGa47–kN48 : Mgk + Ga48N48) − Etot(MnGa47–k+1N48 : Mgk–1+Ga47N48 : Mg), for k ranging
from 1 to 5. From the computed values of the magnetic moment and from the Mn–N distance of every possible complexes, one can obtain, taking into account the relative statistical weight Pk(y)
of particular Mn–Mgk configurations, the average variation of these values as a function of the Mg/Mn ratio. The values of these Pk(y) are then approximated with a binomial law, considering
that if Mn can bind up to m Mg atoms (m = 3 in our case), the occurrence probability Pk(y) of particular complexes Mn-Mgk, at a given ratio of the Mg to Mn concentration y, is given by the
binomial distribution, for y ≤ m, whereas for y > m, Pm(y) = 1 and Pk(y) = 0 for k < m. The computed values of the local magnetic moment on MnGa and its nearest neighbouring N atoms as well
as its magnitude in the Mn unit cell are collected in the Supplementary Table S2, whereas the contour plot of the spin polarization is shown in Fig. 2c.
The work was supported by the European Research Council through the FunDMS Advanced Grant (#227690) within the “Ideas” 7th Framework Programme of the EC, by the European Regional Found
through grants Innovative Economy Operational Programme 2007–2013 (InTechFun: POIG.01.03.01-00-159/08), by the Austrian Fonds zur Förderung der wissenschaftlichen Forschung – FWF (P18942,
P20065 and P22477) and by the Polish NCBiR project LIDER. We also acknowledge the European Synchrotron Radiation Facility for provision of synchrotron radiation facilities (proposals HE3609
and HS4035), as well as the Interdisciplinary Center of Modeling at the University of Warsaw and the High Performance Computing Center at Texas Southern University for the access to computer
facilities.
Institut für Halbleiter und Festkörperphysik, Johannes Kepler University, Altenbergerstr. 69, Linz, A-4040, Austria
Thibaut Devillers, Andreas Grois, Andrea Navarro-Quezada, Bogdan Faina, Tian Li & Alberta Bonanni
European Synchrotron Radiation Facility, 6 rue Jules Horowitz, Grenoble, F-38043, France
Institute of Theoretical Physics, Faculty of Physics, University of Warsaw, ul. Hoża 69, Warszawa, PL-00-681, Poland
Institute of Physics, Polish Academy of Sciences, al. Lotników 32/46, Warszawa, PL-02-668, Poland
Sylwia Dobkowska, Wiktor Stefanowicz, Dariusz Sztenkiel, Rafał Jakieła, Maciej Sawicki & Tomasz Dietl
Institute of Experimental Physics, Faculty of Physics, University of Warsaw, ul. Hoża 69, Warszawa, PL-00-681, Poland
Consiglio Nazionale delle Ricerche, IOM-OGG, BP 220, c/o ESRF GILDA CRG, F-38043, Grenoble, France
ThD, under the supervision of AB, initiated the work, fabricated the layers and analyzed the data. MR collected and analyzed XES and XAS spectra under the supervision of PG and FdA,
respectively. NGS carried out ab initio computations with the assistance of MR, TD and JAM. Under the supervision of AB, JS and AG carried out optical measurements; TL performed HRTEM; ANQ
measured HRXRD; BF did the electrical characterisation; RJ analyzed the samples with SIMS; SD, WS and MS performed the magnetic studies analyzed by DS and TD. AB, TD and ThD wrote the
manuscript with inputs from all authors.
This work is licensed under a Creative Commons Attribution-NonCommercial-No Derivative Works 3.0 Unported License. To view a copy of this license, visit
http://creativecommons.org/licenses/by-nc-nd/3.0/
Anyone you share the following link with will be able to read this content: