- Select a language for the TTS:
- UK English Female
- UK English Male
- US English Female
- US English Male
- Australian Female
- Australian Male
- Language selected: (auto detect) - EN
Play all audios:
Send your letters to the Editor, _British Dental Journal_, 64 Wimpole Street, London, W1G 8YS. [email protected]. Priority will be given to letters less than 500 words long. Authors must sign the
letter, which may be edited for reasons of space. Sir, in 2017, I was approached by the British Society of Paediatric Dentistry (BSPD) to see if I could use the most recent FP17 data from
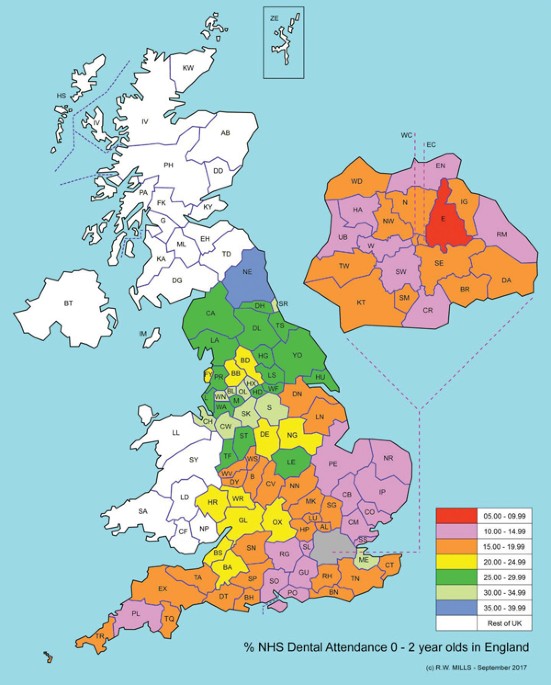
NHS Digital to construct a map showing the percentage of children (0-2 years) within each Local Authority (LA) that attended an NHS practitioner in primary care in England. The NHS Digital
data were based on local authorities (LAs) and these are sadly not coterminous with postal areas. This makes map construction based on postal areas quite complex, although less cluttered on
an A4 sheet. The map shown in Figure 1 represents the distribution of this data according to the postal area. The BSPD request arose from the publication of a previous map showing the number
of specialists in paediatric dentistry registered in each postal area.1 This first map highlighted a potential workforce issue with a noticeable shortage of specialists in some areas, while
this map highlights attendance. There appears to be a north/south divide on the attendance map and it is potentially useful as a datum to be compared with future maps following the recent
launch of Starting Well, Smile4Life and the Dental Check by 1 (DCby1) initiatives. A north/south divide was also coincidentally highlighted in a recent joint report by Appleby _et al_. in
November 2017 produced by The Health Foundation and The Nuffield Trust.2 Their findings told of poorer oral health in the north. The north/south divide in both the map and the report are
interesting and there will many hypotheses to explain them. These attendance figures, in any case, appear to raise a significant safeguarding issue. Let us hope that our legislators take
note. REFERENCES * Mills R W . Workforce planning: The specialist map. _Br Dent J_ 2016; 220: 221. Article Google Scholar * QualityWatch. Root causes. Quality and inequality in dental
health. Briefing. November 2017. Available at: http://www.qualitywatch.org.uk/sites/files/qualitywatch/field/field_document/QW%20dentistry%20briefing_WEB.pdf (accessed February 2018).
Download references AUTHOR INFORMATION AUTHORS AND AFFILIATIONS * Devizes R. W. Mills Authors * R. W. Mills View author publications You can also search for this author inPubMed Google
Scholar RIGHTS AND PERMISSIONS Reprints and permissions ABOUT THIS ARTICLE CITE THIS ARTICLE Mills, R. Paediatric dentistry: North/south divide. _Br Dent J_ 224, 199 (2018).
https://doi.org/10.1038/sj.bdj.2018.134 Download citation * Published: 23 February 2018 * Issue Date: 23 February 2018 * DOI: https://doi.org/10.1038/sj.bdj.2018.134 SHARE THIS ARTICLE
Anyone you share the following link with will be able to read this content: Get shareable link Sorry, a shareable link is not currently available for this article. Copy to clipboard Provided
by the Springer Nature SharedIt content-sharing initiative