- Select a language for the TTS:
- UK English Female
- UK English Male
- US English Female
- US English Male
- Australian Female
- Australian Male
- Language selected: (auto detect) - EN
Play all audios:
ABSTRACT Genetic analyses, including genome-wide association studies and whole exome sequencing (WES), provide powerful tools for the analysis of complex and rare genetic diseases. To date
there are no reference data for Aboriginal Australians to underpin the translation of health-based genomic research. Here we provide a catalogue of variants called after sequencing the
exomes of 72 Aboriginal individuals to a depth of 20X coverage in ∼80% of the sequenced nucleotides. We determined 320,976 single nucleotide variants (SNVs) and 47,313 insertions/deletions
using the Genome Analysis Toolkit. We had previously genotyped a subset of the Aboriginal individuals (70/72) using the Illumina Omni2.5 BeadChip platform and found ~99% concordance at
overlapping sites, which suggests high quality genotyping. Finally, we compared our SNVs to six publicly available variant databases, such as dbSNP and the Exome Sequencing Project, and
70,115 of our SNVs did not overlap any of the single nucleotide polymorphic sites in all the databases. Our data set provides a useful reference point for genomic studies on Aboriginal
Australians. Design Type(s) Whole Exome Sequencing • Genetic Population Study • genotyping by array design Measurement Type(s) genetic sequence variation analysis Technology Type(s) exome
sequencing Factor Type(s) Sample Characteristic(s) Homo sapiens • saliva • Western Desert Machine-accessible metadata file describing the reported data (ISA-Tab format) SIMILAR CONTENT
BEING VIEWED BY OTHERS GENOTYPING, SEQUENCING AND ANALYSIS OF 140,000 ADULTS FROM MEXICO CITY Article Open access 11 October 2023 A GENOMICS ENGLAND HAPLOTYPE REFERENCE PANEL AND IMPUTATION
OF UK BIOBANK Article Open access 12 August 2024 WHOLE-GENOME SEQUENCING OF 1,171 ELDERLY ADMIXED INDIVIDUALS FROM BRAZIL Article Open access 04 March 2022 BACKGROUND & SUMMARY Whole
exome sequencing (WES) is a powerful and cost-effective tool1 that has been employed successfully to identify causative mutations in patients affected by rare genetic diseases2,3. WES
enables the detection of rare sequence variants specific to an individual as well as common variants that are endemic to a specific population. As there are no reference data for Aboriginal
Australians to underpin the translation of health-based genomic research, we conducted a study in partnership with an Aboriginal population living at the edge of the Western Desert in
Western Australia. We present a summary of the data here to be used as a reference panel to aid in the diagnosis of rare diseases and other health-based research in Aboriginal Australians.
We recently published the first Genome-Wide Association Study (GWAS) for body mass index (BMI) and type 2 diabetes (T2D) undertaken in an Aboriginal Australian population4. As part of the
GWAS, we genotyped 402 individuals (195 of pure Martu ethnicity) using the Illumina Omni2.5 BeadChip platform. However, the design of the chip is based on single nucleotide polymorphisms
(SNPs) previously identified in the HapMap5 and 1,000 Genomes6 projects, which do not include ethnically diverse groups such as the Aboriginal Australians. While the chip genotyping
information is useful as a baseline to compare allele frequencies for known variants in this Aboriginal Australian sample, novel variants cannot be identified and genotyped. In continuing
work, we have carried out WES on a subset of individuals (70/402) from our GWAS study and two additional individuals (a total of 72) in order to identify variants that may be associated with
extreme phenotypes for BMI, renal disease, and otitis media. We processed the exome data using the Genome Analysis Toolkit (GATK) and by following their best practices guide (see Methods).
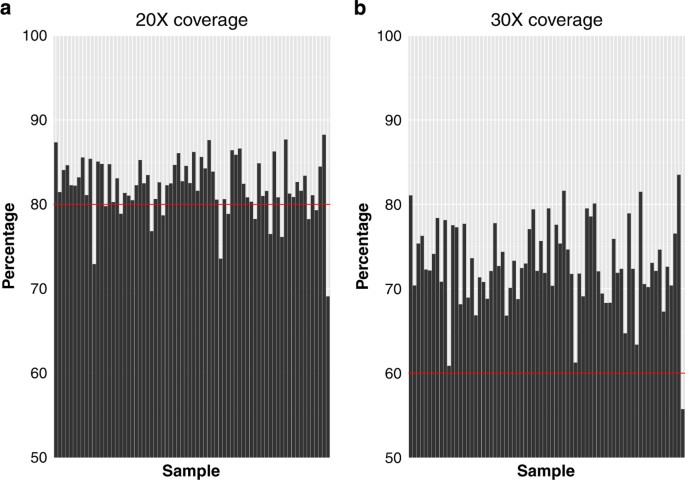
Almost 80% of the sequenced bases in all the samples had a sequence depth of 20X coverage and around 60% had a sequence depth of 30X coverage (Fig. 1). Furthermore, we called a total of
320,976 single nucleotide variants (SNVs) and 47,313 insertions/deletions (indels) observed in at least one of the 72 sequenced exomes. A visual summary of a subset of the variants is shown
in Fig. 2. A comparison of our SNVs to SNPs recorded in the HapMap5, ESP7, ExAC8, dbSNP9, 1,000 Genomes10, and UK10K11 databases revealed that around 30% to 70% of our SNVs are recorded in
these databases (Table 1). Our SNVs constituted the highest percentage of the ESP database (5%) (Table 1), which is expected as the ESP database contains variants determined using exome
sequencing. Furthermore, 70,115 of our 320,976 SNVs (21.8%) have not been previously reported in any of these six databases. As recently reported, while most common variants are shared
across the entire population, rare variants are typically restricted to closely related populations10. However, these unrecorded SNVs may also represent false positives, such as variants
incorrectly inferred from sequencing or technical artefacts. We used the calibrated probabilities (VQSLOD) calculated using the Variant Quality Score Recalibration (VQSR) step in the GATK
pipeline to gain an idea of the quality of these SNVs. Briefly, the VQSR step trains a model based on the variant annotations of known and high-quality variants in the dataset and compares
unknown variants to these models, assigning a confidence score to each putative variant call. 61,212/70,115 (87.3%) of the previously unrecorded SNVs have a passing confidence score,
providing confidence that these SNVs are true positives. The genomic location and effect of our sequence variants with respect to protein coding genes in the RefSeq database was annotated
using ANNOVAR12 (Fig. 3). The majority of our variants were located within introns, the 3' untranslated region (3' UTR), and exons. While the exome capture protocol mainly targets
exonic regions, many of the captured DNA fragments will still fall outside of the targeted regions. We used a 100 bp padding on the targeted regions in our GATK pipeline, thereby allowing
variants to be called outside of exonic regions. Intronic and 3' UTRs make up the majority of a protein coding gene, which is reflected by the number of our variants that fall within
these regions. The variants that were within exonic regions were further characterised by their functional effect on protein coding genes. The majority of the sequence variants either caused
a non-synonymous or synonymous mutation. While it may be expected that there should be more synonymous than non-synonymous mutations, we observed the same distribution when we annotated the
UK10K and ESP6500 variants. The larger number of non-synonymous mutations is mainly caused by sequence variants that have a very low frequency in the population. METHODS STUDY POPULATION
Subjects were recruited from an Aboriginal Australian community of Martu ancestry13,14 at the edge of the Western Desert in Western Australia as previously described4. The individuals belong
to a small number of inter-related extended pedigrees and different subsets of these individuals have been diagnosed with type 2 diabetes (T2D) and/or obesity (according to their BMI). CHIP
GENOTYPING 402 individuals were genotyped on the Illumina Omni2.5 BeadChip, which profiles 2,450,000 SNPs that were selected based on SNPs identified in the HapMap and 1,000 Genomes
project. We converted the PED and MAP files into the Variant Call Format (VCF) using PLINK 1.9 (ref. 15) and hg18 coordinates were converted to hg19 coordinates using the liftOver tool16 and
a custom Perl script (see Code availability). To ensure compatibility with the exome genotypes, we modified the REF and ALT fields (and accordingly, the genotypes) in the VCF file, such
that the bases of a SNP were always on the positive strand with respect to the reference genome and the major allele was the allele present at position POS on the positive strand of the hg19
reference genome. The strandedness of the SNPs were obtained online17 and a custom Perl script (see Code availability) was used to modify the VCF file. The final VCF file contained
genotypes for 2,380,601 SNPs due to missing calls (72 SNPs), SNPs that could not be converted to hg19 coordinates (60,142 SNPs), and missing strand information (9,185 SNPs). We did not
perform any filtering of SNPs based on minor allele frequencies or call rates. WHOLE EXOME SEQUENCING We sequenced 72 samples prepared following the Illumina TruSeq protocol on an Illumina
GAII outsourced to the Australian Genome Resource Facility (AGRF). The data was processed using GATK18 according to GATK Best Practices recommendations19,20 and using the GATK 2.8 data
bundle21 for hg19; the full pipeline was implemented using Bpipe22 (see Code availability). Briefly, sequences were aligned to the hg19 reference genome with BWA-MEM23, followed by the
removal of PCR duplicates, base quality score recalibration, indel realignment, and variant quality score recalibration on putative SNPs and INDELs. The VCF file produced by the pipeline
uses the reference base on the positive strand of hg19 in the REF field and the variant is shown in the ALT field. We calculated the coverage using BEDTools24 and GNU parallel25 to
parallelise the jobs; specifically we used bedtools coverage with the -d parameter to calculate the per base depth and then calculated the percentage of bases with at least 20X and 30X
coverage. OVERLAPPING WITH KNOWN VARIANTS We compared our SNVs with SNPs available in six publicly available databases: HapMap 3.3 (ref. 5), dbSNP 138 (ref. 9), ESP 6500 (ref. 7), ExAC 0.3
(ref. 8), UK10K11, and 1KGP Phase 3 (ref. 10). We downloaded the respective VCF files and used BEDTools24 to intersect our SNVs to the database variants; specifically, we used bedtools
intersect with the -u parameter. To obtain a list of SNVs not recorded in any of the databases, we used bedtools intersect with the -v parameter, which reports entries with no overlaps. We
ran six intersects, one for each variant database, using the output from the first intersect as input to the second intersect, and so forth. Note that BEDTools only considers the genomic
coordinates and doesn't take into account the alleles; hence a SNV that overlaps a SNP in a database but has different REF and ALT alleles will still count as an overlap. VARIANT
ANNOTATION We used ANNOVAR12 (version 2015Jun16) to annotate our genomic variants against RefSeq sequences (version 20150322), given that commercial kits target, at a minimum, all of the
RefSeq genes. ANNOVAR annotates variants (in this precedence) as exonic (within coding regions), splicing (within an intron and 2 bp of a splice junction), ncRNA (within a transcript without
any coding annotation), UTR5 (within a 5' untranslated region), UTR3 (within a 3' untranslated region), intronic (within an intron), upstream (within 1 kb of a transcription start
site), downstream (within 1 kb of the end of a transcript), and intergenic (within an intergenic region). Variants within exons are further annotated to indicate the amino acid changes as a
result of the exonic variant. Annotations include (in this precedence): frameshift insertion (an insertion leading to a frameshift), frameshift deletion (a deletion leading to a
frameshift), stopgain (creation of a stop codon), stoploss (the loss of a stop codon), nonframeshift insertion (an insertion not leading to a frameshift), nonframeshift deletion (an
insertion not leading to a frameshift), nonsynonymous SNV (single nucleotide change leading to an amino acid change), synonymous SNV (single nucleotide change not leading to an amino acid
change), and unknown (unknown function). CODE AVAILABILITY A full description of our GATK pipeline, which contains all the programs and parameters used, is openly available at
https://github.com/davetang/tang_sd_2015. The Markdown file in the pipeline folder documents each step of the pipeline, as well as providing external links to the relevant sources for
further information. In addition, we have provided the two Perl scripts that were used to prepare the Illumina Omni2.5 BeadChip files, and the R and TeX code used to generate Figs 1,3 and 4.
DATA RECORDS The unprocessed Illumina Omni2.5 BeadChip data is available from the European Genome-phenome Archive (EGA) under the accession number EGAS00001001004 (Data Citation 1) and more
information on this data set can be found in our recently published study4. We have also deposited our full set of variants identified from our WES study as a single multi-sample VCF file
in the EGA under the accession number EGAS00001001585. The raw FASTQ files are not available in the data archive, however all the steps used to process the raw files to create the final VCF
file, are available at our GitHub repository (see Code availability). TECHNICAL VALIDATION 70 of the 72 individuals who had their exomes sequenced were also chip genotyped, allowing us to
compare the genotypes at overlapping sites. We found 83,806 comparable sites, i.e., loci where we have genotype information across the 70 individuals from both technologies, which
corresponded to 5,784,674 genotypes (out of a maximum of 5,866,420 due to missing data). Using SnpSift26 we found that 5,701,729 of the 5,784,674 comparable genotypes were concordant
(98.6%), i.e., both technologies called the same genotype (homozygous reference, heterozygous, or homozygous non-reference) at the same loci for a particular individual (Table 2).
Furthermore, SnpSift only compares sites where the REF and ALT fields are identical, otherwise an error is reported; however, we only observed 178 error cases. In addition, we calculated the
transition/transversion (Ts/Tv) ratios per exome sample as a quality metric. Transitions are interchanges between purines (A, G) or pyrimidines (C, T) and transversions are interchanges
between purines and pyrimidines. When there is no bias towards either transitions and transversions, the ratio is 0.5. While there are more possible transversions than transitions,
transitions are observed more frequently due to molecular mechanisms and transitions are less likely to result in non-synonymous mutations; therefore we should observe a ratio greater than
0.5. Unfiltered SNVs had the lowest Ts/Tv ratios per sample compared to SNVs that were filtered using the VQSLOD score and filtered by exonic region (Fig. 4). Due to the nature of the exome
capture, regions slightly outside of the exon are captured; this is also by design to capture non-coding regions that have functional implications such as the 5′ and 3′ UTRs. However, as
these sites are not as constrained (i.e. under purifying selection to maintain function) as exons, transversions are more common and can lower the Ts/Tv ratio. While it has been reported
anecdotally that WES Ts/Tv ratios are around the 2.8 value, there is no general consensus. It may be possible that by using additional filters that the Ts/Tv ratio can be increased, however,
we would like to present the data as is and users may apply their preferred hard filters. USAGE NOTES Ethical approval for the study was obtained from the Western Australian Aboriginal
Health Ethics Committee (Reference 227 12/12). This ethics committee is responsible for reviewing health and medical research undertaken in Western Australian Aboriginal communities. It is
registered with the National Health and Medical Research Council's (NHMRC’s) Australian Health Ethics Committee (AHEC) and operates in accordance with the NHMRC National Statement on
Ethical Conduct in Human Research 2007. The data is made available through the European Genome-phenome Archive (EGA), subject to review by a study-specific Data Access Committee (DAC).
Access to data will be granted to qualified researchers for appropriate health related uses. A qualified researcher refers to a scientist, who is employed, or a student enrolled at, or
legitimately affiliated with an academic, non-profit or government institution, or a commercial company performing Aboriginal health related diagnostic services. Applicants are asked to
complete a basic application form (which includes a brief summary of the proposal, so the DAC can determine if the planned usage falls within consents) and to agree to the terms and
conditions laid out in the Data Access Agreement (DAA). The DAA must be signed by the applicant and the relevant Head of Department, Head of Institute, or equivalent. If applications include
a named collaborator then the collaborator’s Institution must sign and submit a separate Data Access Agreement. Review by the DAC takes 2 weeks and if the application is approved, access
via the EGA is then arranged for the applicant (https://www.ebi.ac.uk/ega/about/access). The application form, data access agreement, and further information are available from our website:
http://bioinformatics.childhealthresearch.org.au/AGHS/. Permission to lodge de-identified genotype and basic demographic data (broad geographical location, age, sex and phenotype
information) in the EGA was obtained from the Board of the local Aboriginal Health Service. It should be noted that this Board approval is for use of the data in health-based research, and
not for use in pure population genetics research. The data is provided as reference data for health-based research and translation in Aboriginal Australian communities. ADDITIONAL
INFORMATION HOW TO CITE THIS ARTICLE: Tang, D. _et al._ Reference genotype and exome data from an Australian Aboriginal population for health-based research. _Sci. Data_ 3:160023 doi:
10.1038/sdata.2016.23 (2016). REFERENCES REFERENCES * Bamshad, M. J. et al. Exome sequencing as a tool for Mendelian disease gene discovery. _Nat. Rev. Genet._ 12, 745–755 (2011). Article
CAS Google Scholar * Ng, S. B. et al. Exome sequencing identifies MLL2 mutations as a cause of Kabuki syndrome. _Nat. Genet._ 42, 790–793 (2010). Article CAS Google Scholar * Ng, S. B.
et al. Exome sequencing identifies the cause of a mendelian disorder. _Nat. Genet._ 42, 30–35 (2010). Article CAS Google Scholar * Anderson, D. et al. First genome-wide association study
in an Australian aboriginal population provides insights into genetic risk factors for body mass index and type 2 diabetes. _PLoS ONE_ 10, e0119333 (2015). Article Google Scholar *
International HapMap, C. The International HapMap Project. _Nature_ 426, 789–796 (2003). Article Google Scholar * Genomes Project, C. et al. An integrated map of genetic variation from
1,092 human genomes. _Nature_ 491, 56–65 (2012). Article ADS Google Scholar * Exome Variant Server. http://evs.gs.washington.edu/EVS/ (2011). * Exome Aggregation Consortium.
http://exac.broadinstitute.org (2014). * Sherry, S. T. et al. dbSNP: the NCBI database of genetic variation. _Nucleic Acids Res._ 29, 308–311 (2001). Article CAS Google Scholar * Genomes
Project, C. et al. A global reference for human genetic variation. _Nature_ 526, 68–74 (2015). Article ADS Google Scholar * Consortium, U. K. et al. The UK10K project identifies rare
variants in health and disease. _Nature_ 526, 82–90 (2015). Article ADS Google Scholar * Wang, K., Li, M. & Hakonarson, H. ANNOVAR: functional annotation of genetic variants from
high-throughput sequencing data. _Nucleic Acids Res._ 38, e164 (2010). Article Google Scholar * Tonkinson, R. _The Mardu aborigines: living the dream in Australia's desert_.
(Wadsworth Publishing, 2002). Google Scholar * Davenport, S. _Cleared out: first contact in the Western Desert_ (Aboriginal Studies Press, 2005). Google Scholar * Chang, C. C. et al.
Second-generation PLINK: rising to the challenge of larger and richer datasets. _Gigascience_ 4, 7 (2015). Article Google Scholar * Hinrichs, A. S. et al. The UCSC Genome Browser Database:
update 2006. _Nucleic Acids Res._ 34, D590–D598 (2006). Article CAS Google Scholar * Genotyping chips strand and build files. http://www.well.ox.ac.uk/~wrayner/strand/ (2014). * McKenna,
A. et al. The Genome Analysis Toolkit: a MapReduce framework for analyzing next-generation DNA sequencing data. _Genome Res_. 20, 1297–1303 (2010). Article CAS Google Scholar * DePristo,
M. A. et al. A framework for variation discovery and genotyping using next-generation DNA sequencing data. _Nat. Genet._ 43, 491–498 (2011). Article CAS Google Scholar * Van der Auwera,
G. A. et al. From FastQ data to high confidence variant calls: the Genome Analysis Toolkit best practices pipeline. _Curr Protoc Bioinformatics_ 11, 11.10.1–33 (2013). Google Scholar * GATK
data bundle 2.8. ftp://ftp.broadinstitute.org (2014). * Sadedin, S. P., Pope, B. & Oshlack, A. Bpipe: a tool for running and managing bioinformatics pipelines. _Bioinformatics_ 28,
1525–1526 (2012). Article CAS Google Scholar * Li, H. Aligning sequence reads, clone sequences and assembly contigs with BWA-MEM. _ArXiv e-prints_ 1303
http://adsabs.harvard.edu/abs/2013arXiv1303.3997L (2013). * Quinlan, A. R. & Hall, I. M. BEDTools: a flexible suite of utilities for comparing genomic features. _Bioinformatics_ 26,
841–842 (2010). Article CAS Google Scholar * Tange, O. Gnu parallel - the command-line power tool. _login: The USENIX Magazine_ 36, 42–47 (2011). Google Scholar * Cingolani, P. et al.
Using Drosophila melanogaster as a Model for Genotoxic Chemical Mutational Studies with a New Program, SnpSift. _Front Genet._ 3, 35 (2012). Article Google Scholar * Miller, A. M. et al.
bam.iobio: a web-based, real-time, sequence alignment file inspector. _Nat Methods_ 11, 1189 (2014). Article CAS Google Scholar DATA CITATIONS * Tang, D. _European Genome-phenome Archive_
EGAS00001001585 (2015) Download references ACKNOWLEDGEMENTS We gratefully acknowledge the tremendous contribution made by the Aboriginal community, the Board and the staff of the local
Aboriginal Health Service (AHS) where the study was based. The work was funded by grant APP634301 from the Australian National Health and Medical Research Council. AUTHOR INFORMATION AUTHORS
AND AFFILIATIONS * Telethon Kids Institute, The University of Western Australia, Subiaco, 6008, Western Australia, Australia Dave Tang, Denise Anderson, Richard W. Francis, Genevieve Syn,
Sarra E. Jamieson, Timo Lassmann & Jenefer M. Blackwell Authors * Dave Tang View author publications You can also search for this author inPubMed Google Scholar * Denise Anderson View
author publications You can also search for this author inPubMed Google Scholar * Richard W. Francis View author publications You can also search for this author inPubMed Google Scholar *
Genevieve Syn View author publications You can also search for this author inPubMed Google Scholar * Sarra E. Jamieson View author publications You can also search for this author inPubMed
Google Scholar * Timo Lassmann View author publications You can also search for this author inPubMed Google Scholar * Jenefer M. Blackwell View author publications You can also search for
this author inPubMed Google Scholar CONTRIBUTIONS D.T. analysed and interpreted the data sets, and wrote the manuscript. D.A. prepared the Illumina Omni2.5 BeadChip data. R.W.F. contributed
to analysis of the data. G.S. assisted with sample preparation. S.E.J. assisted with sample collection, study design, and project management. T.L. analysed the WES data and assisted with the
data interpretation. J.M.B. drafted the manuscript and led all aspects of the research project. All authors contributed to preparation of the manuscript. CORRESPONDING AUTHORS
Correspondence to Dave Tang or Jenefer M. Blackwell. ETHICS DECLARATIONS COMPETING INTERESTS The authors declare no competing financial interests. ISA-TAB METADATA ISA-TAB METADATA RIGHTS
AND PERMISSIONS This work is licensed under a Creative Commons Attribution 4.0 International License. The images or other third party material in this article are included in the article’s
Creative Commons license, unless indicated otherwise in the credit line; if the material is not included under the Creative Commons license, users will need to obtain permission from the
license holder to reproduce the material. To view a copy of this license, visit http://creativecommons.org/licenses/by/4.0 Metadata associated with this Data Descriptor is available at
http://www.nature.com/sdata/ and is released under the CC0 waiver to maximize reuse. Reprints and permissions ABOUT THIS ARTICLE CITE THIS ARTICLE Tang, D., Anderson, D., Francis, R. _et
al._ Reference genotype and exome data from an Australian Aboriginal population for health-based research. _Sci Data_ 3, 160023 (2016). https://doi.org/10.1038/sdata.2016.23 Download
citation * Received: 12 November 2015 * Accepted: 11 March 2016 * Published: 12 April 2016 * DOI: https://doi.org/10.1038/sdata.2016.23 SHARE THIS ARTICLE Anyone you share the following link
with will be able to read this content: Get shareable link Sorry, a shareable link is not currently available for this article. Copy to clipboard Provided by the Springer Nature SharedIt
content-sharing initiative