- Select a language for the TTS:
- UK English Female
- UK English Male
- US English Female
- US English Male
- Australian Female
- Australian Male
- Language selected: (auto detect) - EN
Play all audios:
ABSTARCT The Hindu Kush is seismically active zone locates to the southwest of Pamir Plateau. Earthquakes are frequent here, but very a few relevant studies on earthquake anomalies was
found. We investigated the abnormal change of satellite microwave brightness temperature (MBT) related with the recent Mw 6.4 earthquake occurred on January 11, 2024 near the Karakum Desert,
Hindu Kush. We found a significant positive MBT anomaly appeared in the eastern part of Karakum Desert, on the immediate west of the epicenter, from three days before and two days after the
earthquake. The temporal characteristics of the positive MBT anomaly can be described in sequence as follows: pre-earthquake (pre-EQ) rising, near-earthquake (near-EQ) enhancing,
co-earthquake (co-EQ) peaking, after-earthquake (after-EQ) persisting and dissipating eventually. Validating with multi-source auxiliary data such as surface temperature (ST), microwave
polarization difference index (MPDI), soil moisture (SM), rainfall and snowfall, we confirmed the positive MBT anomaly appeared in the Karakum Desert from January 10 to January 13 was
attributed to the seismic activity but not meteorological factors. The upward transfer of P-hole particles, activated in the deep hypocenter area by accumulated crustal stress during the
pre-, co- and after-EQ period, to the Quaternary surface along the stress gradient, was believed to have reduced the local ground surface dielectric constant and amplified the microwave
radiation, which leading subsequently to the positive MBT anomalies. In addition, we found there was also abnormal locally high CH4 concentration occurred near the epicenter one day before
the earthquake, which was probably related to the fault relaxing and CH4 releasing before the impending earthquake. This study has reference significance for identifying potential MBT
anomalies during the seismogenic period and for the earthquake early warning in Hindu Kush region. SIMILAR CONTENT BEING VIEWED BY OTHERS SUMMER HEAT WAVE IN 2022 LED TO RAPID WARMING OF
PERMAFROST IN THE CENTRAL QINGHAI-TIBET PLATEAU Article Open access 13 September 2024 THERMAL PATTERN OF TATUN VOLCANIC SYSTEM BY SATELLITE-OBSERVED TEMPERATURES AND ITS CORRELATION WITH
EARTHQUAKE MAGNITUDES Article Open access 10 November 2023 PRESEISMIC ATMOSPHERIC RADON ANOMALY ASSOCIATED WITH 2018 NORTHERN OSAKA EARTHQUAKE Article Open access 02 April 2021 INTRODUCTION
Earthquakes are the result of tectonic deformation and fault rupture under the action of tectonic stresses between plates, causing the earth’s crust to release elastic energy rapidly and
suddenly. Although the changes in ground stress cannot be directly observed1, changes in heat-related physical quantities during the seismogenic period of earthquakes, subsurface tectonic
stress in seismic zones can be indirectly detected and simulated2,3,4. The common thermal anomaly parameters used to study earthquakes are surface skin temperature5,6, infrared brightness
temperature7,8, outgoing longwave radiation9,10,11, wavelet power spectrum of infrared radiation12,13 and Microwave brightness temperature (MBT)14,15,16,17,18. Compared with the former two
parameters, the surface microwave radiation signal can pass through clouds and be detected by satellite sensors, and is basically less even not affected by the meteorological conditions19.
It has been widely used to explore pre-earthquake thermal anomalies. The Indian Ocean Plate is subducting and squeezing continuously the Eurasian Plate from south to north at a rate of ~40
mm per year, causing the Himalayas Mountains, the Karakoram Mountains and the Hindu Kush Mountains uplift20. As a result, tectonic stress accumulation is becoming active around the Pamir
Plateau being the conjunction zone of Himalayas, Karakoram and Hindu Kush, and earthquakes are much more frequent in Hindu Kush in recent years21. Due to the economic poverty and frequent
wars in this area, there are few site observations and surface measurements on earthquakes. Satellite remote sensing, as a long-distance and large-scale remote observation, is very good for
the earthquake research in this area. Gopal et al.22 found that the vertical total electron content of the ionosphere showed significant anomalies a few days before the 2015 Hindu Kush Ms7.5
mainshock. Ding et al. 23 found that there were positive MBT anomalies appeared on the Quaternary caprock and along some faults near the epicenter before a Ms 6.0 earthquake in Pakatika,
the southern part of Hindu Kush. Satellite technology is promising in detecting seismic anomalies and precursors in this region. Unfortunately, the Hindu Kush region lacks sufficient
attention yet, and the seismic research remains insufficiently deep. A Mw 6.4 earthquake occurred to the north of Afghanistan at 9:20 Am on January 11, 2024 (UTC), with the epicenter located
in the Hindu Kush mountains and a focal depth of 204 km. Seismic activity is prevalent in the study region (Fig. 1a). Since the beginning of the 21st century, 40 earthquakes of magnitude 6
or above have occurred, mostly concentrated in the Hindu Kush region. The magnitude and timing of the 40 major earthquakes are depicted in Fig. 2. The seismic temporal and spatial data are
from the United States Geological Survey (USGS). Spatially, most earthquakes including this Ms6.4 one occurred in the Hindu Kush Mountain area. This indicated that the Hindu Kush region had
been a stress concentration zone for much a long time. Seismic activity was frequent in the study area from 2000 to 2010. However, there were no significant earthquakes happened from 2010 to
2015, during which stress and energy accumulated until two earthquakes of magnitude 7 or above occurred in late 2015. Subsequently, earthquakes occurred frequently from 2016 to 2019. From
2020 to 2023, the study area experienced another period of calm, suggesting that the crust elastic energy is again in process of accumulation. Therefore, the study of the 2024 Hindu Kush
earthquake has a certain degree of typicality and predictability. Considering the Dobrovolsky seismogenic range of the Hindu Kush earthquake24, the structural characteristics of the study
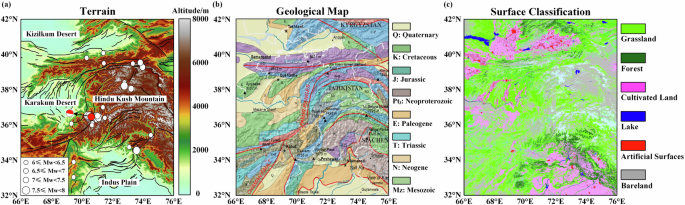
area and the scanning bandwidth of the satellite, a geographical region being 66°–76°E and 32°–42°N was selected as the study area, as shown in Fig. 1. The terrain of the study area is
complex and changes significantly. The central and eastern parts are dominated by the high-altitude Hindu Kush Mountain, while the southeastern, northwestern and western parts consist of the
flat terrain of the Indus Plain, Kizilkum Desert and the Karakum Desert, respectively (Fig. 1a). Furthermore, the fault systems are very complex (Fig. 1b), further contributing to it being
a region prone to frequent earthquake25. The land cover is relatively uniform in the study area, mainly consisting of forests, grasslands, bare land, and cropland (Fig. 1c), which is
beneficial for MBT analysis. The study area has low rainfall and few clouds throughout the year26, making it suitable for satellite observations. RESULTS SPATIOTEMPORAL FEATURES OF ΔMBT
Figure 3 shows the basic features and trends of the ΔMBT in the study area 15 days before and after the Ms 6.4 mainshock on January 11, 2024. The positive ΔMBT firstly appeared in the
Karakum Desert on December 28, 2023, which became increasingly prominent in amplitude and scope until January 4, 2024. Subsequently, the ΔMBT weakened to some extent until January 8, 2024.
From January 10 to 13, 2024, the ΔMBT increased sharply. Afterwards, it gradually calmed down again until January 20. This abnormal behavior of the ΔMBT can be summarized as in sequence:
pre-EQ rising, near-EQ enhancing, co-EQ peaking, after-EQ persisting and dissipating eventually. The temporal characteristics of positive ΔMBT residuals were essentially consistent with the
thermal curves of the laboratory rock compressively loaded to failure27,28. According to the DTS criteria29, the ΔMBT in the Karakum Desert occurred not only temporally close to the day of
the Hindu Kush earthquake, but also spatially adjacent to the left side of the epicenter with a significant amplitude, especially reaching 20 K in the immediate days before and after the
earthquake, which could be identified as a seismic anomaly. In addition, the ΔMBT in the Karakum Desert showed negative ΔMBT on January 4, January 8 and January 10, 2024, and positive ΔMBT
on January 24. The above negative MBT anomaly phenomena were related to changes in rainfall and soil moisture while the positive MBT anomaly was related to an increase in skin temperature.
The details of these phenomena are further analyzed in the next paragraph. MECHANISM OF POSITIVE ΔMBT IN THE KARAKUM DESERT Considering the positive ΔMBT in the Karakum Desert, the core area
was narrowed to (35–39°N, 66–71°E), and further analysis was based on auxiliary data including ST, MPDI, SM, rainfall, and snowfall. The results are shown in Fig. 4. Although the ΔST of the
Karakum Desert increased locally (≈10 K) on January 11, 12, 13 and 24, it was insufficient to explain effectively the large ΔMBT (≈20 K). The ΔST in the Karakum Desert was relatively stable
in other periods, but ΔMBT still showed large positive anomalies. It inferred that the main reason for the ΔMBT change in the Karakum Desert could be owing to the change both in ST and the
dielectric properties of ground surface. Besides, the ΔMBT of Karakum Desert exhibited extremely negative anomalies on January 4, 8, 10 and 11. Although low-frequency MBT has good
penetration into the atmosphere and vegetation, it is easily affected by SM30,31. By comparing the daily rainfalls, we know that this was indeed caused by rainfall. Rainfall leads to an
increase in SM, resulting in higher surface soil dielectric constant and MPDI, and ultimately causing the decrease in MBT. Through daily snowfall images, we also found that the local
snowfall had little effect on MPDI and MBT of the earth surface, which was due to the similarity in the dielectric constant of snow, ice and dry sand. As for the positive ΔMBT, the influence
from meteorology factors could be basically ruled out through SM, rainfall and snowfall images. From December 28, 2023 to January 6, 2024, both the SM and MPDI in Krakum Desert decreased,
but the MBT increased. It showed that the reduction of SM was the key factor of decreasing MPDI and rising MBT. It should be particularly noted that on January 8, 2024, due to the influence
of rainfall, the SM in the east part of Karakum Desert was relatively stable, but the ΔMBT still showed positive anomalies. Also, from January 10 (1 d before the EQ) to January 13 (2 d after
the EQ), the SM had almost no change, but ΔMPDI and ΔMBT showed negative anomalies and positive anomalies, respectively. This phenomenon showed that in addition to SM, other factors might
had caused the change of surface dielectric constant. Finally, on January 17, 2024, there was another significant reduction in SM. This phenomenon suggested that the positive ΔMBT on January
17 and thereafter was caused by the decrement in SM. Moreover, by analyzing the ΔMBT images on January 8, 2024, the Karakum Desert was segmented into three parts: western, central, and
eastern. The central region displayed a negative MBT anomaly attributed to rainfall. While the western areas, receiving less rainfall, exhibited a positive anomaly. Analysis of ΔST, ΔSM, and
ΔMPDI images indicated that increased ST, decreased MPDI, and stable SM had occurred in this region. This suggests that increased ST and decreased dielectric constant were primary factors
behind the positive MBT anomaly observed in the west. Similarly, the positive MBT anomaly in the east was linked to variations in the dielectric constant. To further verify the abnormal
phenomenon of ΔMBT before and after the earthquake, this study calculated the average values of ∆MBT, ∆ST, ∆MPDI, and ∆SM in the eastern Karakum Desert and analyzed them in conjunction with
daily rainfalls (Fig. 5), in that rainfalls have negative impact on MBT, MPDI, SM and ST. For better description and understanding, the result curves are divided into three phases according
to the evolutions of ∆MBT as: (1) Firstly, despite the inhibitory effect of rainfalls to MBT and ST, ∆MBT and ∆ST are positive under clear sky conditions, and the magnitude of positive ∆ST
was not as large as that of ∆MBT. It means that the positive ∆MBT was affected not only by ∆ST, but also by the dielectric constant of ground surface. Combining the ∆MPDI and ∆SM curves, we
found that when ∆SM was positively high or stable, ∆MPDI was still negative around October 25, 2023 and November 16, 2023. This particular abnormity implies that in addition to SM there were
other factors led to the decrease of ground surface’s dielectric constant. (2) Secondly, two rainfall events caused the ΔMBT approaching zero on December 30, 2023 and January 9, 2024. It
showed that the positive ΔMBT was caused by some factors offset the impact of rainfalls, and the ΔMBT kept positive for the rest of the time. After the earthquake, ∆SM and ∆ST approached
zero on January 16, 2024 and January 21, 2024, while ∆MBT and ∆MPDI continued to be positive and negative, respectively. This suggested that there were other factors besides ST and SM
leading to the positive ΔMBT. (3) Thirdly, due to long-term and frequent rainfalls in the rainy season, the MBT and ST decreased significantly but the MPDI and SM increased. The data from
this stage were greatly affected by weather, and the results cannot be used to analyze surface and shallow MBT phenomena. CH4 ANOMALY IN THE KARAKUM DESERT Figure 6a shows the changing of
layer concentration of CH4 in the Karakum Desert and its around shortly before and after the Ms6.4 earthquake. Abnormally high CH4 concentration occurred on January 7th, 10th, and 17th,
2024. The abnormity on January 10th were greater in extent and concentration than those on other days. Surprisingly, this CH4 anomaly occurred just one day before the shocking, and displayed
similarly to that related with 2022 Pakatica Ms 6.0 earthquake23. Figure 6b shows the variation of CH4 concentration at different atmospheric pressure layers on January 10, 2024. Obviously,
the CH4 concentration decreased with altitude, which excluded the possibility that the CH4 came from outside or be generated by internal chemical reactions. Moreover, the CH4 concentration
area is in spatial consistency to Triassic coal mines and Carboniferous coal mines32. We speculated that the change of crustal stress field in the seismogenious area shortly before the
shocking had caused the relax or opening of local faults in and nearby the Karakum Desert, and greenhouse gases such as CH4 in the coal-related strata was released subsequently to ground
surface and got concentration in the atmosphere above ground. DISCUSSION It is very necessary to carry out multi-parameter seismic anomalies research, and the use of multiple auxiliary data
can eliminate the MBT anomalies caused by non-seismic factors. This study analyzed mainly the anomalies of MBT and MPDI, and applied the ST, SM, rainfall and snowfall data for validation to
eliminate the non-seismic changes in dielectric constant and temperature, which might be caused by weather factors. Although the temporal resolutions of auxiliary data are various (1 h or 12
h as in Table 1) but it is better than that of MBT (1 d), which does not affect the validation in that we focused on the positive ΔMBT and negative ΔMPDI anomalies and its evolutionary
trends in this study. The analytical methods exhibit a certain degree of transferability and repeatability, but additional parameters need to be added for further investigation. In
laboratory experimental electric observation on rock samples loaded to fracturing, stress-activated positive charge carriers (P-holes) appear when the rock is stressed33,34. In condition of
seismogenious process, the activated P-holes will migrate upward along stress gradient and eventually accumulate on ground surface or distant low-stress zones, where an additional electric
field will be generated on the rock surface35. The accumulation of P-holes on the ground surface adds additional positive potential to the rock surface, reducing the surface’s dielectric
constant, and ultimately lifting its microwave radiation energy. Experiments on the microwave radiation and dielectric changes of the surface of rock samples loaded to fracturing also
observed significant rise of MBT36 as well as obvious drop of microwave dielectric constant37. The change of crustal stress field and the development of rock fractures during the imminent
earthquake period are the essential reasons for the appearance of abnormal seismic signals38. Combining existing geological data (fault orientation, Crust1.0 global 3D crustal data), taking
into account the GNSS velocity field, the ANSYS finite element method was applied to simulate the underground stress filed alteration with a carefully constructed 3D model. Considering that
the depth of the earth’s crust is 0–40 km, this range of depths was selected for geostress simulation (Fig. 7a). For further analysis, the 3D model of simulated stress filed was sectioned at
different depths (5–30 km) to obtain the corresponding pattern of crust stress altering with depth (Fig. 7b). The ground horizontal stress gradient of the Karakum Desert runs generally from
east to west. As a result, large amounts of CH4 escaped from Carboniferous coal mines in the western part of the desert, while less CH4 escaped from Triassic coal mines in the eastern part
of the desert. The focal depth of the Hindu Kush earthquake was 204 km, which was a deep-source earthquake. And the electric charge generated by plate compression was difficult to be
transferred from such a deep area to the surface. However, there was a high-stress concentration area at depth 10–15 km, which was benefit for the activation and propagation of P-holes. The
magnitude and area of concentrated stresses on the ground were relatively smaller than those at depth, which means that there was an upward stress gradient. The seismic zone was in a stress
blocking state for a long time, and elastic energy was accumulated without strong earthquakes happened to get release. With the accumulation of local crustal stress, a large number of
P-holes should had been activated underground in the seismogenious region, especially in the hypocenter zone, and flowed upward to the ground surface of Karakum Desert. Therefore, the ground
surface of Karakum Desert, which is above the high-stress concentration zone, might had acted as the core area of P-holes accumulation, which corresponded to the positive ΔMBT anomaly.
Other experiments showed that during the rock loading process, the covering of sands layer on the surface of ballast rock samples lifted the microwave radiation from the rock sample39. The
stratigraphic age of the Karakum Desert in the west of the study area is Quaternary, the surface cover is bare land and cultivated land (Figs. 1b, 1c), the Quaternary strata have loose
lithology, and the gravel and sandy particles contain metamorphic rock fragments40. The sandstones and metamorphic rocks embody with extensive stress sensitive peroxy defects, which are
easily activated by stress to produce P-holes33. As a result, the Quaternary system is not only the medium for the transfer or propagation of P-holes from underground deep to ground surface,
but also a source of P-holes production in shallow underground where are stressed also. Therefore, the frequent occurrence of positive ΔMBT anomalies in the seismogenious zone is due to
coupling of the locally accumulated crustal stress and the objective regional geo-environments. In addition, the western part of the crust under the Karakum Desert generally suffered low
stress accumulation, which spatially corresponded to the CH4 anomaly occurred one day before the shocking. The spatio-temporal evolution characteristics of abnormal MBT related to the 2024
Hindu Kush earthquake was revealed from AMSR-2 observation data. The positive MBT anomaly occurred in Karakum desert was attributed to the transfer of stress-activated P-holes to the
Quaternary strata, which reduces the surface dielectric constant and ultimately leads to the rise of surface MBT. The change in local tectonic stress led to also the escape of underground
trace gases such as methane to ground surface. Affected by many factors such as regional plate tectonic activity, geological lithology, surface cover type and weather conditions, which
requires careful identification using multi-source information and multi-parameters, the uncover of the seismic related MBT positive anomaly is challenging. This work has reference
significance for searching earthquake precursors using multi-parameter data, and is of special significance in earthquake remote sensing study in the Hindu Kush region. METHODS MICROWAVE
BRIGHTNESS TEMPERATURE (MBT) DATASET The Advanced Microwave Scanning Radiometer-2 (AMSR-2) sensors, on boarding the GCOM-W1 satellite, were employed for observing the MBT data related with
the EQ. The AMSR-2 sensors mainly include 5 frequencies (10.65-89 GHz) and dual polarization channels (horizontal and vertical)41. The main performance parameters are listed in Table 1.
Compared to high-frequency signals, the low-frequency signals are less sensitive to cloud and meteorological disturbances and can detect shallow ground physical information at a certain
depth. Therefore, the lowest frequency at 10.65 GHz is usually selected for seismic anomalies42. Compared with V polarization, H polarization is more sensitive to the change in the
dielectric constant of ground surface and can better reflect its abnormal amplitude and details43, so the MBT of H polarization at 10.65 GHz is used in this study. The revisit of the GCOM-W1
satellite is 1:30 am and 1:30 pm local time. To avoid the influence of solar radiation, the MBT data obtained at 1:30 am was used. Furthermore, the microwave polarization difference index
(MPDI) calculated by polarized MBT is independent of ST and can separate the correlation between vegetation and SM44. The calculation method of MPDI is as follows:
$${{MPDI}}_{f}=\frac{{{MBT}}_{{fv}}-{{MBT}}_{{fh}}}{{{MBT}}_{{fv}}+{{MBT}}_{{fh}}}$$ (1) where \({{MBT}}_{{fv}}\) and \({{MBT}}_{{fh}}\) represent the MBT under V and H polarization at
frequency \(f\), respectively. Qi et al.45 found that the terrestrial MPDI was related to the incident angle and the dielectric constant via a simplified formula. The incidence angle of the
selected band is fixed (at 55.0°), so the characteristic change of the dielectric constant can be uncovered using MPDI. MBT and MPDI can be approximated as a form closely related to
emissivity. $${{MBT}}_{f}={f}_{1}\left(T,f,p,g,Q,\varepsilon \right)$$ (2) $${{MPDI}}_{f}={f}_{2}\left(f,g,Q,\varepsilon \right)$$ (3) Where \(T\) represents the physical temperature of the
land surface, \(p\) refers to the polarization of the microwave signal, \(g\) and \(Q\) represent the vegetation coverage and surface roughness, respectively, and \(\varepsilon\) is the
microwave emissivity. In the same area and same period, \(g\) and \(Q\) remain unchanged so the combined application of MBT and MPDI can remove the influence of physical temperature \(T\).
If MPDI shows a negative anomaly, it means that the dielectric constant of this place decreases, otherwise it increases. ERA5 DATASET ERA5 is the fifth generation reanalysis dataset of ECMWF
(European Center for Medium-range Weather Forecasts) on global climate and weather over the past 80 years. Compared to the previous versions, the ERA-5 dataset has a higher spatio-temporal
resolution and more real-time products46. ERA5 provides hourly estimated data on atmospheric, ocean-wave and land-surface quantities since 1940, and it is updated daily with a latency of
approximately 5 days47. Precipitation, snowfall, skin temperature (ST) and soil moisture (SM) from the ERA5 dataset were selected as auxiliary parameters in this study. Precipitation is the
accumulated liquid and frozen water, consisting of rain and snow, that falls to the Earth’s surface, while the snowfall is the accumulated snow. The amount of rainfall can be determined from
the difference between snowfall and precipitation. ST is the temperature of the earth’s surface, which can be converted to degrees Celsius by subtracting 273.15. SM is the volume of water
0–7 cm below the surface. AIRS DATASET The Atmospheric Infrared Sounder (AIRS), is a hyperspectral infrared spectrometer onboarding NASA’s Aqua satellite since May 2002, whose primary
mission is to monitor the vertical structure of the Earth’s atmosphere48. The bandwidth of AIRS allows the observation of gas data, such as CO2, water vapor, O3 and CH4. The concentration
column data of CH4 was used as an important parameter in this study. Due to the large terrain variations in the study area, the dataset below the 575 hPa atmospheric pressure layer had many
spatial gaps, and the gas concentration above the 425 hPa atmospheric pressure layer was usually low. We used the data of the 575 hPa atmospheric pressure layer located on the surface of the
Hindu Kush mountains for the spatio-temporal characteristics analysis, and the data of the 425–575 hPa atmospheric pressure layer for the variation analysis referring to the altitude. The
original data of CH4 is reported in the unit of molecules/cm2, which was loga-rithmically calculated during the pre-processing process in this study, and the final unit was expressed as
logarithmic molecules/cm2. In addition, to avoid the influence of solar radiation on the hyperspectral infrared inversion data, the nighttime data were selected for analysis in this study.
GEOLOGICAL DATASET In February 2000, the Shuttle Radar Topography Mission (SRTM) successfully recorded the Earth’s land elevation between 60°N and 57°S, and digital elevation models of
spatial resolution 30 m are now widely used49. The land cover comes from the GlobeLand30 dataset with a resolution of 30 m, which was developed by the National Geomatics Center of China
(NGCC). Also, the generalized geological map data provided by the Geological Survey of Canada (GSC) meets the requirements for analyzing the correlation between surface rock formations and
MBT anomalies in the study area. The basic information of all the auxiliary data sets used is shown in Table 2. To investigate the potential seismic anomalies, the changes of multiple
parameters including MBT, MPDI, ST and SM were calculated by subtracting its background field data averaged over the past decade (2014–2023) from the data of seismic-year (2024),
respectively, so as to obtain its residual images. Daily rainfall and snowfall amounts are obtained by adding the hourly products for the year of 2024. Since gases are susceptible to the
interference from multiple factors such as meteorological conditions and atmospheric transport50, it is difficult to establish a pure background field to extract the residual images of CH4.
Currently, spatial relative changes in images are used to identify CH4 anomalies. To investigate the MBT anomaly in the Hind Kush region, we propose an overall flow chart as in Fig. 8, and
the specific steps are shown below. (1) Data preparation and processing: The spatio-temporally weighted two-step method (STW-TSM)43, was used to investigate potential MBT anomalies51.
Firstly, the basic residuals are obtained by removing the time-weighted background of the MBT series in the non-earthquake years before and after earthquakes. Secondly, based on the
Euclidean distance between the center pixel and the edge pixel, the residual value with random meteorological noise is removed. After processing the MBT data, the stable effects of
geography, terrain and seasons as well as random influences of weather conditions can be removed or suppressed, and the ΔMBT signals related to earthquakes can be retained and obtained. The
ΔMBT images can then be used to explore potential seismic MBT anomalies. (2) Interference factors elimination: Increased SM is often the main cause of negative ΔMBT, which reduces MBT by
increasing the dielectric constant of ground surface. For positive ΔMBT, if the ΔST is also positive, we consider the rising ST to be the primary factor rising MBT. If the SM shows a large
negative residual, we believe that the reduction of SM is the main reason of rising MBT. Otherwise, the positive ΔMBT could be attributed to seismic activities. (3) Seismic anomaly
verification: If the SM remains stable while MBT and MPDI show also significant anomalies, it could be inferred that seismic factors were causing a decreasing dielectric constant of ground
surface, thereby leading to the rising MBT. Additionally, changes and adjustments in local stress can lead also to fault relax or extension and the release of underground gases. These
phenomena are further verified by numerical simulation on the crustal stress field alteration. DATA AVAILABILITY The precipitation, snowfall, skin temperature and soil moisture data are
accessible through the Copernicus Data Store (CDS) (https://cds.climate.copernicus.eu). The Microwave Brightness Temperature, DEM and CH4 data is downloaded from the NASA’s Earth Observing
System Data and Information System (https://search.earthdata.nasa.gov). The Land cover data is downloaded from the National Geomatics Center of China (https://www.webmap.cn). The Geological
map is downloaded from the Geological Survey of Canada. CODE AVAILABILITY The codes used for this study can be shared upon request. REFERENCES * Chen, S., Liu, P., Chen, L. & Liu, Q.
Evidence from seismological observation for detecting dynamic change in crustal stress by bedrock temperature. _Chin. Sci. Bull._ 65, 2395–2405 (2020). Article Google Scholar * Gorny, V.
L., Salman, A. G., Tronin, A. A. & Shilin, B. V. The Earth’s outgoing IR radiation as an indicator of seismic activity. _Proc. Acad. Sci. USSR._ 301, 67–69 (1988). Google Scholar * Liu,
J. et al. Study of the OLR anomalies before the 2023 Turkey M7.8 earthquake. _Remote Sens._ 15, 5078 (2023). Article Google Scholar * Wu, L. et al. Scrutinizing and rooting the multiple
anomalies of Nepal earthquake sequence in 2015 with the deviation–time–space criterion and homologous lithosphere–coversphere–atmosphere–ionosphere coupling physics. _Nat. Hazards Earth
Syst. Sci._ 23, 231–249 (2023). Article Google Scholar * Ouzounov, D. & Freund, F. Mid-infrared emission prior to strong earthquakes analyzed by remote sensing data. _Adv. Space Res._
33, 268–273 (2004). Article Google Scholar * Akhoondzadeh, M., Santis, A. D., Marchetti, D., Piscini, A. & Jin, S. Anomalous Seismo-LAI variations potentially associated with the 2017
Mw = 7.3 Sarpol-E Zahab (Iran) Earthquake from Swarm Satellites, GPS-TEC and Climatological Data. _Adv. Space Res._ 64, 143–158 (2019). Article Google Scholar * Wu, L., Li, J. & Liu,
S. Infrared anomaly analysis based on reference fields for earthquake remote sensing. _Earthquake_ 29, 26–33 (2009). Google Scholar * Liu, Y., Wu, L., Qi, Y. & Ding, Y. Very-short-term
variations of sea surface and atmospheric parameters before the Ms 6.2 Zhangbei (China) earthquake in 1998. _Front. Environ. Sci._ 10, 906455 (2022). Article Google Scholar * Ouzounov, D.
et al. Outgoing long wave radiation variability from IR satellite data prior to major earthquakes. _Tectonophysics_ 431, 1–4 (2007). Article Google Scholar * Xiong, P. & Shen, X.
Outgoing longwave radiation anomalies analysis associated with different types of seismic activity. _Adv. Space Res._ 59, 1408–1415 (2017). Article Google Scholar * Jing, F., Jiang, M.,
Zhang, L. & Singh, R. P. Detection and identification of preseismic thermal anomalies in cloudy conditions associated with the 2022 luding (China) Mw 6.6 earthquake. _IEEE Trans. Geosci.
Remote Sens._ 61, 1–12 (2023). Google Scholar * Zhang, Y., Guo, X., Wei, C., Shen, W. & Hui, S. Characteristics of seismic thermal radiation of the Japan MS9.0 and Myanmar Ms7.2
earthquake. _Chinese J. Geophys._ 54, 670–676 (2013). CAS Google Scholar * Wei, C., Lu, X., Zhang, Y., Guo, Y. & Wang, Y. A time-frequency analysis of the thermal radiation background
anomalies caused by large earthquakes: a case study of the Wenchuan 8.0 earthquake. _Adv. Space Res._ 65, 435–445 (2020). Article Google Scholar * Singh, R. P. et al. Precursory signals
using satellite and ground data associated with the Wenchuan Earthquake of 12 May 2008. _Int. J. Remote Sens._ 31, 3341–3354 (2010). Article Google Scholar * Jing, F., Singh, R. P., Cui,
Y. & Sun, K. Microwave brightness temperature characteristics of three strong earthquakes in Sichuan Province, China. _IEEE J. Sel. Topics Appl. Earth Observ. Remote Sens._ 13, 513–522
(2020). Article Google Scholar * Qi, Y., Wu, L., Ding, Y. & Mao, W. Microwave brightness temperature anomalies associated with the 2015 Mw 7.8 Gorkha and Mw 7.3 Dolakha earthquakes in
Nepal. _IEEE Trans. Geosci. Remote Sens._ 60, 1–11 (2022). CAS Google Scholar * Wu, L. et al. Screening and rooting the multiple anomalies of Nepal earthquake sequence in 2015 with DTS
criterion and homologous LCAI-coupling physics. _EGU Sphere_ 23, 231–249 (2022). Google Scholar * Liu, Y., Wu, L., Qi, Y. & Ding, Y. General features of multi-parameter anomalies of six
moderate earthquakes occurred near Zhangbei-Bohai fault in China during the past decades. _Remote Sens. Environ._ 295, 113692 (2023). Article Google Scholar * Ulaby, F. & Long, D.
_Microwave Radar and Radiometric Remote Sensing_ (Artech House, 2015). * Reilinger, R. et al. GPS constraints on continental deformation in the Africa-Arabia-Eurasia continental collision
zone and implications for the dynamics of plate interactions. _J. Geophys. Res._ 111, B5 (2006). Google Scholar * Rehman, K., Ali, W., Ali, A. & Barkat, A. Shallow and intermediate
depth earthquakes in the Hindu Kush region across the Afghan-Pakistan border. _J. Asian Earth Sci._ 148, 241–253 (2017). Article Google Scholar * Sharma, G., Champati ray, P. K., Mohanty,
S., Gautam, P. K. P. & Kannaujiya, S. Global navigation satellite system detection of preseismic ionospheric total electron content anomalies for strong magnitude (Mw > 6) Himalayan
earthquakes. _J. Appl. Remote Sens._ 11, 046018 (2017). Article Google Scholar * Ding, Y., Wu L., Qi, Y. & Mao, W. Discriminating the polymorphism and attribution of microwave
radiation anomalies related to the June 2022 Mw 6.0 Paktita earthquake in Afghanistan. _Nat. Remote Sens. Bulletin_. 28, 2621–2631 (2024). * Dobrovolsky, I. P., Zubkov, S. I. & Miachkin,
V. I. Estimation of the size of earthquake preparation zones. _Pageoph_ 117, 1025–1044 (1979). Article Google Scholar * Liu, Y., Li, H., Zheng, H. & Tan, F. Research progress and
prospect of the relationship among active tectonics earthquakes and geological disasters in China. _J. Nat. Disasters._ 31, 1–14 (2022). CAS Google Scholar * Suryavanshi, S., Joshi, N.,
Maurya, H. K., Gupta, D. & Sharma, K. K. Understanding precipitation characteristics of Afghanistan at provincial scale. _Theor. Appl. Climatol._ 150, 1775–1791 (2022). Article Google
Scholar * Wu, L., Liu, S. & Wu, Y. The experiment evidences for tectonic earthquake forecasting based on anomaly analysis on satellite infrared image. _IEEE Int. Symposium Geosci.
Remote Sens_. https://doi.org/10.1109/IGARSS.2006.558 (2006). * Sun, L. et al. Characteristics and mechanisms of differential infrared brightness temperature change of rock specimen partly
loaded to fracturing. _IEEE Geosci. Remote Sens. Lett._ 21, 1–5 (2024). Google Scholar * Qin, K., Wu, L., Zheng, S. & Liu, S. A deviation-time-space-thermal (DTS-T) method for global
earth observation system of systems (GEOSS)-based earthquake anomaly recognition: criterions and quantify indices. _Remote Sens._ 5, 5143–5151 (2013). Article Google Scholar * Wigneron, J.
P., Chanzy, A., Calvet, J. & Bruguier, N. A simple algorithm to retrieve soil moisture and vegetation biomass using passive microwave measurements over crop fields. _Remote Sens.
Environ._ 51, 331–341 (1995). Article Google Scholar * Calvet, L. C. et al. Sensitivity of passive microwave observations to soil moisture and vegetation water content: L-band to W-band.
_IEEE Trans. Geosci. Remote Sens._ 49, 1190–1199 (2010). Article Google Scholar * Wnuk, C. Coal resource potential of Afghanistan. _Int. Geol. Rev._ 58, 321–341 (2015). Article Google
Scholar * Freund, F. Time-resolved study of charge generation and propagation in igneous rocks. _J. Geophys. Res._ 105, 11001–11019 (2000). Article CAS Google Scholar * Freund, F.
Pre-earthquake signals: underlying physical processes. _J. Asian Earth Sci._ 41, 383–400 (2011). Article Google Scholar * Freund, F. T. et al. Air ionization at rock surfaces and
pre-earthquake signals. _J. Atmos. Solar-Terr. Phys._ 71, 1824–1834 (2009). Article CAS Google Scholar * Mao, W., Wu, L., Liu, S. & Qi, Y. Microwave emission of rock change with
compressive stress: experiments and Physics. _Photon. Electromagnet. Res. Sympos. – Fall_. https://doi.org/10.1109/PIERS-Fall48861.2019.9021879 (2019). * Mao, W., Wu, L. & Qi, Y. Impact
of compressive stress on microwave dielectric properties of feldspar specimen. _IEEE Trans. Geosci. Remote Sens._ 58, 1398–1408 (2019). Article Google Scholar * Wu, L. et al. Mechanisms of
altering infrared-microwave radiation from stressed rock and key issues on crust stress remote sensing. _J. Remote Sens._ 22, 150–165 (2018). Google Scholar * Mao, W. et al. Additional
microwave radiation from experimentally loaded granite covered with sand layers: features and mechanisms. _IEEE Trans. Geosci. Remote Sens._ 58, 5008–5022 (2020). Article Google Scholar *
Cao, B. _Geomorphology Quaternary Geology_. (China Univ. Geosciences Press, 1995). * Imaoka, K. et al. Status of AMSR-2 Instrument on GCOM-W1. _Earth Observing Missionsand Sensors:
Development, Implementation, and Characterization II_. https://doi.org/10.1117/12.977774 (2012). * Ding, Y., Qi, Y., Wu, L., Mao, W. & Liu, Y. Discriminating the multi-frequency
microwave brightness temperature anomalies relating to 2017 mw 7.3 sarpol zahab (Iran-Iraq border) earthquake. _Front. Earth Sci._ 9, 656216 (2021). Article Google Scholar * Qi, Y., Wu,
L., He, M. & Mao, W. Spatio-temporally weighted two-step method for retrieving seismic MBT anomaly: May 2008 wenchuan earthquake sequence being a case. _IEEE J. Sel. Top. Appl._ 13,
382–391 (2020). Google Scholar * Becker, F. & Choudhury, B. J. Relative sensitivity of normalized difference vegetation index (NDVI) and microwave polarization difference index (MPDI)
for vegetation and desertification monitoring. _Remote Sens. Environ._ 24, 297–311 (1988). Article Google Scholar * Qi, Y., Wu, L., Mao, W., Ding, Y. & He, M. Discriminating possible
causes of microwave brightness temperature positive anomalies related with May 2008 Wenchuan earthquake sequence. _IEEE Trans. Geosci. Remote Sens._ 59, 1903–1916 (2021). Article Google
Scholar * Hersbach, H. et al. The ERA5 global reanalysis. _Q. J Roy. Meteor. Soc._ 146, 1999–2049 (2020). Article Google Scholar * Belmonte, M. R. & Stoffelen, A. Characterizing
ERA-interim and ERA5 surface wind biases using ASCAT. _Ocean. Sci._ 15, 831–852 (2019). Article Google Scholar * Tharstarson, H. T., Fetzer, E. J. & Ray, S. _Overview of the AIRS
Mission: Instruments, Processing Algorithms, Products, and Documentation_. (Jet Propulsion Laboratory, 2021). * Rabus, B., Eineder, M., Roth, A. & Bamler, R. The shuttle radar topography
mission-a new class of digital elevation models acquired by spaceborne radar. _ISPRS J. Photogrammetry Remote Sens._ 57, 241–262 (2003). Article Google Scholar * Delgado, A. L. et al.
Structural uncertainty in air mass factor calculation for NO2 and HCHO satellite retrievals. _Atmos. Meas. Tech._ 10, 759–782 (2017). Article Google Scholar * Ma, Y., Liu, S., Wu, L. &
Xu, Z. Two-step method to extract seismic microwave radiation anomaly: case study of MS8.0 Wenchuan earthquake. _Earthq Sci._ 24, 577–582 (2012). Article Google Scholar Download
references ACKNOWLEDGEMENTS This research is jointly supported by the Special Project of Strategic Sci. & Tech. Innovation Cooperation (Grant Number 2023YFE0208000), the Key Program of
the National Natural Science Foundation of China (Grant Number 41930108), and the Central South University Graduate Student Independent Exploration and Innovation Project (Grant Number
2023ZZTS0440). AUTHOR INFORMATION AUTHORS AND AFFILIATIONS * School of Geosciences and Info-Physics, Central South University, Changsha, China Yifan Ding, Ziqing Wang, Wenfei Mao, Qiqi Zhang
& Lixin Wu * Laboratory of Geo-Hazards Perception, Cognition and Predication, Central South University, Changsha, China Yifan Ding, Ziqing Wang, Wenfei Mao, Qiqi Zhang & Lixin Wu *
School of Faculty of Social Sciences, University of Hong Kong, Hong Kong, China Yuan Qi Authors * Yifan Ding View author publications You can also search for this author inPubMed Google
Scholar * Ziqing Wang View author publications You can also search for this author inPubMed Google Scholar * Yuan Qi View author publications You can also search for this author inPubMed
Google Scholar * Wenfei Mao View author publications You can also search for this author inPubMed Google Scholar * Qiqi Zhang View author publications You can also search for this author
inPubMed Google Scholar * Lixin Wu View author publications You can also search for this author inPubMed Google Scholar CONTRIBUTIONS L.W., Y.D., and Y.Q. designed the framework of the
paper. Y.D. wrote the paper draft. Z.W. and L.W. carried out the mechanical analysis and polished the paper. W.M., Y.D., and Q.Z. completed the visualization. All authors have read and
agreed to the published version of the paper. CORRESPONDING AUTHOR Correspondence to Lixin Wu. ETHICS DECLARATIONS COMPETING INTERESTS The authors declare no competing interests. ADDITIONAL
INFORMATION PUBLISHER’S NOTE Springer Nature remains neutral with regard to jurisdictional claims in published maps and institutional affiliations. RIGHTS AND PERMISSIONS OPEN ACCESS This
article is licensed under a Creative Commons Attribution-NonCommercial-NoDerivatives 4.0 International License, which permits any non-commercial use, sharing, distribution and reproduction
in any medium or format, as long as you give appropriate credit to the original author(s) and the source, provide a link to the Creative Commons licence, and indicate if you modified the
licensed material. You do not have permission under this licence to share adapted material derived from this article or parts of it. The images or other third party material in this article
are included in the article’s Creative Commons licence, unless indicated otherwise in a credit line to the material. If material is not included in the article’s Creative Commons licence and
your intended use is not permitted by statutory regulation or exceeds the permitted use, you will need to obtain permission directly from the copyright holder. To view a copy of this
licence, visit http://creativecommons.org/licenses/by-nc-nd/4.0/. Reprints and permissions ABOUT THIS ARTICLE CITE THIS ARTICLE Ding, Y., Wang, Z., Qi, Y. _et al._ Characteristics and
mechanism of MBT anomaly of Karakum desert related with the Hindu Kush earthquake. _npj Nat. Hazards_ 2, 10 (2025). https://doi.org/10.1038/s44304-025-00060-z Download citation * Received:
21 October 2024 * Accepted: 06 January 2025 * Published: 31 January 2025 * DOI: https://doi.org/10.1038/s44304-025-00060-z SHARE THIS ARTICLE Anyone you share the following link with will be
able to read this content: Get shareable link Sorry, a shareable link is not currently available for this article. Copy to clipboard Provided by the Springer Nature SharedIt content-sharing
initiative