- Select a language for the TTS:
- UK English Female
- UK English Male
- US English Female
- US English Male
- Australian Female
- Australian Male
- Language selected: (auto detect) - EN
Play all audios:
Vulnerability to environmental hazards is spatially heterogeneous and dynamic. Static measures that are used to determine spatial heterogeneity in vulnerability are unable to capture
temporal dynamics. To complement research on vulnerability to extreme heat, we investigated temporal and spatial trends in availability and use of shade by pedestrians during extreme heat
events in a vulnerable neighborhood. Shade from trees and buildings calculated from LiDAR were paired with smartphone locations filtered to include outdoor pedestrians on an hourly basis for
control and extreme heat days to study behavioral patterns for neighborhood residents, non-residents, and the unhoused population. High-use pedestrian locations showed little difference in
activity between control and extreme heat days, especially during weekdays, but with greater variation on weekends. The results indicate inflexibility in space use, even during extreme heat.
Outdoor heat mitigation strategies should consider bringing shade to the people in heavily used locations, as pedestrian behavior is inelastic.
Spatio-temporal analysis of environmental hazards and their associated consequences for affected communities is an integral part of emergency response and mitigation planning1,2. Extreme
heat, for example, has the highest mortality rate of any weather-related hazard in the U.S3. and the conditions are projected to exacerbate globally4. One of the most effective ways to cool
people outdoors when it is hot outside in arid environments is to provide shade. All else equal, a person standing in the sun will feel up to 30°C hotter than someone standing in the shade
just a few feet away5. That is because shade reduces a person’s direct exposure to the sun’s longwave energy and prevents the sun from heating up nearby surfaces and radiating heat back at
their bodies6. Neighborhoods that lack sufficient shade to protect people from the sun, or “shade deserts”6, create excess heat stress for cities and their residents that reduces quality of
life and increases risk of morbidity and mortality. Moreover, disparities in tree canopy provisioning and features of the built environment mean that certain residents are disproportionately
exposed to sunlight during extreme heat events and oftentimes also have the least resources to adapt and mitigate the ill effects7.
The way that people experience heat at a hyper-local level is controlled by a different set of thermal dynamics than regional/city-scale heat islands. Heat at the hyper-local scale is
measured by ambient air and mean radiant temperature (MRT) and is driven by factors such as built form morphology, shade availability, and wind dynamics8. Distribution of urban heat is
inequitable as is the capacity to cope and adapt9. Thermal inequity patterns in cities mirror those of other environmental hazards such as air pollution10. In a similar fashion, vulnerable
populations live in neighborhoods that lack built form, and vegetation conducive to appropriate cooling. Thermally comfortable public spaces are vital to overall public health in dense urban
environments across all demographics and prolonged heat exposure is physiologically unsafe11,12.
Cities have used a variety of techniques in mitigation efforts from heat and resulting heat impacts including increasing greenspace, tree canopy, increasing albedo of surfaces, buildings,
and roofs, and implementation of cooling centers. While each strategy has its advantages and disadvantages, all are costly and require significant cooperation between public and private
jurisdictions. Additionally, the cost of mitigation techniques is not only costly financially but also high in resource cost especially in arid and semi-arid climates like the American
southwest. Yet, important nuances in the spatio-temporal dynamics of heat risk are not fully captured in existing methods of assessment. Studies show that policies prioritize hotter areas
and more socially vulnerable regions that are sometimes, but not always, co-located13. Moreover, vulnerability metrics frequently use census data, which ties assessment of demographic risk
factors to home addresses2. However, people are exposed to hot conditions when they travel for work, school, or leisure; activities that static assessments miss14. Moreover, the underlying
biophysical conditions that shape exposure to heat outdoors follow diurnal patterns: temperature and sun exposure generally peak midday to late afternoon depending on characteristics of the
built environment.
Advanced methods of assessing spatio-temporal dynamics demonstrate the importance of human movement in assessing a wide variety of social issues. For instance, the use of mobility data can
aid in assessing heat risk across exposure settings because it can capture spatio-temporal dynamics of human movement15,16. Scholarship has demonstrated that low-income populations live and
travel in areas that share disproportionate impacts of environmental hazards including heat17 and air pollution18. Research has traditionally focused on fixed location data such as social
data from local census, however this leads to an unrealistic representation and low accuracy in the description of thermal burden. Mobility data providing individual movement patterns have
begun to be used in the literature, first through surveys19, and public transit ridership data20,21, aggregated mobility data14, walking volume and climate conditions22,23 and thermal
comfort24.Other studies have simulated pedestrian movement based on extreme heat and built form within neighborhoods25, however this model could not be catered to every individual and thus
the accuracy suffers. Mobile phone location data can track individuals beyond use of public transit and facilities, showing a more complete representation of a person’s day and where they
could be vulnerable to the ill effects of extreme heat. Knowing true pedestrian travel activity is pertinent to distribution of limited resources for adaptation and mitigation.
We assess the role of mobility in environmental hazard risk with a focus on extreme heat. Specifically, we question the relationship between the dynamic distribution of biophysical risk
factors (e.g., shade)5,26, and the equally dynamic distribution of a sensitive group (e.g., pedestrians). We characterized spatial and diurnal patterns in shade production and pedestrian’s
mobility during typical summer days and extreme heat events to create a spatio-temporal analysis of individual heat exposure variability. We implemented this approach for the joint analysis
of shade and mobility, and to test whether pedestrians gravitate toward shade during extreme heat events when both shade and sunlight are available in a vulnerable neighborhood in Los
Angeles, California with low vegetation (Fig. 1A).
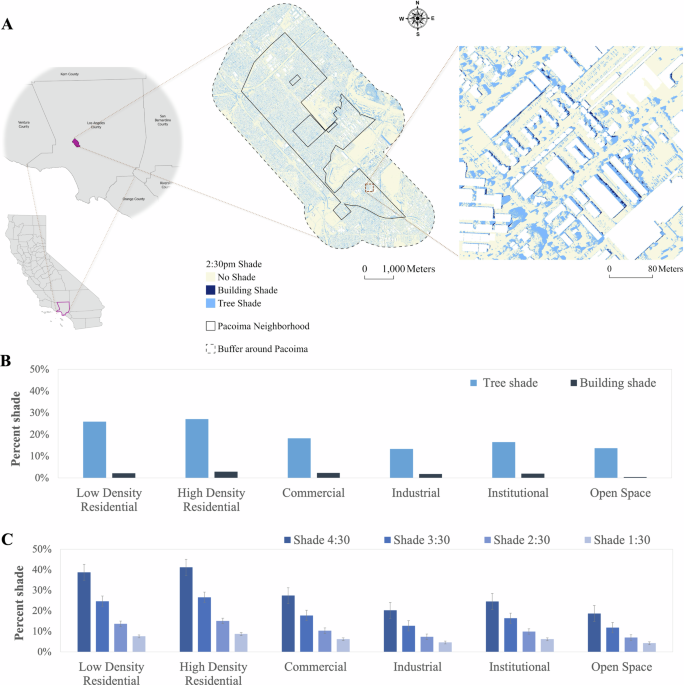
A Shade cast in Pacoima at 2:30 pm including shade from buildings and trees, with an inset of magnified view (created in ArcGIS Pro using TIGER/Line shapefiles from the U.S. Census); B
Average percent shade available by land use and shade type; and C Percent shade available by land use and time of the day in hourly intervals from 1:00 pm to 5:00 pm (Error bars indicate
standard error of the means; plotted in Microsoft Excel). (Note: Land use codes are provided in Supplementary Table 1).
Our study area is Pacoima (Fig. 1A), as one of the most vulnerable and most impacted regions in Los Angeles County. Pacoima is one of the oldest neighborhoods in the San Fernando Valley
region of the City of Los Angeles. It has >73,000 population (about 16,600 households) with a diverse community that is majority Latino (85.6%) and African American (7%)27. About 56% of
Pacoima is residential, 19% is industrial, 4% is commercial, and 4% is open spaces and parks [calculated from SCAG 2019]. The walkability score of Pacoima is 61 (on a scale of 25–100) which
is a little lower than Los Angeles’ score of 6928.
The average tree canopy coverage is 20% of land area in Pacoima26. More than half of the neighborhood’s area has high potential for tree canopy cover improvements, as the existing percent is
low and possible percent is high29. According to FEMA’s National Risk Index, the Risk Index for Pacoima is Very High to Relatively High, the Social Vulnerability varies between Relatively
High to Very High, and the Community Resilience is Very Low30. Additionally, the Pacoima/Sunland area has experienced a 25–39% reduction in green cover on all single-family lots31, and the
average annual days exceeding 95 degrees Fahrenheit is projected to increase five times more than present time32, in other words, there will be less shade and more heat exposure.
Pedestrians’ daily activities are a defining factor in their intersection with shaded areas. Shade area expands after local noon, and the proportion of pedestrians in shade corresponds with
this pattern. At two scales (point and hexagon-grid polygons) pedestrian use of shade was similar and was inelastic in relation to shade coverage. On weekends, however, fewer individuals
used outdoor spaces during heat events in comparison with control days (significant in a difference of means t-test, p


:max_bytes(150000):strip_icc():focal(959x292:961x294)/Anne-Heche-crash-080622--2000-eb97e43d8ba94f0caf8b7d06312a9def.jpg)