- Select a language for the TTS:
- UK English Female
- UK English Male
- US English Female
- US English Male
- Australian Female
- Australian Male
- Language selected: (auto detect) - EN
Play all audios:
Lithium–sulfur batteries are based on complex chemical reactions involving solid–liquid–solid phase transitions. Now, a ternary diagram that describes the thermodynamic stability of the
different phases formed during lithium–sulfur reactions is established. You have full access to this article via your institution. Download PDF Lithium-ion batteries are based on
intercalation of lithium ions and have an energy density of ~250 Wh kg–1. By contrast, conversion reactions in lithium–sulfur (Li–S) batteries enable a much higher theoretical energy density
(2,600 Wh kg–1). However, to achieve a high energy density in Li–S batteries, 16 electrons must be transferred during the conversion of sulfur to lithium sulfide (Li2S), which leads to
sluggish kinetics1. Ether-based electrolytes in Li–S batteries improve the reaction kinetics by allowing solid sulfur to form soluble lithium polysulfides (LiPS; Li2S_x_, 2 ≤ _x_ ≤ 8) that
enable stepwise solid–liquid–solid conversion pathways2. Recent studies have sought to elucidate the catholyte intermediates (LiPS formed near the cathode) and reaction pathways using in
situ techniques (such as Raman spectroscopy3 and transmission electron microscopy4), but a comprehensive understanding of sulfur redox reaction thermodynamics is lacking. Now, writing in
_Nature Chemical Engineering_5, Qiang Zhang, Bo-Quan Li and co-workers describe a ternary phase diagram that sheds new light on the ‘black box’ of the thermodynamically stable products
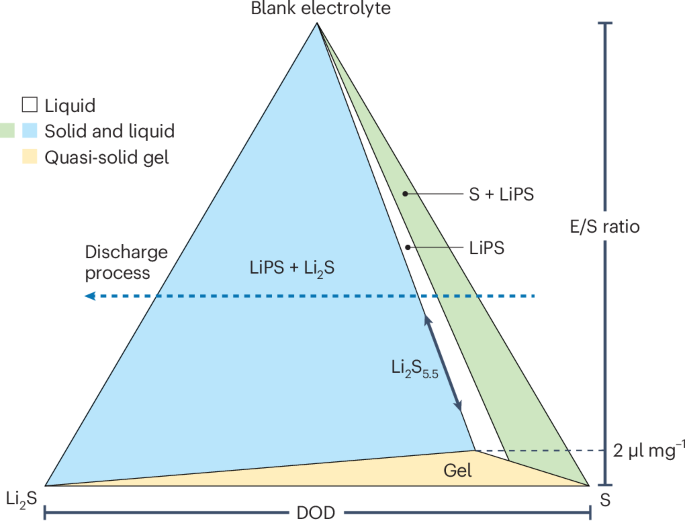
formed in Li–S battery systems. They suggest that at a given battery state (fixed electrolyte-to-sulfur (E/S) ratio and depth of discharge), the ternary phase diagram can be used to
determine the equilibrium forms of sulfur, LiPS and Li2S (Fig. 1). The vertices of the ternary phase diagram are blank electrolyte, the starting sulfur powder, and Li2S (the solid discharge
product formed in the Li–S battery). It should be noted that, despite being a mixture, the blank electrolyte with a fixed composition represents a pure phase. The authors indicate that all
the possible LiPS species found in Li–S chemistry can be obtained by these three components, because the valence of sulfur in the sulfur powder (S0) and Li2S (S2–) corresponds to its highest
and lowest chemical state, respectively. The LiPS concentration is determined by the solvent fraction. The ternary phase diagram was constructed by quantifying the sulfur concentration for
a series of LiPS solutions by titration after reaching equilibrium. A critical E/S ratio was found to be ~2 μl mg–1, below which the system forms a gel rather than being in the normal liquid
and/or solid phases. For E/S ratios greater than 2 μl mg–1, the diagram features two two-phase regions, where liquid LiPS coexists with either supersaturated solid sulfur or Li2S, and one
single-phase region containing only soluble LiPS. The authors found that the boundary between the two regions — which represents the equilibrium solution phase — is Li2S5.5 rather than the
generally believed Li2S4. This suggests that low-order LiPS species (such as Li2S4) are not in thermodynamic equilibrium states and tend to disproportionate into solid Li2S and soluble
higher-order LiPS. This coexistence of two phases is consistent with both the solubility limit6 of 0.1 M for Li2S4 and the premature deposition7 of LiPS reported in previous studies. The
thermodynamic instability of Li2S4 is also supported by recent in situ measurements. For example, in situ Raman spectroscopy3 showed that Li2S6 is formed by a comproportionation reaction
between Li2S4 and Li2S8, and the direct conversion of soluble LiPS to Li2S without the formation of low-order LiPS was observed by in situ transmission electron microscopy4. Furthermore, the
phase boundary of Li2S5.5 determines the theoretical ratio between two discharge plateaus to be 1:4.5 rather than the commonly accepted ratio of 1:3. The authors also show a gelation region
in the phase diagram when the sulfur concentration exceeds 20 M (E/S ratio less than ~2 μl mg–1). This region is of practical importance because the high-energy-density advantage of Li–S
batteries requires a minimal volume of electrolyte. However, studies have shown that both interfacial charge transfer kinetics8 and ion conduction9 dramatically decrease at lean electrolyte
conditions due to the formation of the high-viscosity gel at E/S ratios <2 μl mg–1. Zhang, Li and colleagues show that this quasi-solid gel is pure LiPS intermediates without undissolved
sulfur or Li2S. Further analysis of the gel structure reveals that the crosslinking and clustering behavior of LiPS species is responsible for the increased electrolyte viscosity. These
findings provide thermodynamic insights into the recent advances in Li–S batteries3,4,7,8,9,10. The understanding can also inspire strategies for achieving high-energy-density Li–S cells
with lean electrolyte, for example by electrode9 or electrolyte10 design to reduce LiPS interactions and thereby reduce gelation. Having established the phase equilibrium diagram, the
authors additionally correlated the phase (chemical) equilibrium with the potential (electrochemical) equilibrium. For any assembled Li–S cells, the E/S ratio was fixed, and thus the
evolution of the cathode composition during the discharge process followed a horizontal line from the right side (0% depth of discharge) to the left side (100% depth of discharge) on the
phase diagram (Fig. 1). Two points of intersection with the phase boundaries (Li2S8 and Li2S5.5) determine the electrode equilibrium potentials. In a typical discharge curve, the phase
boundaries correspond to the reaction product at the end of the first plateau and the beginning of the second plateau, respectively. The fabricated pouch cells demonstrated that the
predicted discharge plateaus are in good agreement with the experimental thermodynamic curve measured by a galvanostatic intermittent titration technique. However, the charge process does
not show the characteristic plateaus, making it difficult to correlate to the phase diagram. In addition, the electrolyte–sulfur and electrolyte–Li2S interactions are simplified, and
therefore a better description of the activity coefficient based on the microstructure in solution could further improve the accuracy of the thermodynamic predictions. Overall, the work by
Zhang, Li and colleagues provides a useful tool to quantitatively understand the thermodynamics of Li–S batteries based on ether-based electrolytes. The phase equilibrium studies provide
insights into the solid–liquid–solid reaction pathways. Strategies for increasing the energy density of Li–S batteries by reducing the electrolyte volume will require the circumvention of
gelation. Although the established relationship between chemical and electrochemical equilibrium can predict the electrode potential at a given battery state, additional description of the
electrolyte–reactant interactions is required to enhance the reliability of the phase diagram. REFERENCES * Zhao, M., Li, B.-Q., Zhang, X.-Q., Huang, J.-Q. & Zhang, Q. _ACS Cent. Sci._
6, 1095–1104 (2020). Article CAS PubMed PubMed Central Google Scholar * Zhang, S. S. _J. Power Sources_ 231, 153–162 (2013). Article CAS Google Scholar * Liu, R. et al. _Nature_ 626,
98–104 (2024). Article CAS PubMed Google Scholar * Zhou, S. et al. _Nature_ 621, 75–81 (2023). Article CAS PubMed Google Scholar * Song, Y.-W. et al. _Nat. Chem. Eng._
https://doi.org/10.1038/s44286-024-00115-4 (2024). Article Google Scholar * Fan, F. Y. & Chiang, Y.-M. _J. Electrochem. Soc._ 164, A917–A922 (2017). Article CAS Google Scholar *
Chen, Z.-X. et al. _J. Energy Chem._ 82, 507–512 (2023). Article CAS Google Scholar * Chen, Z.-X. et al. _J. Am. Chem. Soc._ 145, 16449–16457 (2023). Article CAS PubMed Google Scholar
* Li, Z. et al. _Nat. Energy_ 8, 84–93 (2023). Article CAS Google Scholar * Gupta, A., Bhargav, A. & Manthiram, A. _Chem. Mater._ 33, 3457–3466 (2021). Article CAS PubMed PubMed
Central Google Scholar Download references AUTHOR INFORMATION AUTHORS AND AFFILIATIONS * Department of Materials Science and Metallurgy, University of Cambridge, Cambridge, UK Zhuangnan Li
& Manish Chhowalla Authors * Zhuangnan Li View author publications You can also search for this author inPubMed Google Scholar * Manish Chhowalla View author publications You can also
search for this author inPubMed Google Scholar CORRESPONDING AUTHORS Correspondence to Zhuangnan Li or Manish Chhowalla. ETHICS DECLARATIONS COMPETING INTERESTS The authors declare no
competing interests. RIGHTS AND PERMISSIONS Reprints and permissions ABOUT THIS ARTICLE CITE THIS ARTICLE Li, Z., Chhowalla, M. Mapping lithium–sulfur chemistry. _Nat Chem Eng_ 1, 563–564
(2024). https://doi.org/10.1038/s44286-024-00112-7 Download citation * Published: 02 September 2024 * Issue Date: September 2024 * DOI: https://doi.org/10.1038/s44286-024-00112-7 SHARE THIS
ARTICLE Anyone you share the following link with will be able to read this content: Get shareable link Sorry, a shareable link is not currently available for this article. Copy to clipboard
Provided by the Springer Nature SharedIt content-sharing initiative