- Select a language for the TTS:
- UK English Female
- UK English Male
- US English Female
- US English Male
- Australian Female
- Australian Male
- Language selected: (auto detect) - EN
Play all audios:
ABSTRACT Patients with coronavirus disease 2019 (COVID-19) present increased risk for ischemic cardiovascular complications up to 1 year after infection. Although the systemic inflammatory
response to severe acute respiratory syndrome coronavirus 2 (SARS-CoV-2) infection likely contributes to this increased cardiovascular risk, whether SARS-CoV-2 directly infects the coronary
vasculature and attendant atherosclerotic plaques remains unknown. Here we report that SARS-CoV-2 viral RNA is detectable and replicates in coronary lesions taken at autopsy from severe
COVID-19 cases. SARS-CoV-2 targeted plaque macrophages and exhibited a stronger tropism for arterial lesions than adjacent perivascular fat, correlating with macrophage infiltration levels.
SARS-CoV-2 entry was increased in cholesterol-loaded primary macrophages and dependent, in part, on neuropilin-1. SARS-CoV-2 induced a robust inflammatory response in cultured macrophages
and human atherosclerotic vascular explants with secretion of cytokines known to trigger cardiovascular events. Our data establish that SARS-CoV-2 infects coronary vessels, inducing plaque
inflammation that could trigger acute cardiovascular complications and increase the long-term cardiovascular risk. SIMILAR CONTENT BEING VIEWED BY OTHERS HDL-SCAVENGER RECEPTOR B TYPE 1
FACILITATES SARS-COV-2 ENTRY Article 26 November 2020 SARS-COV-2 ENVELOPE PROTEIN CAUSES ACUTE RESPIRATORY DISTRESS SYNDROME (ARDS)-LIKE PATHOLOGICAL DAMAGES AND CONSTITUTES AN ANTIVIRAL
TARGET Article Open access 10 June 2021 SARS-COV-2 INFECTION OF HUMAN PLURIPOTENT STEM CELL-DERIVED VASCULAR CELLS REVEALS SMOOTH MUSCLE CELLS AS KEY MEDIATORS OF VASCULAR PATHOLOGY DURING
INFECTION Article Open access 30 December 2024 MAIN Coronavirus disease 2019 (COVID-19), caused by severe acute respiratory syndrome coronavirus 2 (SARS-CoV-2), is uniquely marked by
extraordinary tissue tropism and an array of clinical presentations, from asymptomatic infection to acute respiratory distress, multi-organ failure and death1. Ischemic cardiovascular
events, such as acute myocardial infarction (AMI) and stroke, due to the underlying disruption of a chronically inflamed atherosclerotic plaque2, are established clinical complications of
COVID-19 (refs. 1,3). AMI and stroke can be triggered by several acute respiratory viral infections, including influenza virus4. However, patients with COVID-19 are >7-fold more likely to
have a stroke than patients with influenza5, and their risk for both AMI and stroke remains high for up to 1 year after infection6. The extreme inflammatory response that occurs in severe
cases of COVID-19, also known as cytokine storm7, is likely a contributor to the increased risk for AMI and stroke. However, the possibility that SARS-CoV-2 directly affects the coronary
vasculature, as documented for other distant organs (for example, kidney, gut, brain, adipose tissue and myocardium)8, remains largely unexplored. In the lungs, tissue damage is aggravated
by potent inflammasome activation in macrophages sensing SARS-CoV-2 virus9. A similar response in macrophages infiltrating arterial vessels affected by the virus could boost plaque
inflammation and risk for AMI and stroke in patients with COVID-19. Here we show, in coronary autopsy specimens from patients with COVID-19, that infiltrating macrophages were infected by
SARS-CoV-2. Lipid-laden macrophages (foam cells), a hallmark of atherosclerosis at all stages of the disease10, were more susceptible to SARS-CoV-2 infection than other macrophages, and this
was dependent on the receptor neuropilin-1 (NRP-1). SARS-CoV-2 induced a strong pro-atherogenic inflammatory response in both macrophages and foam cells, which was largely recapitulated in
an ex vivo SARS-CoV-2 infection of human vascular explants. This response may contribute to the ischemic cardiovascular complications in patients with COVID-19. SPATIAL AI DETECTS SARS-COV-2
RNA IN CORONARY MACROPHAGES We analyzed coronary autopsy specimens (_n_ = 27) from eight patients with RT–PCR-confirmed diagnosis of COVID-19 between May 2020 and May 2021. Demographics and
clinical characteristics, including past medical history, cardiovascular risk factors and other relevant clinical information, were obtained from the patients’ electronic medical records
and autopsy reports (IRB i21-01587) (Fig. 1a and Supplementary Tables 1 and 2). The mean age was 69.6 years (median, 71; 59–84), and 75% of patients were male (6/8). Patients had coronary
artery disease (8/8); three or more cardiovascular risk factors, such as hypertension (8/8), overweight or obesity (7/8), hyperlipidemia (7/8), type 2 diabetes (6/8) and chronic kidney
disease (4/8); and some had a history of either myocardial infarction (1/8) or ischemic stroke (1/8) (Fig. 1a and Supplementary Table 1). Acute myocardial ischemia was diagnosed during
hospitalization in three patients; one patient developed stroke; and four patients were found to have coronary stenosis (>50%) at autopsy. The patients, with the exception of one who was
pronounced dead before admission, were hospitalized for an average of 17.6 d (range, 8–31) (Supplementary Table 2). One patient (Pt. 1) was hospitalized three times (for a total of 31 d)
after the first diagnosis. Pt. 1 developed AMI and died during the third hospitalization, approximately 140 d after testing negative for COVID-19 (Fig. 1a and Supplementary Table 2). The
clinical presentation, in-hospital course of the disease, COVID-19 treatments as well as macroscopic and microscopic autopsy pathology obtained from hospital medical records and autopsy
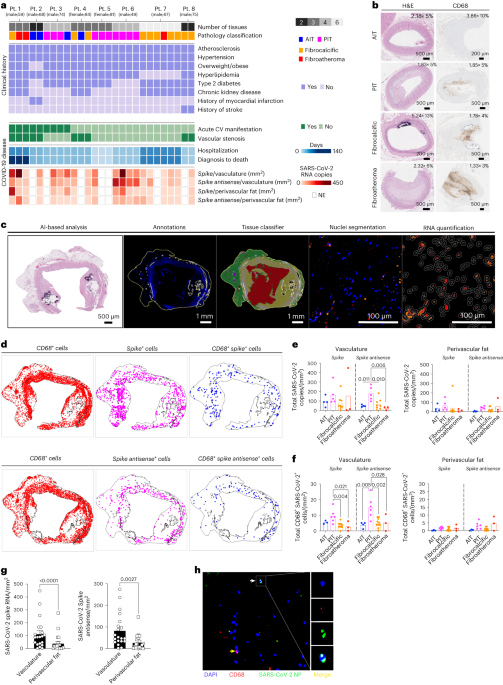
reports are summarized in Supplementary Table 2. Sections of coronary arteries from all autopsies were stained with hematoxylin and eosin (H&E) and classified by a clinical
cardiovascular pathologist (N.N.) as adaptive intimal thickening (AIT; _n_ = 4), pathological intimal thickening with macrophage infiltration (PIT; _n_ = 10), fibrocalcific plaque (_n_ = 10)
and fibroatheroma (_n_ = 3) (Fig. 1a,b, Extended Data Fig. 1a, Supplementary Fig. 1 and Supplementary Table 3) according to established criteria11,12. Detailed pathological features,
including presence of lipid pool, necrotic core and adventitial inflammation, were noted (Extended Data Fig. 1a). Immunohistochemical (IHC) staining for CD68+ cells showed that CD68+ cell
count and frequencies were not significantly different among PIT, fibrocalcific lesions and fibroatheromas, whereas a larger positive stained area that corresponded to the necrotic cores was
seen in fibroatheromas (Fig. 1b, Extended Data Fig. 1b,c and Supplementary Table 3). To identify SARS-CoV-2 viral RNA (vRNA) in the autoptic coronary vasculature from patients with
COVID-19, we performed RNA fluorescence in situ hybridization (RNA-FISH) analysis for the vRNA encoding the spike (S) protein. To establish whether SARS-CoV-2 infected the human coronary
vasculature, we also probed the antisense strand of the S gene (_S antisense_), which is only produced during viral replication. A CD68 probe was used to identify macrophages infiltrating
the coronary vessels in the same sections and establish the cellular localization of SARS-CoV-2 vRNA. Given the ability of SARS-CoV-2 to infect fat depots and accumulate vRNA in adipose
tissue to trigger a strong pro-inflammatory response13,14, we used a neural network artificial intelligence (AI) approach to classify the coronary arterial wall and perivascular fat in each
sample and nuclei segmentation to quantify the RNAscope probes in cells infiltrating the two tissues (Fig. 1c,d). In the coronary arterial wall, vRNA encoding the S protein and the antisense
strand of the S gene were detected to different degrees in all the sections from all patients, indicating the presence of vRNA and replicative activity of the virus. SARS-CoV-2 S gene copy
number was similar across AI, PIT, fibrocalcific and fibroatheroma coronary lesions (Fig. 1e). However, PIT coronaries showed a significantly higher copy number of the antisense strand of
the S gene (_S antisense_), indicating higher viral replication in the vascular wall of these lesions (Fig. 1e). In particular, CD68+ cells expressing both the SARS-CoV-2 S and the antisense
strand of S were significantly higher in the vasculature of PIT coronaries versus other pathologies (Fig. 1f). In perivascular fat, vRNA encoding the S protein was detected in 20 of the 21
sections, and the S antisense was detected in 19 of the 21 sections (Fig. 1a). Overall, each patient presented at least one section positive for S and S antisense vRNA (Fig. 1ae,f). Notably,
the amount of S and S antisense strand vRNA was significantly lower in perivascular fat than in the corresponding arterial wall across all samples (Fig. 1g). The accumulation of viral
protein material in the coronaries was confirmed by immunofluorescence (Fig. 1h). PIT arterial lesions, which appeared more susceptible to SARS-CoV-2 infection, contained significantly more
cells than other types of lesions and 4.8-fold more cells than corresponding perivascular tissue (2,691.8 ± 288.7 versus 697.6 ± 159.3 cells per mm2; _P_ < 0.0001) (Extended Data Fig.
1d). The number of CD68 RNA+ cells in the coronary vasculature was significantly higher in both PIT and fibroatheromas than in other lesions (Extended Data Fig. 1e), which corresponded to a
higher number of CD68 RNA+ cells in perivascular fat of PIT lesions than fibrocalcific lesions and similar to fibroatheromas (Extended Data Fig. 1e), suggesting a contributory role of direct
infection of macrophages in the coronary susceptibility to SARS-CoV-2 infection. This possibility was further suggested by the significantly higher frequency of CD68+ cells expressing the S
antisense strand of vRNA in PIT lesions and the corresponding perivascular fat (Extended Data Fig. 1f) as well as the significant association among SARS-CoV-2 vRNA copies with CD68 copy
number in both arterial wall and perivascular fat (Extended Data Fig. 1g). The accumulation of SARS-CoV-2 vRNA encoding the S protein was higher in both the whole tissue and in the coronary
wall from patients with COVID-19 with acute cardiovascular manifestations (Extended Data Fig. 1h). To investigate the potential extension of SARS-CoV-2 infection to other cells, we focused
on vascular smooth muscle cells (VSMCs), based on the spatial distribution of most SARS-CoV-2+ cells within the arterial wall of the coronaries, and we conducted additional RNAscope analyses
that were guided by analyses of human and mouse single-cell RNA sequencing (scRNA-seq) datasets. An analysis, using scRNA-seq data from diseased human coronaries (Gene Expression Omnibus
(GEO): GSE131780)15, revealed that VSMCs express significantly higher levels of _ACTA2_ compared to myeloid cells, whereas CD68 expression was specific to macrophages (Extended Data Fig.
2a). Additionally, we analyzed scRNA-seq data of lineage-tagged smooth-muscle-derived cells (VSMCs), isolated from the atherosclerotic aortic arches of ApoE−/− Tomato mice16. This analysis
revealed that VSMCs in atherosclerotic lesions did not express significant levels of _Cd68_ and maintained a high level of _Acta2_ expression, although its expression was reduced compared to
non-atherosclerotic conditions (Extended Data Fig. 2b). Based on these results, we used _ACTA2_ probe to identify VSMCs and macrophages of VSMC origin as _ACTA2_+, and we included probes
for the S and S antisense vRNA in the analysis to identify _ACTA2_+ infected cells. Notably, this analysis identified S+_ACTA2_+ cells and S antisense+_ACTA2_+ cells in human coronaries
(Extended Data Fig. 2c); however, the median of the frequency of SARS-CoV-2-infected VSMCs (~0.14%) in human coronary was ~8 times lower than that of infected macrophages (~1.2%). These
results show that, although SARS-CoV-2 can infect VSMCs, the number of infected VSMCs in human coronaries was lower compared to the number of infected macrophages. To further investigate
SARS-CoV-2 infection of VSMCs and lipid-laden VSMCs, which are associated with atherosclerosis17,18,19,20, we infected primary human aortic VSMCs, as well as VSMCs loaded with
cyclodextrin–cholesterol complexes (Extended Data Fig. 2d), with the SARS-CoV-2 USA WA1/2020 isolate. Approximately 18% of cultured VSMCs and 13% of cholesterol-loaded VSMCs were S+, and the
frequency of S antisense+_ACTA2_+ cells, indicating viral replication, was ~2.6% (Extended Data Fig. 2d,e). Taken together with our in vitro findings, which indicate that more than 79% of
macrophages and over 90% of foam cells are S+, along with the discovery that more than 40% of both cell types are S antisense+, these results show that, although SARS-CoV-2 can infect VSMCs,
macrophages are infected at a higher rate. SARS-COV-2 INFECTION OF HUMAN MACROPHAGES AND FOAM CELLS The accumulation of cholesterol-laden macrophages (foam cells) is a hallmark of
atherosclerosis at all stages of the disease, from early PIT to late fibroatheroma lesions10,12. To investigate SARS-CoV-2 infection of both macrophages and foam cells, we differentiated
human monocytes derived from human peripheral blood mononuclear cells into macrophages and treated them with oxidized low-density lipoprotein (oxLDL) complexed with Dil dye (Dil-Ox-LDL) to
differentiate them into foam cells. To experimentally confirm our observation that SARS-CoV-2 can infect human plaque macrophages, macrophages and foam cells were infected either with
icSARS-CoV-2 mNeonGreen (mNG) reporter virus, a modified virus that allows the use of mNG fluorescence as a surrogate readout for viral replication21, or with SARS-CoV-2 USA WA1/2020
isolate. mNG expression confirmed the ability of SARS-CoV-2 to replicate in both cell types, although replication was higher in foam cells (Fig. 2a and Extended Data Fig. 3a). The
significantly higher accumulation of nucleoprotein (NP) in foam cells compared to macrophages infected with SARS-CoV-2 USA WA1/2020 isolate (Fig. 2b and Extended Data Fig. 3b) confirmed a
higher susceptibility of foam cells to the virus. In fact, although the frequency of NP+ foam cells fell between 24 hours post-infection (hpi) and 48 hpi, the proportion of SARS-CoV-2 NP+
foam cells remained significantly higher than that of NP+ macrophages (Fig. 2b). Foam cells also accumulated more SARS-CoV-2 S vRNA than macrophages (Fig. 2c). SARS-CoV-2 vRNA genome was
detectable in both macrophages and foam cells as early as 2 hpi, remained high up to 24 hpi but was reduced at 48 hpi in both cell types (Fig. 2d and Extended Data Fig. 3d). Notably, the
expression of SARS-CoV-2 genes declined significantly faster in macrophages than foam cells, with significantly lower vRNA at 48 hpi (Fig. 2e). This dynamic temporal decay in vRNA levels
indicates that macrophages are able to clear the virus faster than foam cells. Regardless, albeit being susceptible, both macrophages and foam cells did not sustain a productive formation of
infectious viral particles as demonstrated by the results of the plaque assay using modified Vero E6 cells expressing the transmembrane protease serine 2 and human angiotensin-converting
enzyme 2 (Vero E6-TMPRSS2-T2A-ACE2). These assays showed a progressive decline of viral titer conditioned media from infected macrophages and foam cells (Fig. 2f and Extended Data Fig. 3c).
These results are consistent with abortive infection, a common outcome of many viral infections, with infected cells not producing replication-competent virus despite the production of
vRNA22,23,24,25,26. SARS-COV-2 TRIGGERS PRO-ATHEROGENIC INFLAMMATORY RESPONSES Based on the observation that SARS-CoV-2 replication was abortive in macrophages and foam cells and the
evidence that the overreactive inflammatory response to SARS-CoV-2 is orchestrated by macrophages in other tissues9,14,27, we investigated the immune response of macrophages and foam cells
to SARS-CoV-2. Differential gene expression analysis of RNA-seq data from infected macrophages and foam cells identified shared and unique transcriptional signatures (Fig. 2g). As expected,
the 1,254 shared genes included the SARS-CoV-2 viral genes. Other commonly upregulated genes were involved with antiviral responses and SARS-CoV-2 infection, including interferon (IFN)
signaling pathways and antiviral processes by type I and II IFN signaling, oligoadenylate synthetase (OAS) antiviral response, negative regulation of viral replication and viral lifecycle as
well as complement activation and cytokine signaling. ISG15 antiviral signaling, which dampens IFN signaling and has been implicated in the hyperinflammatory response associated with
COVID-19 severity27,28, was also upregulated in both cell types (Fig. 2g and Extended Data Fig. 3e). Infected macrophages expressed a unique transcriptional signature associated with
classical complement cascade activation, complement cascade (Fig. 2g and Extended Data Fig. 3f) as well as IFN-γ signaling and its regulation and IL-27 signaling, which induces
IFN/STAT1-dependent genes29 and regulation of cytokine pathways (Fig. 2g). We also observed a significant upregulation of certain lysosomal genes in infected macrophages compared to foam
cells at 2 hpi and 8 hpi (Extended Data Fig. 3g,h), revealing a more robust lysosomal response in macrophages that can contribute to the more efficient viral clearance observed in
macrophages. Our analysis showed a significant increase in genes encoding proteins involved in lipid uptake in infected macrophages versus foam cells (Fig. 2g and Extended Data Fig. 3i).
These included _CD36_, encoding for the CD36 receptor for oxLDL, as well as _LDLR_, encoding LDL receptor, which is the primary cholesterol-carrying lipoprotein in plasma and facilitates the
uptake of LDL into cells through endocytosis. In contrast, genes encoding proteins associated with lipid efflux (that is, _ABCG1_ and _ABCA1_) were significantly downregulated in infected
macrophages compared to foam cells (Extended Data Fig. 3i). Lipids and lipid droplets play crucial roles in viral lifecycle, including SARS-CoV-2 (refs. 30,31,32). By promoting lipid uptake
and accumulation in macrophages, SARS-CoV-2 may create a cellular environment that is favorable for viral infection. The unique infected foam cell transcriptional signature included 570
genes (Fig. 2g and Extended Data Fig. 2e). The top upregulated signaling pathways involved the downregulation of major histocompatibility complex class I (MHC-I), a response induced by many
viruses to evade immune recognition33,34. Infected foam cells also upregulated processes and signaling pathways involved in the regulation of lipid metabolism that may facilitate viral entry
and replication32. The activation of a type I IFN response in both SARS-CoV-2-infected macrophages and foam cells was consistent with the upregulation of several genes, with the strongest
response observed at 8 hpi (Fig. 2h and Extended Data Fig. 3e). In macrophages, significantly upregulated genes included _IRF1_, a transcriptional activator of IFN-α and IFN-β, as well as
genes induced by IFN-α, IFN-β and IFN-γ; _MX1_, encoding a GTP-binding protein Mx1 that has antiviral activity against RNA viruses, including SARS-CoV-2 (refs. 35,36); as well as _STAT1_ and
_STAT2. IRF7_, known to induce type I IFN responses, and the viral restriction factor _IFITM1_ (ref. 37), were also upregulated in SARS-CoV-2-infected macrophages (Fig. 2h). The IFN
response in SARS-CoV-2-infected foam cells was similar, although there was a delayed upregulation of _MX1_ that occurred only at 48 hpi, consistent with the higher vRNA and protein
accumulation seen in foam cells, and only foam cells upregulated _IRF4_, which inhibits MyD88 signaling and is expressed in M2-like macrophages38. Moreover, the expression of _STAT1_ and
_STAT2_ were not significantly increased (Fig. 2h), suggesting a distinct IFN-induced JAK/STAT signaling regulation in infected macrophages. A direct comparison between infected macrophages
and infected foam cells confirmed a stronger IFN response in macrophages compared to foam cells with a significant upregulation of _JAK1_ at 2 hpi and of _MAVS_, encoding mitochondrial
antiviral signaling protein that is essential for antiviral innate immunity39,40,41, at 8 hpi (Fig. 2i). The analysis of the dynamic changes in the IFN-I response between macrophages and
foam cells using an IFN and SARS-CoV-2 gene signature scoring method (Methods) revealed important kinetic differences in the IFN response and SARS-CoV-2 gene expression between macrophages
and foam cells (Fig. 2j). Although from 2 hpi to 24 hpi there was no significant difference in the SARS-CoV-2 genome score between infected macrophages and foam cells, at 48 hpi a
significant reduction in the SARS-CoV-2 genome score was observed in macrophages but not in foam cells, indicative of differential vRNA stability. In parallel, the IFN-I score increased in
both infected macrophages and foam cells, but foam cells displayed a significant decline in the IFN-I score at 24 hpi and 48 hpi. Given the well-established knowledge that type I IFN reduces
SARS-CoV-2 infection and replication, thereby promoting viral clearance42,43,44,45, the robust and sustained type I IFN response in macrophages likely contributes to decreased viral
persistence. In addition, macrophages and foam cells did not show differences in apoptotic pathway activation, such as Caspase-8 secretion (Extended Data Fig. 3j). Several pro-inflammatory
and pro-atherogenic cytokine and chemokine genes were significantly upregulated in both infected macrophages and foam cells (Extended Data Fig. 4a,b). These included _CCL7_, _TNFSF10_ (also
known as _TRAIL_), _CXCL10_ and _CCL3_. Infected macrophages uniquely upregulated _CXCL9_, _CXCL12_ and _CLEC11A_, whereas foam cells upregulated _TNFA_, _CCL5_ and _CCL2_. To further
investigate the inflammatory profile of macrophages and foam cells in response to SARS-CoV-2 infection, we quantified the secretion of cytokines and chemokines for up to 48 hpi (Fig. 3 and
Extended Data Fig. 4b). Several pro-inflammatory and pro-atherogenic cytokines (for example, IL-6, CCL7, IL-1β, β-NGF, IL-3, LIF, MIF, CXCL9, IFN-α and IFN-γ) were released by both infected
macrophages and foam cells (Fig. 3a). Among these are key cytokines known to trigger ischemic cardiovascular events, including IL-6, a candidate therapeutic target in ongoing clinical
trials46, and IL-1β, whose inhibition reduced secondary cardiovascular events in high-risk post-myocardial infarction patients47 (Fig. 3b). Moreover, the release of macrophage migration
inhibitory factor (MIF), a pro-atherogenic and inflammatory cytokine that has been implicated in intima-media thickening, lipid deposition and plaque instability48, was increased in both
cell types after infection. This analysis also revealed differential expression patterns of secreted cytokines by macrophages and foam cells in response to SARS-CoV-2 infection, suggesting
distinct inflammatory responses between macrophages and foam cells. For example, the pro-atherogenic cytokine IL-18 (ref. 49) was significantly released by infected macrophages but not foam
cells, whereas IFN-α2, a type I IFN response cytokine that inhibits viral replication50, was significantly released by infected foam cells but not macrophages (Extended Data Fig. 4b).
Notably, we detected significant differences in release of many of these cytokines over time between uninfected macrophage and foam cells, suggesting that differences in the baseline
inflammatory status of each cell type influence their responses to the virus (Fig. 3b and Extended Data Fig. 4b). SARS-COV-2 BOOSTS INFLAMMATION OF ATHEROSCLEROTIC VASCULAR EXPLANTS To
determine whether the macrophage and foam cell pro-inflammatory response to SARS-CoV-2 that we observed in vitro also occurs in human vascular tissue, we infected human atherosclerotic
vascular explants with SARS-CoV-2 USA WA1//2020 isolate (Fig. 4a). SARS-CoV-2 vRNA encoding the structural proteins spike (S), envelope (E), membrane (M) and nucleocapsid (N), as well as
open reading frames (ORFs) encoding non-structural accessory proteins, were detectable in infected plaques as early as 24 hpi and for up to 72 hpi (Fig. 4b). S and N protein expression and
virus-like particles were observed in infected atherosclerotic plaques (Extended Data Fig. 5a,b). However, viral titer decreased over time with no infectious virus isolated from the
conditioned media of either infected cells or tissues using a plaque assay up to 72 hpi, suggesting abortive replication in the vascular explants (Fig. 4c). Regardless, SARS-CoV-2 infection
induced a strong type I IFN transcriptional response in infected plaques reflected by the early upregulation of transcription factors and genes involved in response to viral infections, such
as _IRF7_, _JAK1_ and _IFITM1_ at 2 hpi; _IFNAR_, _IRF4_, _IRF1_, _MX1_, _PTPN6_, _IFNA1_, _STAT1_ and _STAT2_ at 24 hpi; _IRF1_, _IFNA7_ and _IFI35_ at 48 hpi; and _IFNA16_ at 72 hpi.
Genes involved in the negative regulation of IFN signaling (that is, _SOCS1_ and _SOCS3_) were also upregulated, likely reflecting the activation of regulatory signaling (Fig. 4d).
Interestingly, SARS-CoV-2 infection triggered the expression of viral receptors and entry factors, such as _ACE2_, _NRP1_, _FURIN_, _TMPRSS4_, _TMPRSS11A and CTSB_ at 24 hpi, suggesting that
the virus facilitates its own entry in host cells (Fig. 4e). SARS-CoV-2 also initiated a transcriptional pro-inflammatory response that largely recapitulated that seen in cultured
macrophages and foam cells. This included the upregulation of pro-atherogenic cytokines, such as _IL1B_, _IL6_, _MIF_, _ILB_, _TNF_, _IL7_ and _CCL5_, as well as chemokines, such as _CCL2_,
_CCL3_, _CCL4_, _CCL5_, _CXCL9_, _CCL27_, _CCL7_, _CCL6_, _CXCL1_, _CXCL8_, _CXCL9_ and _CXCL12_. Anti-inflammatory cytokines, such as _IL10_ and _IL13_, were downregulated, further
supporting a strong pro-atherogenic inflammatory response to SARS-CoV-2 infection in human atherosclerotic plaques (Fig. 4f and Extended Data Fig. 5c). Analysis of the secretome of infected
plaques revealed similar pro-inflammatory protein changes (Fig. 4g). SARS-CoV-2-infected plaques released several pro-atherogenic cytokines and chemokines, including IL-6, IL-1β and IFN-α2,
as well as CCL2, CCL3, CCL4 and CCL7 (Fig. 4g). The release of cytokines and chemokines was substantially higher at 72 hpi. However, only IL-6, IL-1β, IFN-α2 and CCL3 were secreted at
significantly higher amounts over time calculated as area under the curve (AUC) (Fig. 4h and Extended Data Fig. 5d). A stronger inflammatory response was observed in SARS-CoV-2-infected
atherosclerotic plaques versus non-atherosclerotic paired surgical margins, as shown by the significantly higher release of several cytokines (for example, IFN-γ, IFN- α2, IL-1β, IL-17,
TNF-α, TNF-β, CCL3, CCL4 and CCL7) from infected plaques mainly at 48 hpi (Fig. 4i). These findings suggest that SARS-CoV-2 infection triggers a hyperactivated immune response mainly within
atherosclerotic lesions, a response that could contribute to the increased risk of ischemic cardiovascular events in patients with COVID-19 with underlying atherosclerosis. NRP1+ MACROPHAGES
INCREASE PLAQUE SUSCEPTIBILITY TO SARS-COV-2 To elucidate the vascular susceptibility to SARS-CoV-2 infection, we evaluated the expression of the main viral entry receptors and co-factors
in the aorta, coronary and tibial arteries using gene expression data publicly available from the Genotype-Tissue Expression (GTEx) project (https://gtexportal.org/home/). The lung, heart
tissue and whole blood were also included in this analysis (Extended Data Fig. 6a,b). We specifically focused on _ACE2_, encoding the first reported receptor for SARS-CoV-2 entry into human
cells; neuropilins (_NRP1_ and _NRP2_); and the proteases _TMPRSS2_, _FURIN_, cathepsin B (_CTSB_) and cathepsin L (_CTSL_), required to cleave the S protein for viral entry and
replication51,52,53,54. Bulk RNA sequencing (RNA-seq) analysis showed a similar expression pattern for _ACE2_, _NRP1_, _NRP2_, _FURIN_ and _CTSB_ and _CTSL_ in the aorta, coronary and tibial
arteries compared to the lung, with the exception of _TMPRSS2_, which was expressed at lower levels in the arteries (Extended Data Fig. 6b). To investigate the cellular expression of
SARS-CoV-2 receptor and entry factors in the human atherosclerotic tissue, we performed an integrated scRNA-seq analysis of human carotid plaques from 10 patients undergoing carotid
endarterectomy (CEA) and atherosclerotic coronary data obtained from seven coronary samples from four heart transplant cases publicly available in the GEO (GSE131780) (Fig. 5a)15. The two
datasets were merged using the Harmony algorithm, resulting in 16 subclusters of immune cells that corresponded to all major immune population infiltrating human atherosclerotic plaques
(Extended Data Fig. 6c). The SARS-CoV-2 entry receptors and host entry factors such as _NRP1_, a SARS-CoV-2 receptor that can bind FURIN-cleaved S protein to facilitate SARS-CoV-2 viral
entry, and the proteases _CTSB_ and _CTSL_ were highly expressed in myeloid subclusters, whereas _ACE2_ and the transmembrane serine proteases _TMPRSS2, TMPRSS4, TMPRSS11A_ and _TMPRSS11B_
were either undetectable or expressed at low levels (Extended Data Fig. 6d). Based on this observation, we subclustered myeloid cells (Fig. 5b and Extended Data Fig. 6e) and identified two
clusters of dendritic cells (DCs), three clusters of monocytes/macrophages, one cluster of mixed myeloid cells and four clusters of macrophages/foam cells that were annotated based on the
expression of canonical markers (Extended Data Fig. 6f). To identify significant differences in the abundance of myeloid cells between carotid and coronary arteries, we performed Milo
differential neighborhood abundance testing55. This analysis revealed that _TREM2__+_ macrophages were enriched in coronary tissue, whereas _VCAN_+ monocytes/macrophages and CD1c+ DCs were
enriched in carotid samples. _CD16_+ monocytes, inflammatory monocyte/macrophages, _IL1B__+_ DCs and _CD36_+ mixed myeloid cells were exclusively present in carotid samples, whereas _LYVE1_+
macrophages were present in coronaries. _SPP1_+ macrophages were present in both tissues (Fig. 5c). Overall, _NRP1_ was strongly expressed in _TREM2_+, _SPP1_+, _LYVE1_+ and IFN-stimulated
gene (_ISG_)+_TREM2+_ macrophages, clusters that also expressed _FURIN. ACE2_ and _TMPRSS2_ were undetectable in the analyzed myeloid cells (Fig. 5d). _NRP1_ and _FURIN_ gene expression was
higher in human atherosclerotic plaques compared to paired normal margins (Fig. 5e), suggesting a key role for NRP-1 in mediating SARS-CoV-2 infection of the atherosclerotic vasculature.
Spatial RNA-FISH analysis of human coronary autopsy specimens from patients with COVID-19 confirmed that macrophages expressing _NRP1_ (_CD68_+_NRP1_+ cells) infiltrated coronary lesions and
that these cells also expressed SARS-CoV-2 S vRNA and the antisense strand of the S gene, indicating viral replication (Fig. 5f,g). A higher number of _NRP1_+ macrophages expressing the
antisense strand of the S gene were found in PIT coronary lesions, consistent with the greater susceptibility of PIT lesions to infection (Fig. 5g). Given that _NRP1_ was highly expressed in
_TREM2__+_ macrophages, which are considered foamy plaque macrophages56, and it was significantly higher in foam cells versus macrophages in vitro (Fig. 5h), we performed additional
experiments using silencing RNA (siRNA) to specifically inhibit NRP-1 expression and investigate its impact on SARS-CoV-2 infection (Fig. 6a,b and Extended Data Fig. 7a–f). We achieved
efficient reduction (~80%) of _NRP1_ gene expression in both macrophages and foam cells, which was confirmed by western blotting and RNAscope analysis (Extended Data Fig. 7a–d and
Supplementary Fig. 2). Upon _NRP1_ silencing of infected cells, we observed a significant decrease in the frequency of SARS-CoV-2 S antisense+ macrophages and foam cells as well as a reduced
frequency of SARS-CoV-2 S+ foam cells (Fig. 6a and Extended Data Fig. 7e). These findings were confirmed using EG00229, a small molecule that prevents SARS-CoV-2 binding to the B1 domain of
NRP-1 and reduces SARS-CoV-2 infection of cell lines53,54 (Fig. 6b and Extended Data Fig. 7f). We next asked whether _NRP1_ silencing or blocking using EG00229, which reduced the infection
of macrophages and foam cells in vitro, would reduce the inflammatory response to SARS-CoV-2. The results revealed that NRP1 silencing increased the baseline inflammatory state of uninfected
macrophages and, to a lesser extent, of foam cells, as evidenced by the release of several cytokines and chemokines (Extended Data Fig. 8a). Notably, this inflammatory state persisted upon
SARS-CoV-2 infection, with infected _NRP1_-silenced cells exhibiting higher levels of cytokines induced by the virus, such as IL-6 and MIF, compared to non-infected NRP1-silenced cells (Fig.
6c and Extended Data Fig. 8a). In foam cells, NRP-1 silencing had more modest effects on both uninfected and infected cells, with the release of inflammatory cytokines primarily driven by
SARS-CoV-2 infection (Fig. 6 and Extended Data Fig. 8a). The results are consistent with the anti-inflammatory functions of NRP-1 in myeloid cells and increased inflammation when NRP1
expression is lost57,58. Interestingly, the use of EG00229 yielded similar inflammatory patterns, but some differences may suggest potential off-target effects associated with this inhibitor
(Fig. 6d). To investigate the potential modulation of TGF-β by _NRP1_ inhibition, we examined the secretion of TGF-β in infected macrophages and foam cells (Extended Data Fig. 8b).
Although, in macrophages, TGF-β expression was unaffected by SARS-CoV-2 infection, and the inhibition of NRP-1 did not influence its expression, we observed an increase in TGF-β levels in
infected foam cells due to SARS-CoV-2 infection that was partially reduced by NRP-1 inhibition. NRP-1 blocking increased the release of secreted IL-6 and CCL2 from SARS-CoV-2-infected human
atherosclerotic vascular explant tissue. The release of IL-1β and IL-18 was also increased but not significantly (Fig. 6e). Taken together, these findings suggest that atherosclerotic
plaques are particularly susceptible to SARS-CoV-2 infection, which triggers a hyperactivated immune response that could contribute to the increased risk of ischemic cardiovascular events in
patients with COVID-19 with underlying atherosclerosis. Although inhibiting the host entry factor NRP-1 expressed by macrophages infiltrating coronary lesions in humans reduced SARS-CoV-2
infection, it also induced a strong inflammatory response, indicating that alternative strategies will be necessary to prevent SARS-CoV-2 infection of coronary vessels and its downstream
consequences. DISCUSSION Although SARS-CoV-2 is considered a respiratory virus, patients with COVID-19 have been shown to be at increased risk of cardiovascular complications, including
myocardial infarction and stroke. Our study provides evidence of SARS-CoV-2 presence in human coronary vasculature and demonstrates viral tropism for vascular lesion macrophages in
individuals with severe COVID-19. We found evidence of SARS-CoV-2 replication in all analyzed human autopsy coronaries regardless of their pathological classification, although viral
replication was highest in PIT coronary lesions—early-stage lesions that progress to more advanced atherosclerotic plaques11,12. It is well established that, as lesions progress to more
advanced stages, such as fibroatheromas and fibrocalcific plaques, macrophages and foam cells become dysfunctional due to prolonged exposure to lipids and an inflammatory
microenvironment11,12. In early PIT lesions, macrophages attempting to clear inflammatory lipids (for example, oxLDLs) accumulate excess cholesterol, and triglycerides within cytoplasmic
lipid droplets12 may be more prone to viral infection. SARS-CoV-2 showed a stronger tropism for the arterial lesions than corresponding perivascular fat, which was related to the degree of
macrophage infiltration, consistent with the higher viral replication in PIT lesions and fibroatheromas, where macrophages are more prevalent. Others previously reported the presence of
SARS-CoV-2 vRNA within the heart and the aorta as well as other distant organs8,14,59,60. Our data conclusively demonstrate that SARS-CoV-2 is capable of infecting and replicating in
macrophages within the coronary vasculature of patients with COVID-19. Furthermore, SARS-CoV-2 preferentially replicates in foam cells compared to other macrophages, due to a reduced type I
IFN response that leads to vRNA and viral protein accumulation, suggesting that these cells might act as a reservoir of SARS-CoV-2 viral debris in the atherosclerotic plaque. Our results
demonstrate that, although type I IFN response remained elevated in SARS-CoV-2-infected macrophages, indicating a sustained antiviral state, infected foam cells exhibited only a transient
expression of type I IFN gene expression. Together with the reduced expression of lysosomal genes and lower inflammatory response to SARS-CoV-2 infection, the reduced type I IFN may
contribute to the persistence of SARS-CoV-2 observed in the analyzed atherosclerotic autopsy specimens. Macrophages residing in vascular tissue can undergo self-renewal, contributing to
their long-term maintenance61, and, in heart transplant studies, it has been shown that cardiac macrophages have a half-life of 8.8 years62. Therefore, it is possible that macrophages may
act as reservoirs of SARS-CoV-2 vRNA in atherosclerotic plaques. We also identified infected VSMCs in coronary autopsy specimens. Although the number of infected VSMCs was lower than that of
infected macrophages, VSMCs have a half-life of 270–400 d63 and may contribute to SARS-CoV-2 persistence in the arterial wall. SARS-CoV-2 infection of macrophages and foam cells promoted a
strong inflammatory response characterized by release of cytokines implicated in both the pathogenesis of atherosclerosis and the increased risk of cardiovascular events, such as stroke and
myocardial infarction46,47,64. Using an ex vivo model of viral infection of human vascular explants, we found that atherosclerotic tissue could be directly infected by SARS-CoV-2, confirming
our observation in tissues of patients with COVID-19. As in cultured macrophages and foam cells, SARS-CoV-2 infection of vascular tissue triggered an inflammatory response and induced the
secretion of key pro-atherogenic cytokines, such as IL-6 and IL-1β. Considering that plaque inflammation promotes disease progression and contributes to plaque rupture, our results provide a
molecular basis for how SARS-CoV-2 infection of coronary lesions can contribute to the acute cardiovascular manifestations of COVID-19, such as myocardial infarction3,5. SARS-CoV-2
infection of coronaries was unrelated to pre-existing clinical characteristics, stage of COVID-19 by illness days, duration of hospitalization at the time of death or comorbidities. However,
we found a higher accumulation of SARS-CoV-2 S and S antisense vRNA in the coronary vasculature of the three patients with acute ischemic cardiovascular manifestations, including posterior
myocardial infarction (Pt. 1) and type II myocardial infarction (Pt. 2 and Pt. 3). Although evidence of coronary occlusion was not detected at autopsy for two patients with clinical
diagnosis of myocardial infarction, these data suggest that SARS-CoV-2 coronary infection may increase cardiovascular risk. A systematic analysis of GTEx, a multi-tissue gene expression
dataset that includes donors who died from cerebrovascular disease (>22%) and heart disease (>40%), revealed a similar expression pattern of SARS-CoV-2 receptors and co-factors in the
human vasculature as that found in the lungs. In particular, although _ACE2_ expression was low in the aorta and the tibial artery, its expression levels in the coronary artery are similar
to those in the lung, suggesting that the coronary vasculature may be more susceptible to SARS-CoV-2 viral infection than other vascular beds. At the single-cell level, expression of
SARS-CoV-2 receptors and factors confirmed our coronary vasculature autopsy findings. Although _ACE2_ expression was not detectable by scRNA-seq, _NRP1_ and _FURIN_ were highly expressed in
two _TREM2_+ macrophage clusters, known to correspond to plaque foamy macrophages56, as well as in clusters of _SSP1_+ macrophages and _LYVE1_+ macrophages. We further found that SARS-CoV-2
infects NRP1+ macrophages within human coronary tissue at autopsy and that viral replication was greater in NRP1+ macrophages present in PIT lesions. Experimentally, both silencing of _NRP1_
gene and a specific inhibitor of the interaction between the b1 domain of NRP-1 and the SARS-CoV-2 S1 CendR53,54 reduced SARS-CoV-2 infectivity of human primary macrophages and foam cells,
confirming that SARS-CoV-2 infection of macrophage and foam cell is, in part, NRP-1 dependent. However, an aberrant pro-inflammatory response associated with NRP-1 inhibition limits the
potential therapeutic use of NRP-1 inhibitor. This pro-inflammatory effect, although unexpected in the context of SARS-CoV-2 infection, is consistent with previous findings of a protective
role of NRP-1 in sepsis and the increased release of pro-inflammatory cytokines (for example, IL-6) from NRP-1 null macrophages58. Overall, our data demonstrate that SARS-CoV-2 replicates in
macrophages within human coronaries of patients who died from severe COVID-19. Our study is limited to the analysis of a small cohort of older individuals with COVID-19 and pre-existing
atherosclerosis and other medical conditions and comorbidities. Therefore, our observations cannot be extrapolated to younger, healthy individuals. Our study is also limited to cases that
occurred during the early phases of the COVID-19 pandemic, and the findings that SARS-CoV-2 replicates in the atherosclerotic coronary vasculature is pertinent only to the viral strains that
circulated in New York City between May 2020 and May 2021. Despite these limitations, our study highlights the hyperinflammatory response orchestrated by SARS-CoV-2-infected plaque
macrophages and foam cells as a mechanistic link between infection of atherosclerotic coronary vessels and acute cardiovascular complications of COVID-19. METHODS Ethical approval for the
use of human autopsy specimens was obtained from the institutional review board (IRB) of NYU Langone Health (NYULH) (IRB i21-01587) in compliance with all relevant ethical regulations.
Patients undergoing CEA who signed a written informed consent were enrolled in the ATHERO-IN study approved by the IRBs of the Icahn School of Medicine at Mount Sinai (IRB 11–01427) and
NYULH (IRB i21-00429). The reported demographic information and clinical history are de-identified and covered by the patients’ consent to publish such data in compliance with IRB 11–01427
and IRB i21-00429. CORONARY AUTOPSY SPECIMENS FROM PATIENTS WITH COVID-19 Formalin-fixed, paraffin-embedded coronary artery specimens (_n_ = 27) from eight deceased patients diagnosed with
COVID-19 were obtained from NYULH and the NYU Grossman School of Medicine’s Center for Biospecimen Research and Development (CBRD). Demographic information and clinical history were obtained
from the hospital medical records (Supplementary Table 1). Data on the clinical course of the infection and COVID-19-associated pathology were obtained from both the hospital medical
records and autopsy pathology reports (Supplementary Table 2). RNASCOPE IN SITU HYBRIDIZATION The RNAscope 4-plex assay was performed on coronary tissue sections using LS Multiplex Reagent
Kit and RNAscope LS 4-plex Ancillary Kit (ACD Bio-Techne). SARS-CoV-2-specific RNAscope probes were used to visualize the SARS-CoV-2 vRNA encoding the S protein and to detect direct viral
replication using a sense probe that targets the antisense strand of the S gene. Negative and positive control probes were used to assess tissue RNA integrity. RNAscope probes used for
detecting _CD68_, _ACTA2_ and _NRP1_ transcripts, SARS-CoV-2 S viral gene, antisense strand of S gene and other reagents are detailed in Supplementary Table 5. Tissue sections were scanned
at ×40 magnification in the Vectra Polaris Automated Quantitative Pathology Imaging System using a MOTIF workflow. For the in vitro experiments, human peripheral blood mononuclear
cell-derived macrophages, macrophage-derived foam cells, primary aortic VSMCs and cholesterol-loaded VSMCs were infected with SARS-CoV-2 before performing RNAscope ISH Multiplex Fluorescent
V2 Assay protocol according to the manufacturer’s instructions. Images were acquired with a Keyence BZ-X800 microscope. RNASCOPE IN SITU HYBRIDIZATION ANALYSIS Images were annotated in
Phenochart whole slide viewer (Akoya Biosciences). Whole slide scan ‘.qptiff’ files were stamped for InForm batch on Phenochart (version 1.1). Spectral unmixing of all images was performed
using InForm’s automated algorithm. The stamped images were processed through InForm (PerkinElmer, version 2.6), and ‘component_data.tif’ files were exported for quantification using the
HALO image analysis platform (version 3.5.3577) and HALO AI (version 3.6.4134) (Indica Labs) using the classifier module, neural network classifier module and spatial analysis module. The
algorithms used were Area Quantification (version 2.4.2 and version 2.4.3), Area Quantification FL (version 2.3.3 and version 2.3.4), Deconvolution (version 1.1.7 and version 1.1.8) and FISH
(version 3.2.3). AI was trained-by-example to classify the regions of the tissue. HALO AI trained Mininet deep learning classifier was used to classify the coronary wall and corresponding
perivascular fat in all sections and to remove background autofluorescence. Cell segmentation was performed by training AI nuclei segmentation network classifier with DAPI-stained nuclei on
both the stitched images of whole coronary tissue and in vitro experiments’ images. Quantification of the probes was based on color and constant image intensity thresholding, maintaining
parameters constant across samples. HALO imaging analysis algorithms and spatial analysis workflow were used to quantify the number of positive dots per cell and the frequency of positive
cells divided by total cells. IHC H&E and chromogenic IHC were performed by the NYULH CBRD. IHC for the quantification of macrophages was performed on a Ventana Medical Systems Discovery
Ultra platform using rabbit anti-human CD68 (ref. 65) (Ventana Medical Systems). Images were acquired in the Vectra Polaris multimodal digital pathology. Histopathology assessment and
coronary pathology reports were performed by a blinded clinical cardiovascular pathologist. Quantification of percentage of CD68+ area was performed with the hybrid cell count module of the
Keyence BZ-X800 microscope. CD68+ cell count and frequency were obtained using HALO imaging analysis algorithms and AI nuclei segmentation. IMMUNOFLUORESCENCE Autopsy coronary sections were
stained with primary antibodies at 4 °C overnight and with secondary antibodies at room temperature for 2 h, and cell nuclei were stained with DAPI. Autofluorescence was quenched with
TrueBlack Lipofuscin Autofluorescence Quencher (Biotium). Cultured macrophages and foam cells were stained with a mouse anti-SARS-CoV-2 NP antibody (ProScience) overnight at 4 °C, followed
by a goat anti-mouse Alexa Fluor 488 (Invitrogen) for 2 h at room temperature. Images were acquired using a Keyence BZ-X800 microscope. Primary and secondary antibodies used are listed in
Supplementary Table 5. SCRNA-SEQ OF HUMAN CAROTID ARTERIES Carotid plaques were obtained from patients undergoing CEA (_n_ = 10) enrolled in the Athero-IN study (IRB 11–01427 and IRB
i21-00429). Exclusion criteria for patient enrollment were as follows: active infection, autoimmune diseases, active or recurrent cancer and severe renal failure requiring dialysis.
Supplementary Table 4 summarizes the clinical and demographic characteristics of the study cohort. Plaques were classified by a clinical cardiovascular pathologist (N.N.) as fibrocalcific
(_n_ = 3) and fibroatheroma (_n_ = 4). Three of 10 plaque tissues were not classified owing to insufficient tissue. CELL ISOLATION FROM CAROTID ATHEROSCLEROTIC TISSUES Fresh plaque specimens
were placed immediately in DMEM (Gibco) and processed within 30 min to obtain single-cell suspension using a digestion protocol previously described66. In brief, the specimens were washed
and digested in DMEM containing 10% FBS (Gibco, 10082147); collagenase type IV (Sigma-Aldrich, C5138) at a final concentration of 1 mg ml−1; and DNase I (Sigma-Aldrich, DN25), hyaluronidase
(Sigma-Aldrich, H3506), collagenase type XI (Sigma-Aldrich, C7657) and collagenase type II (Sigma-Aldrich, C6885), each at a final concentration of 0.3 mg ml−1 for 40 min in a gentleMACS
Octo Dissociator (Miltenyi Biotec). The digested tissue was sequentially filtered through 70-μm and 40-μm cell strainers (Thermo Fisher Scientific, 22363547 and 22363548) and centrifuged at
300_g_ for 8 min. Dead cells were removed with the EasySep Dead Cell Removal (Annexin V) Kit (STEMCELL Technologies, 17899), and leukocytes were isolated with the EasySep Release Human CD45
Positive Selection Kit (STEMCELL Technologies, 100-0105) according to the manufacturer’s instructions. Live cells were counted with the automatic cell counter Cellometer Auto 2000
(Nexcelom), and cells were loaded to the Chromium Controller (10x Genomics). scRNA-seq libraries were prepared using the Chromium Single Cell 3′ Library v3 reagent, Gel Bead and Multiplex
Kit and Chip Kit (10x Genomics). DNA library quantity and quality were measured with Qubit dsDNA HS fluorometric assay (Qiagen) and Bioanalyzer (Agilent) and sequenced on a NovaSeq 6000
sequencer (Illumina). scRNA-seq data from six samples were previously published66 and are available in the GEO (GSE224273). Four extra samples were processed to obtain additional scRNA-seq
data (GEO: GSE235437). COMPUTATIONAL ANALYSIS OF CORONARY AND CAROTID SCRNA-SEQ Cell Ranger Single-Cell Software Suite (version 3.1.0) was used to demultiplex and align to the human genome
reference version GRCh38. A total of 20,639 CD45+ cells were analyzed as were Cell Ranger outputs from the CEA scRNA-seq data with an average of 104,351 mean reads per cell and 3,128 median
unique molecular identifier (UMI) counts per cell. An scRNA-seq dataset (GSE131780) comprising human atherosclerotic coronary samples was obtained from the GEO dataset repository15. A total
of 12,200 coronary cells from seven tissue samples obtained from four patients were analyzed. Cell Ranger outputs had an average of 62,328 mean reads per cell and 2,703 median UMI counts per
cell. The output filtered gene expression matrices were analyzed using the Seurat package (version 4.0.3)67. Mitochondrial genes >10% to >20%, <200 genes and <10,000 to
<20,000 UMIs were filtered out. Gene expression matrices were normalized using the SCTransform function, and robust principal component analysis was used for integration. The RunPCA
function was used to compute the top 30 principal components using variably expressed genes. FindIntegrationAnchors served to identify anchors between carotid samples and were inputted into
the IntegrateData function to correct for batch effects. Cells were assigned a cell cycle score using the CellCycleScoring function to regress out unwanted variation. RunUMAP with
FindNeighbors and FindClusters functions were used for cell clustering. Integration/co-clustering of carotid and coronary single cells was performed using Harmony68. The dimensionality
reduction generated by Harmony was used to calculate uniform manifold approximation and projection (UMAP) and graph-based clustering with a resolution of 0.7. FindAllMarkers was used to find
differentially expressed genes (DEGs) using the Wilcoxon rank-sum statistical test, and major cell populations were annotated using DEGs and canonical marker genes. Subclustering analysis
of myeloid cells was performed with same approach described above. MiloR package (version 1.3.1)55 was used to test for differential abundance between carotid and coronary. Cell
neighborhoods were defined on a _k_-nearest neighbor (kNN) graph (_k_ = 20, _d_ = 30), and testing for differential abundance was done using a negative binomial general linear model
framework. Cell neighborhoods were annotated to their clusters, and differential abundance was expressed as log fold changes (FCs) displayed in a beeswarm plot. GTEX DATASET ANALYSIS Gene
expression analysis of SARS-CoV-2 entry factors in aorta, coronary and tibial arteries, heart (atrial appendage and left ventricle), lung and whole blood was performed using GTEx data
(version V8, dbGaP accession number phs000424.v8.p2), which contains 17,382 RNA-seq tissue samples in total from 948 deceased donors (67.1% males). The cohort includes Caucasian (84.6%),
African American (12.9%), American Indian (0.2%), Asian (1.3%) and unknown (1.1%) ancestry. The registered causes of death are traumatic injury, cerebrovascular disease (>22%) or heart
disease (>40%). Results are shown as a logarithmic scale of transcripts per million (log10 TMP+1). COMPUTATIONAL ANALYSIS OF MURINE SCRNA-SEQ DATA Sequencing data from ref. 16 were
extracted from BioProject accession number PRJNA626450. Quality control of scRNA-seq data was performed using FastQC (version 0.11.7). Reads were aligned to the GRCm39 (mm39) reference
genome using STAR (version 2.6.1d). FeatureCounts from the subread package (version 1.6.3) was employed and normalized counts used for downstream analysis using the Seurat R package (version
4.3.0). Highly variable genes were identified using the FindVariableFeatures function. RunUMAP function with default settings was used with FindNeighbors and FindClusters functions for cell
clustering. Differential gene expression analysis was performed using the FindMarkers function to identify differences between single-color Tomato reporter (Myh11-CreERT2,
Rosa26tdTomato/tdTomato, ApoE−/− mice) fed a high-fat diet (21% anhydrous milk fat, 19% casein and 0.25% cholesterol) for 18 weeks versus control mice. The Benjamini–Hochberg method was
applied to control for the false discovery rate (FDR). EXPERIMENTS IN BIOSAFETY LEVEL 3 Studies involving SARS-CoV-2 infection were approved by the Institutional Biosafety Committee
(IBC21-000079) of the NYU Grossman School of Medicine. All Biosafety Level 3 procedures were conducted in accordance with the Biosafety Manual and standard operating procedures of the NYU
Grossman School of Medicine High-Containment Facility. CELLS AND VIRUSES Vero E6 cells (American Type Culture Collection, CRL-1586) were maintained in DMEM culture media containing 10% FBS
(Gibco), 2 mM l-glutamine and 100 U ml−1 penicillin–streptomycin. Vero E6 Expressing Transmembrane Protease, Serine 2 and Human Angiotensin-Converting Enzyme 2 (Vero E6-TMPRSS2-T2A-ACE2)
were obtained from BEI Resources (NR-54970). Vero E6-TMPRSS2-T2A-ACE2 cells were grown in DMEM medium with 4 mM l-glutamine, 4,500 ml of glucose, 1 mM sodium pyruvate and 1,500 mg L−1 sodium
bicarbonate, 10% FBS and 10 μg ml−1 puromycin. All cells were verified to be free of mycoplasma contamination. SARS-CoV-2 isolate USA-WA1/2020 (BEI Resources, NR52281) was amplified once in
Vero E6 cells infected at a multiplicity of infection (MOI) of 0.01 as previously described69. Virus was collected at 72 hpi upon observation of cytopathic effect. Debris was removed by
centrifugation and passage through a 0.22-μm filter, and the supernatant was then aliquoted and stored at −80 °C. Virus titer was calculated by plaque assay on Vero E6 cells and informed as
particle-forming units per milliliter (PFU ml−1). Virus stocks were Sanger sequenced during viral stock production. A PCR amplicon covering the S gene (FW:
gttcagagtttattctagtgcgaataattgcacttttg, RV: gcagtaaggatggctagtgtaactagcaagaataccac) was purified using the Nucleospin PCR and Gel Extraction Kit (Macherey-Nagel) and Sanger sequenced
(GENEWIZ) with the following primers (FW: ggttttaattgttactttcc and FW: ctacaggttctaatgtttttc). icSARS-CoV-2 mNG reporter virus was obtained from the UTMB World Reference Center for Emerging
Viruses and Arboviruses21. IN VITRO SARS-COV-2 INFECTION OF HUMAN PRIMARY CELLS Human primary monocytes were differentiated into macrophages in the presence of 20 nM human macrophage
colony-stimulating factor (M-CSF, PeproTech) in DMEM culture media supplemented with 10% FBS, 2 mM l-glutamine and 100 U ml−1 penicillin–streptomycin for 5 d. Macrophages were then treated
with 10 μg ml−1 of either Dil-oxLDL or ox-LDL (Invitrogen) for 1 h before infection and kept throughout the experiment. Human aortic smooth muscle cells (PromoCell, C-12533) were cultured in
complete Smooth Muscle Cell Growth Medium with 0.05 ml/ml FCS, 0.5 ng ml−1 recombinant human epidermal growth factor, 0.2 ng ml−1 recombinant human basic fibroblast growth factor and 5 µg
ml−1 recombinant human insulin and treated with 10 µg ml−1 Cholesterol–methyl-β-cyclodextrin (Sigma-Aldrich) overnight before infection with SARS-CoV-2 virus USA-WA1/2020 isolate at MOI 0.1
in infection media with 2% FBS. Mock-infected cells were used as controls. Cell culture supernatants were inactivated with UV irradiation for 15 min and stored at −80°C. Cells were collected
in either TRIzol (Invitrogen) or 10% buffered formalin. Macrophages and foam cells were treated with EG00229 trifluoroacetate (Tocris, 6986) at 100 μM final concentration for 1 h before
infection. LIPID STAINING WITH OIL RED O VSMCs treated with 10 µg ml−1 of Cholesterol–methyl-β-cyclodextrin or vehicle for 48 h were fixed with 10% buffered formalin for 1 h and incubated
with 60% isopropanol for 1 min. Staining with Oil Red O (Sigma-Aldrich) working solution was performed for 20 min before hematoxylin counterstain for 1 min. Images were acquired with a
Keyence BZ-X800 microscope. EX VIVO SARS-COV-2 INFECTION OF HUMAN VASCULAR EXPLANTS Carotid plaque specimens were thawed, cut into pieces (approximately 3 × 3 mm) and cultured in DMEM
culture media supplemented with 10% FBS, 2 mM l-glutamine and 100 U ml−1 penicillin–streptomycin for 2 h. Tissue specimens were infected with 105 PFU ml−1 of SARS-CoV-2 virus USA-WA1/2020
isolate. Non-infected tissues were used as controls. Culture media samples were collected at 24 hpi, 48 hpi and 72 hpi and inactivated by UV irradiation for 15 min. Tissue specimens were
fixed overnight with either 4% paraformaldehyde for immunofluorescence or 3% glutaraldehyde for electron microscopy. Tissues used for bulk RNA-seq were stored in 1 ml of TRIzol reagent. For
NRP-1 blocking experiments, tissues were pre-treated with NRP1 blocking agent (EG00229 trifluoroacetate) at a final concentration of 100 μM for 1 h before infection. INFECTIOUS PARTICLE
QUANTIFICATION BY PLAQUE ASSAY Ten-fold dilutions of conditioned culture media were added to Vero E6-TMPRSS2-T2A-ACE2 cell monolayers for 1 h and gently shaken every 15 min. After
incubation, cells were overlaid with 0.8% agarose in DMEM containing 2% FBS and incubated for 36 h. After fixation, agarose plugs were removed, and plaques were visualized by crystal violet
solution staining. Plaques were counted, and the results were expressed as PFU ml−1. Plaque assays using Vero E6 cells were performed with a 72-h incubation period. SILENCING OF NRP1 IN
HUMAN MACROPHAGES AND FOAM CELLS Transient knockdown of NRP1 was achieved using a pool of pre-designed siRNA FlexiTube GeneSolution for NRP1 silencing (Qiagen, GS8829; Hs_NRP1_8,
ACGGTCATAGACAGCACCATA; Hs_NRP1_7, CACGCGATTCATCAGGATCTA; Hs_NRP1_12, ACAGCCT TGAATGCACTTATA; Hs_NRP1_11, CTCCCAGATCACATCATCCAA) and non-targeting negative control (Qiagen, AllStars Negative
Control siRNA). In brief, 3 µl of Lipofectamine RNAiMAX (Invitrogen) and siRNA oligos 10 nM final concentration were added to a final volume of 200 µl of OptiMEM reduced serum medium
(Gibco). The mix was incubated at room temperature for 20 min. Plated cells (60–80% confluence) were transfected by adding oligos/Lipofectamine RNAiMAX complexes in a final volume of 1 ml
with DMEM without serum or antibiotics overnight (~16 h) before replacing the medium with complete DMEM medium with 10% FBS for 24 h. After 24 h, half of the cells were treated with 10 µg
ml−1 oxLDL for 2 h before infection with SARS-CoV-2 virus USAWA1/2020 isolate MOI 0.1 in infection media (2% FBS DMEM) for 24 h. Cells were harvested for RNA and protein analysis, and cell
culture supernatants were UV inactivated for 15 min. Cells were fixed with 10% buffered formalin for 1 h before RNAscope staining. PROTEIN QUANTIFICATION AND WESTERN BLOT ANALYSIS Protein
lysates, obtained using RIPA buffer containing phosphatase and protease inhibitor cocktail (100×), were processed to quantify protein concentration using the Pierce BCA Protein Assay Kit.
The following antibodies were used for western blot analysis: anti-NRP1 rabbit monoclonal antibody (Cell Signaling Technology), anti-β-actin mouse monoclonal antibody (Sigma-Aldrich) and
anti-rabbit and anti-mouse HRP-conjugated secondary antibodies (ProteinSimple). All reagent information is listed in Supplementary Table 5. Molecular weight markers and samples were run
through the ProteinSimple WES System, and images were analyzed using the Compass for Simple Western software (version 6.2.0). RT–QPCR RNA was extracted using TRIzol reagent and Direct-zol
RNA Microprep Kits (Zymo Research) or RNAeasy Mini Kit (Qiagen). Reverse transcription (High-Capacity cDNA Reverse Transcription Kit, Applied Biosystems) was carried out at 37 °C for 1 h,
and the reaction was stopped by heating to 95 °C for 5 min and hold at 4 °C. RT–qPCR was performed using gene-specific primers (Supplementary Table 5) using the TaqMan Fast Advanced Master
Mix and the Applied Biosystems QuantStudio 6 Pro detection system. The thermal cycling conditions were 50 °C for 2 min, followed by a step at 95 °C for 2 min and 40 cycles at 95 °C for 1 s
and 60 °C for 20 s. The relative quantification of the SARS-CoV-2 NP gene was calculated using the 2−ΔΔCt method in Design and Analysis Software version 2.6. FCs in gene expression were
normalized to housekeeping control gene and calculated log10FC relative to control sample (2 h after viral inoculum). For NRP1 silencing in vitro experiments quality control, FCs in gene
expression of the _NRP1_ target gene were normalized to the _GAPDH_ housekeeping control gene. Relative quantification was performed using the 2−ΔΔCt method, and samples were normalized by
the endogenous controls. BULK RNA-SEQ RNA from primary macrophages and foam cells was extracted using TRIzol reagent and Direct-zol RNA Microprep Kits following the manufacturer’s
instructions. Total RNA from human atherosclerotic tissue was isolated using QIAzol Lysis Reagent (Qiagen) and the gentleMACS Octo Dissociator (Miltenyi Biotec) homogenizer, combined with
RNA cleanup using the RNAeasy Mini Kit (Qiagen). Quality control was performed with Agilent RNA 6000 Nano and Pico Kits (Agilent Technologies) using the Agilent 2100 Bioanalyzer system. For
in vitro experiments, poly(A) library preparation was performed using Illumina Stranded mRNA Preparation and Ligation (Illumina). For human atherosclerotic plaque ex vivo experiments, the
Revelo RNA-Seq High Sensitivity library preparation kit was used (Tecan). Libraries were quantified using KAPA Library Quantification Kit (Roche), pooled at 2 nM equimolar concentration and
sequenced using an Illumina NovaSeq 6000 sequencer. RNA-SEQ DATA PROCESSING, ANALYSIS AND VISUALIZATION Quality control of RNA-seq data was performed using FastQC2 (version 0.11.7). Raw
sequenced reads were trimmed using fastp3 (version 0.20.1) for quality control of bases and to eliminate sequencing adaptors. Raw reads were aligned using STAR (version 2.6.1d) to the
combined human (_Homo sapiens_) genome assembly GRCh38 from the Genome Reference Consortium (GCA_000001405.15 GCF_000001405.26) and SARS-CoV-2 Washington isolate (USA WA1/2020) genome
(GenBank: MN985325.1). The gene-level expression counts were computed with the featureCounts function in the Subread package (version 1.6.3; parameters: -g gene_id -s 2) using the human gene
annotations from GENCODE release 33. Differential expression was performed using the R package DESeq2 (version 1.30.1). To model differences in gene expression between SARS-CoV-2-infected
versus non-infected primary macrophages and foam cells, a model including infection status, timepoint and donor as dependent variables was used. To identify differences in gene expression
between infected macrophages and infected foam cells, a model including cell type, timepoint and donor as dependent variables was used. To analyze gene expression variation across timepoints
and infection status in macrophages and foam cells, we employed a model that incorporated infection status, timepoint, donor and an interaction between infection status and timepoint as
dependent variables for each sample type separately. The IFN and SARS-CoV-2 scores were calculated as log2 values of IFN response genes and SARS-CoV-2 genes comparing macrophage and foam
cell response at 0 hpi, 2 hpi, 8 hpi, 24 hpi and 48 hpi. Standardized data (_z_-scores) were calculated for each feature by subtracting the estimate mean and dividing by the estimate s.d.
For hierarchical clustering, data were plotted using the pheatmap package (version 1.0.12) in R. Differential expression analysis of SARS-CoV-2-infected atherosclerotic plaque samples was
performed using the R package DESeq2 with timepoint and donor included as dependent variables. For hierarchical clustering analysis, normalized values were standardized and plotted using the
pheatmap package (version 1.0.12) in R. _P_ values were adjusted using Benjamini–Hochberg correction and denoted as an asterisk. Gene set enrichment analysis using Reactome Knowledgebase
2022 and Gene Ontology Biological Process 2021 of the top 300 DEGs was performed using Enrichr (https://maayanlab.cloud/Enrichr/)70,71. Bar plots represent the combined score of 10 top
relevant pathways with statistical significance (*_P_ < 0.05, **_P_ < 0.01; ***_P_ < 0.001). CYTOKINE AND CHEMOKINE PROTEIN SECRETION A screen of 48 human cytokines and chemokines
was performed using UV-inactivated culture supernatants by using the Bio-Plex Pro Human Cytokine Screening Panel (Bio-Rad) and the Luminex 200 platform of the Immune Monitoring Laboratory
Division of Advanced Research Technologies of the NYU Grossman School of Medicine. Luminex data were log transformed; statistically significant differences were calculated using unpaired
two-sided _t_-tests; and _P_ values were adjusted using Benjamini–Hochberg correction. Empirical Bayes batch correction (Combat) was used to remove batch effects before log transforming the
data. Statistical analysis was performed using R (version 4.0.3). Cytokines showing log2FC > 0 were upregulated, and cytokines showing log2FC < 0 were downregulated. Secreted TGF-β1
and Caspase-8 were measured by ELISA (Invitrogen) in clarified culture media supernatant, according to the manufacturer’s instructions. TRANSMISSION ELECTRON MICROSCOPY After 48 hpi and 72
hpi, ex vivo SARS-CoV-2-infected atherosclerotic samples were fixed with 3% glutaraldehyde/PBS (pH 7.4) at 4 °C. Samples were prepared for electron microscopic evaluation by the NYU Grossman
School of Medicine’s Microscopy Laboratory following standard operating procedures. The specimens were examined by transmission electron microscopy. Stained grids were imaged with a Talos
L120C transmission electron microscope and recorded using a Gatan OneView Camera (4 K × 4 K resolution) with Digital Micrograph software (Gatan Microscopy Suite). STATISTICAL ANALYSIS
Statistical analyses not described above were performed using GraphPad Prism version 9.0, and details are included in the figure legends. Statistical _P_ values were calculated and reported
on graphs, and _P_ < 0.05 was considered significant. REPORTING SUMMARY Further information on research design is available in the Nature Portfolio Reporting Summary linked to this
article. DATA AVAILABILITY scRNA-seq data from the six human carotid arteries were previously published and are available in the GEO (GSE224273). Four additional carotid plaques were
processed to obtain sc-RNAseq data deposited in the GEO (GSE235437). scRNA-seq data coronary lesions were obtained from the GEO (GSE131780). Bulk RNA-seq data from macrophages and foam cell
experiments and the plaque tissues infected with SARS-CoV-2 are deposited in the GEO (GSE235437). GTEx data used are version V8, dbGaP accession number phs000424.v8.p2, and available at the
GTEx portal (https://gtexportal.org/home). Murine scRNA-seq data from ref. 16 were extracted from BioProject accession number PRJNA626450. Human (_Homo sapiens_) genome assembly GRCh38
(hg38) was obtained from the Genome Reference Consortium (GCA_000001405.15 GCF_000001405.26). SARS-CoV-2 Washington isolate (WA1/2020) genome was obtained from the NIH repository (GenBank:
MN985325.1). The following reagent was deposited by the Centers for Disease Control and Prevention and obtained through BEI Resources, NIAID, NIH: SARS-Related Coronavirus 2, Isolate
hCoV-19/USA-WA1/2020, NR-52281. The following reagent was obtained through BEI Resources, NIAID, NIH _Cercopithecus aethiops_ Kidney Epithelial Cells Expressing Transmembrane Protease,
Serine and Human Angiotensin-Converting Enzyme 2 (Vero E6-TMPRSS2-T2A-ACE2, NR-54970). All other data supporting the findings in this study are included in the main article and associated
files. Source data files are available on GitHub at https://github.com/giannarelli-lab/SARS-CoV-2-infection-triggers-pro-atherogenic-inflammatory-responses-in-human-coronary-vessels. CODE
AVAILABILITY Code used for data analysis is available on GitHub at
https://github.com/giannarelli-lab/SARS-CoV-2-infection-triggers-pro-atherogenic-inflammatory-responses-in-human-coronary-vessels. REFERENCES * Lamers, M. M. & Haagmans, B. L. SARS-CoV-2
pathogenesis. _Nat. Rev. Microbiol._ 20, 270–284 (2022). Article CAS PubMed Google Scholar * Engelen, S. E., Robinson, A. J. B., Zurke, Y. X. & Monaco, C. Therapeutic strategies
targeting inflammation and immunity in atherosclerosis: how to proceed? _Nat. Rev. Cardiol._ 19, 522–542 (2022). Article CAS PubMed PubMed Central Google Scholar * Katsoularis, I.,
Fonseca-Rodriguez, O., Farrington, P., Lindmark, K. & Fors Connolly, A. M. Risk of acute myocardial infarction and ischaemic stroke following COVID-19 in Sweden: a self-controlled case
series and matched cohort study. _Lancet_ 398, 599–607 (2021). Article CAS PubMed PubMed Central Google Scholar * Kwong, J. C. et al. Acute myocardial infarction after
laboratory-confirmed influenza infection. _N. Engl. J. Med._ 378, 345–353 (2018). Article PubMed Google Scholar * Merkler, A. E. et al. Risk of ischemic stroke in patients with
Coronavirus Disease 2019 (COVID-19) vs patients with influenza. _JAMA Neurol._ 77, 1366–1372 (2020). Article Google Scholar * Xie, Y., Xu, E., Bowe, B. & Al-Aly, Z. Long-term
cardiovascular outcomes of COVID-19. _Nat. Med._ 28, 583–590 (2022). Article CAS PubMed PubMed Central Google Scholar * Fajgenbaum, D. C. & June, C. H. Cytokine storm. _N. Engl. J.
Med._ 383, 2255–2273 (2020). Article CAS PubMed PubMed Central Google Scholar * Liu, J. et al. SARS-CoV-2 cell tropism and multiorgan infection. _Cell Discov._ 7, 17 (2021). Article
CAS PubMed PubMed Central Google Scholar * Sefik, E. et al. Inflammasome activation in infected macrophages drives COVID-19 pathology. _Nature_ 606, 585–593 (2022). Article CAS PubMed
PubMed Central Google Scholar * Moore, K. J., Sheedy, F. J. & Fisher, E. A. Macrophages in atherosclerosis: a dynamic balance. _Nat. Rev. Immunol._ 13, 709–721 (2013). Article CAS
PubMed PubMed Central Google Scholar * Narula, N., Olin, J. W. & Narula, N. Pathologic disparities between peripheral artery disease and coronary artery disease. _Arterioscler.
Thromb. Vasc. Biol._ 40, 1982–1989 (2020). Article CAS PubMed Google Scholar * Otsuka, F. et al. Natural progression of atherosclerosis from pathologic intimal thickening to late
fibroatheroma in human coronary arteries: a pathology study. _Atherosclerosis_ 241, 772–782 (2015). Article CAS PubMed PubMed Central Google Scholar * Saccon, T. D. et al. SARS-CoV-2
infects adipose tissue in a fat depot- and viral lineage-dependent manner. _Nat. Commun._ 13, 5722 (2022). Article CAS PubMed PubMed Central Google Scholar * Martinez-Colon, G. J. et
al. SARS-CoV-2 infection drives an inflammatory response in human adipose tissue through infection of adipocytes and macrophages. _Sci. Transl. Med._ 14, eabm9151 (2022). Article CAS
PubMed Google Scholar * Wirka, R. C. et al. Atheroprotective roles of smooth muscle cell phenotypic modulation and the TCF21 disease gene as revealed by single-cell analysis. _Nat. Med._
25, 1280–1289 (2019). Article CAS PubMed PubMed Central Google Scholar * Wang, Y. et al. Clonally expanding smooth muscle cells promote atherosclerosis by escaping efferocytosis and
activating the complement cascade. _Proc. Natl Acad. Sci. USA_ 117, 15818–15826 (2020). Article CAS PubMed PubMed Central Google Scholar * Rong, J. X., Shapiro, M., Trogan, E. &
Fisher, E. A. Transdifferentiation of mouse aortic smooth muscle cells to a macrophage-like state after cholesterol loading. _Proc. Natl Acad. Sci. USA_ 100, 13531–13536 (2003). Article CAS
PubMed PubMed Central Google Scholar * Shankman, L. S. et al. KLF4-dependent phenotypic modulation of smooth muscle cells has a key role in atherosclerotic plaque pathogenesis. _Nat.
Med._ 21, 628–637 (2015). Article CAS PubMed PubMed Central Google Scholar * Feil, S. et al. Transdifferentiation of vascular smooth muscle cells to macrophage-like cells during
atherogenesis. _Circ. Res._ 115, 662–667 (2014). Article CAS PubMed Google Scholar * Allahverdian, S., Chehroudi, A. C., McManus, B. M., Abraham, T. & Francis, G. A. Contribution of
intimal smooth muscle cells to cholesterol accumulation and macrophage-like cells in human atherosclerosis. _Circulation_ 129, 1551–1559 (2014). Article CAS PubMed Google Scholar * Xie,
X. et al. An infectious cDNA clone of SARS-CoV-2. _Cell Host Microbe_ 27, 841–848 (2020). Article CAS PubMed PubMed Central Google Scholar * Combe, M., Garijo, R., Geller, R., Cuevas,
J. M. & Sanjuan, R. Single-cell analysis of RNA virus infection identifies multiple genetically diverse viral genomes within single infectious units. _Cell Host Microbe_ 18, 424–432
(2015). Article CAS PubMed PubMed Central Google Scholar * Heldt, F. S., Kupke, S. Y., Dorl, S., Reichl, U. & Frensing, T. Single-cell analysis and stochastic modelling unveil large
cell-to-cell variability in influenza A virus infection. _Nat. Commun._ 6, 8938 (2015). Article CAS PubMed Google Scholar * Zhu, Y., Yongky, A. & Yin, J. Growth of an RNA virus in
single cells reveals a broad fitness distribution. _Virology_ 385, 39–46 (2009). Article CAS PubMed Google Scholar * Cohen, E. M., Avital, N., Shamay, M. & Kobiler, O. Abortive
herpes simplex virus infection of nonneuronal cells results in quiescent viral genomes that can reactivate. _Proc. Natl Acad. Sci. USA_ 117, 635–640 (2020). Article CAS PubMed Google
Scholar * Ioannidis, L. J., Verity, E. E., Crawford, S., Rockman, S. P. & Brown, L. E. Abortive replication of influenza virus in mouse dendritic cells. _J. Virol._ 86, 5922–5925
(2012). Article CAS PubMed PubMed Central Google Scholar * Lucas, C. et al. Longitudinal analyses reveal immunological misfiring in severe COVID-19. _Nature_ 584, 463–469 (2020).
Article CAS PubMed PubMed Central Google Scholar * Munnur, D. et al. Altered ISGylation drives aberrant macrophage-dependent immune responses during SARS-CoV-2 infection. _Nat.
Immunol._ 22, 1416–1427 (2021). Article CAS PubMed Google Scholar * Cheng, J. et al. IL-27 induces IFN/STAT1-dependent genes and enhances function of TIGIT+ HIVGag-specific T cells.
_iScience_ 25, 103588 (2022). Article CAS PubMed Google Scholar * Heaton, N. S. & Randall, G. Multifaceted roles for lipids in viral infection. _Trends Microbiol_ 19, 368–375 (2011).
Article CAS PubMed PubMed Central Google Scholar * Cloherty, A. P. M., Olmstead, A. D., Ribeiro, C. M. S. & Jean, F. Hijacking of lipid droplets by hepatitis C, dengue and Zika
viruses—from viral protein moonlighting to extracellular release. _Int. J. Mol. Sci._ 21, 7901 (2020). * Theken, K. N., Tang, S. Y., Sengupta, S. & FitzGerald, G. A. The roles of lipids
in SARS-CoV-2 viral replication and the host immune response. _J. Lipid Res._ 62, 100129 (2021). Article CAS PubMed PubMed Central Google Scholar * Collins, K. L., Chen, B. K., Kalams,
S. A., Walker, B. D. & Baltimore, D. HIV-1 Nef protein protects infected primary cells against killing by cytotoxic T lymphocytes. _Nature_ 391, 397–401 (1998). Article CAS PubMed
Google Scholar * Hansen, T. H. & Bouvier, M. MHC class I antigen presentation: learning from viral evasion strategies. _Nat. Rev. Immunol._ 9, 503–513 (2009). Article CAS PubMed
Google Scholar * Bizzotto, J. et al. SARS-CoV-2 infection boosts MX1 antiviral effector in COVID-19 patients. _iScience_ 23, 101585 (2020). Article CAS PubMed PubMed Central Google
Scholar * Domizio, J. D. et al. The cGAS–STING pathway drives type I IFN immunopathology in COVID-19. _Nature_ 603, 145–151 (2022). Article CAS PubMed PubMed Central Google Scholar *
Prelli Bozzo, C. et al. IFITM proteins promote SARS-CoV-2 infection and are targets for virus inhibition in vitro. _Nat. Commun._ 12, 4584 (2021). Article CAS PubMed PubMed Central
Google Scholar * Kuznetsova, T., Prange, K. H. M., Glass, C. K. & de Winther, M. P. J. Transcriptional and epigenetic regulation of macrophages in atherosclerosis. _Nat. Rev. Cardiol._
17, 216–228 (2020). Article CAS PubMed Google Scholar * Seth, R. B., Sun, L., Ea, C. K. & Chen, Z. J. Identification and characterization of MAVS, a mitochondrial antiviral signaling
protein that activates NF-κB and IRF 3. _Cell_ 122, 669–682 (2005). Article CAS PubMed Google Scholar * Minkoff, J. M. & tenOever, B. Innate immune evasion strategies of SARS-CoV-2.
_Nat. Rev. Microbiol._ 21, 178–194 (2023). CAS PubMed PubMed Central Google Scholar * Garcia-Nicolas, O., Godel, A., Zimmer, G. & Summerfield, A. Macrophage phagocytosis of
SARS-CoV-2-infected cells mediates potent plasmacytoid dendritic cell activation. _Cell. Mol. Immunol._ 20, 835–849 (2023). Article CAS PubMed PubMed Central Google Scholar * Janeway,
C. A.Jr & Medzhitov, R. Innate immune recognition. _Annu. Rev. Immunol._ 20, 197–216 (2002). Article CAS PubMed Google Scholar * tenOever, B. R. The evolution of antiviral defense
systems. _Cell Host Microbe_ 19, 142–149 (2016). Article CAS PubMed Google Scholar * Blanco-Melo, D. et al. Imbalanced host response to SARS-CoV-2 drives development of COVID-19. _Cell_
181, 1036–1045 (2020). Article CAS PubMed PubMed Central Google Scholar * Lazear, H. M., Schoggins, J. W. & Diamond, M. S. Shared and distinct functions of type I and type III
interferons. _Immunity_ 50, 907–923 (2019). Article CAS PubMed PubMed Central Google Scholar * Ridker, P. M. & Rane, M. Interleukin-6 signaling and anti-interleukin-6 therapeutics
in cardiovascular disease. _Circ. Res._ 128, 1728–1746 (2021). Article CAS PubMed Google Scholar * Ridker, P. M. et al. Antiinflammatory therapy with canakinumab for atherosclerotic
disease. _N. Engl. J. Med._ 377, 1119–1131 (2017). Article CAS PubMed Google Scholar * Zernecke, A., Bernhagen, J. & Weber, C. Macrophage migration inhibitory factor in
cardiovascular disease. _Circulation_ 117, 1594–1602 (2008). Article CAS PubMed Google Scholar * Wang, J. et al. Interleukin 18 function in atherosclerosis is mediated by the interleukin
18 receptor and the Na-Cl co-transporter. _Nat. Med._ 21, 820–826 (2015). Article CAS PubMed PubMed Central Google Scholar * Bastard, P. et al. Autoantibodies against type I IFNs in
patients with life-threatening COVID-19. _Science_ 370, eabd4585 (2020). * Hoffmann, M. et al. SARS-CoV-2 cell entry depends on ACE2 and TMPRSS2 and is blocked by a clinically proven
protease inhibitor. _Cell_ 181, 271–280 (2020). Article CAS PubMed PubMed Central Google Scholar * Kyrou, I., Randeva, H. S., Spandidos, D. A. & Karteris, E. Not only ACE2—the quest
for additional host cell mediators of SARS-CoV-2 infection: neuropilin-1 (NRP1) as a novel SARS-CoV-2 host cell entry mediator implicated in COVID-19. _Signal Transduct. Target. Ther._ 6,
21 (2021). Article CAS PubMed PubMed Central Google Scholar * Cantuti-Castelvetri, L. et al. Neuropilin-1 facilitates SARS-CoV-2 cell entry and infectivity. _Science_ 370, 856–860
(2020). Article CAS PubMed PubMed Central Google Scholar * Daly, J. L. et al. Neuropilin-1 is a host factor for SARS-CoV-2 infection. _Science_ 370, 861–865 (2020). Article CAS PubMed
PubMed Central Google Scholar * Dann, E., Henderson, N. C., Teichmann, S. A., Morgan, M. D. & Marioni, J. C. Differential abundance testing on single-cell data using _k_-nearest
neighbor graphs. _Nat. Biotechnol._ 40, 245–253 (2022). Article CAS PubMed Google Scholar * Kim, K. et al. Transcriptome analysis reveals nonfoamy rather than foamy plaque macrophages
are proinflammatory in atherosclerotic murine models. _Circ. Res._ 123, 1127–1142 (2018). Article CAS PubMed PubMed Central Google Scholar * Solomon, B. D., Mueller, C., Chae, W. J.,
Alabanza, L. M. & Bynoe, M. S. Neuropilin-1 attenuates autoreactivity in experimental autoimmune encephalomyelitis. _Proc. Natl Acad. Sci. USA_ 108, 2040–2045 (2011). Article CAS
PubMed PubMed Central Google Scholar * Dai, X. et al. A novel role for myeloid cell-specific neuropilin 1 in mitigating sepsis. _FASEB J._ 31, 2881–2892 (2017). Article CAS PubMed
PubMed Central Google Scholar * Stein, S. R. et al. SARS-CoV-2 infection and persistence in the human body and brain at autopsy. _Nature_ 612, 758–763 (2022). Article CAS PubMed PubMed
Central Google Scholar * Lindner, D. et al. Association of cardiac infection with SARS-CoV-2 in confirmed COVID-19 autopsy cases. _JAMA Cardiol._ 5, 1281–1285 (2020). Article PubMed
Google Scholar * Robbins, C. S. et al. Local proliferation dominates lesional macrophage accumulation in atherosclerosis. _Nat. Med._ 19, 1166–1172 (2013). Article CAS PubMed PubMed
Central Google Scholar * Bajpai, G. et al. The human heart contains distinct macrophage subsets with divergent origins and functions. _Nat. Med._ 24, 1234–1245 (2018). Article CAS PubMed
PubMed Central Google Scholar * Brewer, C. M. & Majesky, M. W. Branch point smooth muscle cells highlighted by novel lineage tracking approach. _Circ. Res._ 122, 194–196 (2018).
Article CAS PubMed PubMed Central Google Scholar * Nilsson-Payant, B. E. et al. The NF-κB transcriptional footprint is essential for SARS-CoV-2 replication. _J. Virol._ 95, e0125721
(2021). Article PubMed Google Scholar * Wang, S. et al. Programmed death ligand 1 expression and tumor infiltrating lymphocytes in neurofibromatosis type 1 and 2 associated tumors. _J.
Neurooncol._ 138, 183–190 (2018). Article CAS PubMed PubMed Central Google Scholar * Fernandez, D. M. et al. Single-cell immune landscape of human atherosclerotic plaques. _Nat. Med._
25, 1576–1588 (2019). Article CAS PubMed PubMed Central Google Scholar * Hao, Y. et al. Integrated analysis of multimodal single-cell data. _Cell_ 184, 3573–3587 (2021). Article CAS
PubMed PubMed Central Google Scholar * Korsunsky, I. et al. Fast, sensitive and accurate integration of single-cell data with Harmony. _Nat. Methods_ 16, 1289–1296 (2019). Article CAS
PubMed PubMed Central Google Scholar * Noval, M. G. et al. Antibody isotype diversity against SARS-CoV-2 is associated with differential serum neutralization capacities. _Sci Rep._ 11,
5538 (2021). Article CAS PubMed PubMed Central Google Scholar * Kuleshov, M. V. et al. Enrichr: a comprehensive gene set enrichment analysis web server 2016 update. _Nucleic Acids Res._
44, W90–W97 (2016). Article CAS PubMed PubMed Central Google Scholar * Chen, E. Y. et al. Enrichr: interactive and collaborative HTML5 gene list enrichment analysis tool. _BMC
Bioinformatics._ 14, 128 (2013). Article PubMed PubMed Central Google Scholar Download references ACKNOWLEDGEMENTS We thank the NYU Biosafety Level 3 High-Containment Facility, the NYULH
Center for Biospecimen Research and Development, the Histology and Immunohistochemistry Laboratory (CBRD; RRID:SCR_018304), the Experimental Pathology Division (ExPath), the NYU Genome
Technology Center (GTC), the NYU Microscopy Laboratory and the NYU Immune Monitoring Laboratory (IML) at NYU Langone’s Division of Advanced Research Technologies (DART) for their assistance.
The DART CBRD, ExPath, IML and the Microscopy Lab cores are supported by NIH/NCI grant P30CA016087. CBRD is also supported by the Laura and Isaac Perlmutter Cancer Center Support Grant.
ExPath is also supported by NIH S10 OD021747. This work was funded by NIH/NHLBI grant 1R01HL165258 (C.G.). C.G. also acknowledges support from grants NIH/NHLBI R01HL153712, AHA
20SFRN35210252, CZI NFL-2020-218415 and U34TR003594. N.E is supported by the AHA research supplement to promote diversity in science (AHA 965509). M.G.N is supported by AHA Postdoctoral
Fellowship 19-A0-00-1003686. D.D. is supported by AHA grant 20SFRN35210252. SARS-CoV-2 work in the M.S. laboratory is supported by NIH/NIAID R01AI160706 and NIH/NIDDK R01DK130425. K.A.S. is
supported by NIH/NIAID 1R01 AI162774-01A1, NYU Grossman School of Medicine startup funds and an NYU Cardiovascular Research Center pilot award. K.J.M. is supported by NIH/NHLBI R35HL,
R35HL135799 and R01HL084312. The publicly available data used for the analyses described in this paper were obtained from the GTEx portal. The GTEx project was supported by the Common Fund
of the Office of the Director of the National Institutes of Health and by NCI, NHGRI, NHLBI, NIDA, NIMH and NINDS. AUTHOR INFORMATION AUTHORS AND AFFILIATIONS * Department of Medicine,
Division of Cardiology, NYU Cardiovascular Research Center, New York University School of Medicine, New York, NY, USA Natalia Eberhardt, Ravneet Kaur, Letizia Amadori, Michael Gildea, Swathy
Sajja, Dayasagar Das, Burak Cilhoroz, Roza Shamailova, Andrea Vasquez Guillen, Jonathan D. Newman, Kathryn J. Moore & Chiara Giannarelli * Department of Microbiology, New York
University School of Medicine, New York, NY, USA Maria Gabriela Noval & Kenneth A. Stapleford * Precision Immunology Institute, Icahn School of Medicine at Mount Sinai, New York, NY, USA
O’ Jay Stewart & Chiara Giannarelli * Department of Medicine, Cardiovascular Research Center, Icahn School of Medicine at Mount Sinai, New York, NY, USA Dawn M. Fernandez * Department
of Microbiology, Icahn School of Medicine at Mount Sinai, New York, NY, USA Sonia Jangra & Michael Schotsaert * Global Health and Emerging Pathogens Institute, Icahn School of Medicine
at Mount Sinai, New York, NY, USA Sonia Jangra & Michael Schotsaert * Department of Surgery, Vascular Division, Icahn School of Medicine at Mount Sinai, New York, NY, USA Peter Faries *
Department of Surgery, Vascular Division, New York University Langone Health, New York, NY, USA Thomas Maldonado & Caron Rockman * Department of Pathology, NYU Winthrop Hospital, Long
Island School of Medicine, New York, NY, USA Amy Rapkiewicz * Department of Pathology, New York University School of Medicine, New York, NY, USA Navneet Narula & Chiara Giannarelli
Authors * Natalia Eberhardt View author publications You can also search for this author inPubMed Google Scholar * Maria Gabriela Noval View author publications You can also search for this
author inPubMed Google Scholar * Ravneet Kaur View author publications You can also search for this author inPubMed Google Scholar * Letizia Amadori View author publications You can also
search for this author inPubMed Google Scholar * Michael Gildea View author publications You can also search for this author inPubMed Google Scholar * Swathy Sajja View author publications
You can also search for this author inPubMed Google Scholar * Dayasagar Das View author publications You can also search for this author inPubMed Google Scholar * Burak Cilhoroz View author
publications You can also search for this author inPubMed Google Scholar * O’ Jay Stewart View author publications You can also search for this author inPubMed Google Scholar * Dawn M.
Fernandez View author publications You can also search for this author inPubMed Google Scholar * Roza Shamailova View author publications You can also search for this author inPubMed Google
Scholar * Andrea Vasquez Guillen View author publications You can also search for this author inPubMed Google Scholar * Sonia Jangra View author publications You can also search for this
author inPubMed Google Scholar * Michael Schotsaert View author publications You can also search for this author inPubMed Google Scholar * Jonathan D. Newman View author publications You can
also search for this author inPubMed Google Scholar * Peter Faries View author publications You can also search for this author inPubMed Google Scholar * Thomas Maldonado View author
publications You can also search for this author inPubMed Google Scholar * Caron Rockman View author publications You can also search for this author inPubMed Google Scholar * Amy Rapkiewicz
View author publications You can also search for this author inPubMed Google Scholar * Kenneth A. Stapleford View author publications You can also search for this author inPubMed Google
Scholar * Navneet Narula View author publications You can also search for this author inPubMed Google Scholar * Kathryn J. Moore View author publications You can also search for this author
inPubMed Google Scholar * Chiara Giannarelli View author publications You can also search for this author inPubMed Google Scholar CONTRIBUTIONS Conceptualization: N.E. and C.G. Methodology:
N.E., M.G.N., O.S., R.K., K.M, K.A.S., N.N. and L.A. Biosafety Level 3 experiments: N.E., M.G.N. and S.J. Other experiments: M.S., N.E., O.S, B.C., L.A., D.D. and A.V.G. Patient recruitment:
R.S., S.S. and D.F. Clinical data management: N.E., S.S., J.N., N.N., R.S., P.F. and A.R. Human sample collection: P.F., N.N., A.R., T.M. and C.R. Human sample processing: N.E., L.A., A.R.,
D.F., B.C. and D.D. Data analysis: N.E., D.D., M.G.N., R.K., M.G., D.F., J.N., B.C., D.D. and L.A. Resources: C.G., K.A.S. and A.R. Data visualization: N.E., R.K., M.G. and L.A.
Writing—original draft: N.E. and C.G. Writing—revision and editing: all authors. Supervision: C.G. Project administration and funding acquisition: C.G. CORRESPONDING AUTHOR Correspondence to
Chiara Giannarelli. ETHICS DECLARATIONS COMPETING INTERESTS The M.S. laboratory has received unrelated research funding in sponsored research agreements from ArgenX N.V., Moderna and Phio
Pharmaceuticals, which has no competing interest with this work. The authors declare no other competing interests. PEER REVIEW PEER REVIEW INFORMATION _Nature Cardiovascular Research_ thanks
Peter Libby, Claudia Monaco and the other, anonymous, reviewer(s) for their contribution to the peer review of this work. Primary Handling Editor: Elvira Forte, in collaboration with the
_Nature Cardiovascular_ _Research_ team. ADDITIONAL INFORMATION PUBLISHER’S NOTE Springer Nature remains neutral with regard to jurisdictional claims in published maps and institutional
affiliations. EXTENDED DATA EXTENDED DATA FIG. 1 PATHOLOGY ASSESSMENT AND RNA-FISH ANALYSIS OF CORONARY ARTERIES FROM DECEASED INDIVIDUALS WITH COVID-19. A) Bar plot (left) shows the number
of adaptive intimal thickening (AIT; _blue_, _n_ = 4), pathological intimal thickening (PIT; _magenta_, _n_ = 10), fibrocalcific (_orange_, _n_ = 10) and fibroatheroma (_red_, _n_ = 3)
specimens. Bar plot (right) shows the proportion of coronaries that presented pathological features of lipid pool, calcification, necrotic core, adventitial inflammation, and thrombus. B)
Bar plot showing the percentage of CD68+ area. Non-parametric Kruskal-Wallis test with Dunn’s test for multiple comparisons was performed. C) Bar plot showing the quantification of frequency
and total count of CD68+ cells in AIT (_n_ = 4), PIT (_n_ = 10), fibrocalcific (_n_ = 8) and fibroatheroma (_n_ = 3). Data are presented as mean values ± s.e.m. Non-parametric
Kruskal-Wallis test with Dunn’s test for multiple comparisons was performed. D) Bar plots of total cell number normalized by the area (mm2) of vasculature and perivascular fat. Each dot
represents a tissue section from AIT (_n_ = 12), PIT (_n_ = 15), fibrocalcific (_n_ = 24) and fibroatheroma (_n_ = 9). Data are presented as mean values ± s.e.m. One-way ANOVA with post-hoc
Tukey’s test for multiple comparisons was performed. E) Bar plots of total number of _CD68_ RNA+ cells quantified in the arterial wall and perivascular fat. Dots represent individual tissue
sections from AIT (_n_ = 6), PIT (_n_ = 12), fibrocalcific (_n_ = 16) and fibroatheroma (_n_ = 6). Data are presented as mean values ± s.e.m. One-way ANOVA followed by Holm-Šídák’s test for
multiple comparisons was performed. F) Bar plots of frequency of CD68+ SARS-CoV-2 Spike+ and CD68+ Spike antisense+ cells in AIT (_n_ = 3), PIT (_n_ = 6), fibrocalcific (_n_ = 8) and
fibroatheroma (_n_ = 3) coronaries. Non-parametric Kruskal-Wallis test followed by uncorrected Dunn’s test for multiple comparisons was performed. G) Scatter plot of Spearman’s rank
correlation (95% confidence interval) of total CD68 RNA copies with total SARS-CoV-2 spike and Spike antisense copies (_n_ = 20). H) SARS-CoV-2 S and S antisense quantification in total
tissue, vasculature, and perivascular fat from patients with (_n_ = 7 samples) versus without CV manifestations (_n_ = 13 samples). Data were normalized by tissue area (mm2) and presented as
mean values ± s.e.m. Rout method (Q = 1%) was used to remove outliers. Unpaired Mann-Whitney test was performed. EXTENDED DATA FIG. 2 ANALYSIS OF SARS-COV-2 TROPISM FOR HUMAN VASCULAR
SMOOTH MUSCLE CELLS. A) Differential gene expression analysis of _ACTA2_ and _CD68_ in vascular smooth muscle cells (VSMCs) and myeloid cell clusters from seven atherosclerotic coronary
samples. Wilcoxon Rank-Sum test was used to compare groups and adjusted p-values with Benjamini-Hochberg correction method are shown. B) Differential gene expression analysis of _Acta2_ mRNA
and _Cd68_ mRNA in lineage-tagged (Tdt+) SMC-derived cells dissociated from the aortic arches of atherosclerotic single-color Tomato reporter (_Myh11-CreERT2, Rosa26tdTomato/tdTomato,
ApoE__−/−_ _mice_) mice fed high fat diet (HFD) for 18 weeks versus control mice. Wilcoxon Rank-Sum test was used to compare groups and adjusted p-values with BH correction method are shown.
C) Representative images of spatial analysis of PIT coronary samples, and fibrocalcific and fibroatheroma (FCFA) samples showing the location of _ACTA2_+ cells, _ACTA2_+ SARS-CoV-2 Spike+
cells or _ACTA2_+ SARS-CoV-2 Spike antisense+ cells. Bar plots showing the number and frequencies of _ACTA2_+ cells/mm2, _ACTA2_+SARS-CoV-2 _Spike_ vRNA+ and _ACTA2_+ SARS-CoV-2 S antisense+
cells normalized by tissue area (mm2) in intimal thickening (PIT; _n_ = 6) versus fibrocalcific and fibroatheroma (_n_ = 3) coronaries. Mann-Whitney test (two-tailed) was performed. D)
Representative images of Oil Red-O staining of human VSMCs treated with 10 µg/mL of Cholesterol–methyl-β-cyclodextrin (Chol:MβCD) or vehicle overnight before infection and kept for 48 h. E)
Bar plots showing the frequencies of SARS-CoV-2 _Spike_ vRNA+, _ACTA2_+SARS-CoV-2 Spike vRNA+, SARS-CoV-2 S antisense+ and _ACTA2_+ SARS-CoV-2 _Spike_ antisense+ cells in vehicle and
Chol:MβCD conditions after infection with SARS-CoV-2 USA-WA1/2020 for 24 h. _n_ = 20 of vehicle and _n_ = 25 Chol:MβCD treated VSMCs in _Spike_ vRNA quantification experiment, _n_ = 21 of
vehicle and _n_ = 24 Chol:MβCD treated VSMCs in _Spike_ antisense quantification experiment. Mann-Whitney test (two-tailed) was used. EXTENDED DATA FIG. 3 SARS-COV-2 IN-VITRO INFECTION OF
HUMAN PRIMARY MACROPHAGES AND FOAM CELLS. A) Representative images of not-infected and infected macrophages and foam cells cultured with mNG reporter virus (MOI 0.1) at 24 hpi. Scale bar, 20
μm. B) Representative images of not-infected and SARS-CoV-2 infected macrophages and foam cells at 24 hours post-infection (hpi). Scale bar, 20 μm. C) Representative images of plaque assay
in VERO E6-TMPRSS2-T2A-ACE2 cells of culture supernatants of macrophages and foam cells cultured with SARS-CoV-2 USA- WA1/2020 at 2 hpi, 8 hpi, 24 hpi, and 48 hpi. Serial dilutions are
represented from left to right (-1 to -6). D) Bar plot showing the log10 FC of SARS-CoV-2 NP RNA levels normalized by 2 hpi samples (_n_ = 4 biological replicates) in infected macrophages
and foam cells. E) Bar plots showing the combined score of Gene Ontology (GO) Biological Process 2021 enrichment analysis of upregulated genes in infected macrophages, foam cells and or both
vs. non-infected counterparts. _P_ < 0.05. _*, P_ < _0.05; **, P_ < _0.01; ***, P_ < _0.001_. F) Heat map of log2 FC in complement genes between SARS-CoV-2 infected macrophages
(_n_ = 3) and SARS-CoV-2 infected foam cells (_n_ = 3) at 0 hpi, 2 hpi, 8 hpi, 24 hpi and 48 hpi. Adjusted _P_-values < 0.05 (FDR = 10%) were considered significant. G) Heat map of Log2
fold changes in lysosomal genes in SARS-CoV-2 infected cells vs. not infected cells at 2 hpi, 8 hpi, 24 hpi and 48 hpi. H) Heat map of Log2 fold changes in lysosomal genes in SARS-CoV-2
infected macrophages vs. foam cells at 2 hpi, 8 hpi, 24 hpi and 48 hpi. P-values < 0.05 were considered significant. _P_ < _0.05. *, P_ < _0.05; **, P_ < _0.01; ***, P_ <
_0.001_. I) Heat map of log2 FC in lipid metabolism genes in SARS-CoV-2 infected macrophages (_n_ = 3) vs. foam cells (_n_ = 3) at 2 hpi, 8 hpi, 24 hpi and 48 hpi. Adjusted _P_-values <
0.05 (FDR = 0.1) were considered significant. _P_ < 0.05. _*, P_ < _0.05; **, P_ < _0.01; ***, P_ < _0.00_1. J) Quantification of Caspase-8 concentration in culture supernatants
of not infected or SARS-CoV-2 infected macrophages and foam cells. One-way ANOVA with post-hoc Tukey’s test were performed. EXTENDED DATA FIG. 4 DYNAMICS OF CYTOKINE RESPONSE IN MACROPHAGES
AND FOAM CELLS AFTER SARS-COV-2 INFECTION. A) Heat maps of log2 FC of selected differentially expressed cytokine and chemokine genes in SARS-CoV-2 infected macrophages (_left_, _n_ = 3) and
foam cells (_right_, _n_ = 3) versus. non-infected counterparts at different hpi. _P_-values were adjusted using Benjamini-Hochberg correction (FDR = 10%). Adjusted _P_-values < 0.05 were
considered significant. Asterisk indicates an adjusted _P_-value < 0.05 for the comparison of infected vs not infected at each timepoint. Asterisk in parentheses indicates an adjusted
_P_ value < 0.05 for the interaction term of the model. _*, P_ < _0.05; **, P_ < _0.01; ***, P_ < _0.001_. B) Kinetic plots showing the area under the curve (AUC) of cytokines
and chemokines in the supernatant of SARS-CoV-2 infected and non-infected macrophages and foam cells (_n_ = 4 biological replicates, technical duplicates). For AUC comparisons, one-way ANOVA
with Tukey’s test for multiple comparisons was used. Bar plots represent Mean ± s.e.m. One-way ANOVA followed by Šídák’s test for multiple comparisons was performed. EXTENDED DATA FIG. 5
EX-VIVO SARS-COV-2 INFECTION OF HUMAN CAROTID VASCULAR EXPLANTS. A) Representative images of human atherosclerotic plaque tissues infected ex vivo with SARS-CoV-2 USA-WA1/2020 (105 PFU)
versus mock infected control shows the expression of spike protein and nucleoprotein (NP). Scale bar, 100 μm. B) Electron microscopy of human atherosclerotic carotid plaque tissue infected
ex vivo with the SARS-CoV-2. Scale bar, 1 μm. Black arrows indicate coronavirus-like particles. C) Heat map of selected cytokine and chemokine genes showing the log2 FC in SARS-CoV-2
infected carotid vascular explants versus not-infected tissues at different times post-infection. Wald test from DESeq2 package was used to test for significance. _P_ values were adjusted
using Benjamini-Hochberg correction (FDR = 10%) and denoted as an asterisk _*, P_ < _0.05; **, P_ < _0.01; ***, P_ < _0.001_. D) Kinetic plots showing the AUC of selected cytokines
and chemokines secreted by non-infected or SARS-CoV-2 infected carotid vascular explants (_n_ = 3 donors, technical duplicates) at different time post-infection. One-way ANOVA with Šídák’s
test for multiple comparisons was performed. Bar plots represent mean ± s.e.m. Unpaired _t_-test (two-tailed) was performed and _P_ < 0.05 was considered significant. EXTENDED DATA FIG. 6
SINGLE CELL RNA SEQUENCING ANALYSIS OF SARS-COV-2 ENTRY FACTORS IN VASCULAR MYELOID SUBCLUSTERS. A) Heat map shows transcripts expression (median _TPM_, transcripts per million) of
SARS-CoV-2 entry factors identified in lung, whole blood, heart (left ventricle and atrial appendage), aorta, and tibial and coronary arteries. B) Violin plots showing the log10 TMP + 1 of
tissue level expression of SARS-CoV-2 entry factors in lung, aorta, tibial and coronary artery identified. Data are presented as median ±IQR (25%-75% quartiles) in the box plot, violin plot
defines density of data in whole range. C) UMAP embedding of integrated total immune cells from carotid (_n_ = 10) and coronary (_n_ = 7) tissues. D) Gene expression of SARS-CoV-2 viral
entry factors and related genes projected onto the UMAP of total immune cells. E) UMAP representation of myeloid cell clusters colored by tissue origin. Dots represent individual cells
belonging to carotid (_red_) or coronary artery (_blue_). F) Heatmap displaying selected _z_-score scaled genes (_columns_) across myeloid cell subclusters (_rows_) from human coronary and
carotid samples. Canonical genes were used for myeloid subclusters annotations. EXTENDED DATA FIG. 7 ABROGATION OF SARS-COV-2 INTERACTION WITH HOST BY NRP-1 SMALL MOLECULE INHIBITOR AND
SILENCING RNA. A) Dot plot showing the relative expression levels of _NRP1_ RNA normalized by _GAPDH_ RNA expression in macrophages and foam cells. Average percentage of _NRP1_ silencing
efficacy were calculated and depicted at the top (_n_ = 4 biological replicates measured by technical duplicate per cell type, condition). B) Representative image of capillary western blot
(Wes) was performed to evaluate the protein expression levels of NRP1 after siRNA _NRP1_ or siRNA control treatment. Target protein NRP1 (130-140 kD) and β-actin loading control blots (42
kD) are shown. C) Total _NRP1_ RNA copies were quantified in not-infected macrophages and foam cells treated with either siRNA control or siRNA NRP1 (_n_ = 31 images of macrophages siRNA
control; _n_ = 26 macrophages siRNA NRP1, _n_ = 24 foam cells siRNA control, _n_ = 25 foam cells siRNA NRP1) at 24 hpi. D) Representative images and quantification of RNA-FISH showing _NRP1_
RNA in not-infected macrophages and foam cells. E) Representative images of RNA-FISH showing SARS-CoV-2 spike vRNA and _NRP1_ RNA (left), SARS-CoV-2 spike antisense vRNA and _NRP1_ RNA
(_right_) in infected macrophages and foam cells treated with non-targeting siRNA control or siRNA NRP1 at 24 hpi. F) Representative images of RNA-FISH showing SARS-CoV-2 S vRNA and _NRP1_
RNA (left), SARS-CoV-2 S antisense RNA and _NRP1_ RNA (_right_) in infected macrophages and foam cells with and without NRP1-blocking (EG00229 trifluoroacetate) at 24 hpi. EXTENDED DATA FIG.
8 DYNAMICS OF CYTOKINE RESPONSE IN NRP1- BLOCKING/SILENCING TREATED MACROPHAGES AND FOAM CELLS. A) Heat map of standardized _z_-scored gene expression of cytokines and chemokines in
not-infected, SARS-CoV-2 infected macrophages and foam cells treated with non-targeting siRNA control or siRNA NRP1 at 24 hpi. B) Quantification of TGF-β1 concentration (pg mL−1) in culture
supernatants of not infected (_n_ = 4) or SARS-CoV-2 infected macrophages and foam cells with (_n_ = 4) or without (_n_ = 8) NRP1-blocking treatment (EG00229 trifluoroacetate) at 24 hpi.
Data are presented as mean values ±s.e.m. One-way ANOVA with post-hoc Tukey’s test for multiple comparisons was performed. SUPPLEMENTARY INFORMATION SUPPLEMENTARY INFORMATION Supplementary
Figs. 1 and 2. REPORTING SUMMARY SUPPLEMENTARY TABLES Supplementary Tables 1–5. RIGHTS AND PERMISSIONS OPEN ACCESS This article is licensed under a Creative Commons Attribution 4.0
International License, which permits use, sharing, adaptation, distribution and reproduction in any medium or format, as long as you give appropriate credit to the original author(s) and the
source, provide a link to the Creative Commons license, and indicate if changes were made. The images or other third party material in this article are included in the article’s Creative
Commons license, unless indicated otherwise in a credit line to the material. If material is not included in the article’s Creative Commons license and your intended use is not permitted by
statutory regulation or exceeds the permitted use, you will need to obtain permission directly from the copyright holder. To view a copy of this license, visit
http://creativecommons.org/licenses/by/4.0/. Reprints and permissions ABOUT THIS ARTICLE CITE THIS ARTICLE Eberhardt, N., Noval, M.G., Kaur, R. _et al._ SARS-CoV-2 infection triggers
pro-atherogenic inflammatory responses in human coronary vessels. _Nat Cardiovasc Res_ 2, 899–916 (2023). https://doi.org/10.1038/s44161-023-00336-5 Download citation * Received: 13 February
2023 * Accepted: 23 August 2023 * Published: 28 September 2023 * Issue Date: October 2023 * DOI: https://doi.org/10.1038/s44161-023-00336-5 SHARE THIS ARTICLE Anyone you share the following
link with will be able to read this content: Get shareable link Sorry, a shareable link is not currently available for this article. Copy to clipboard Provided by the Springer Nature
SharedIt content-sharing initiative