- Select a language for the TTS:
- UK English Female
- UK English Male
- US English Female
- US English Male
- Australian Female
- Australian Male
- Language selected: (auto detect) - EN
Play all audios:
ABSTRACT Clonal hematopoiesis of indeterminate potential (CHIP) is caused by somatic mutations in hematopoietic stem cells and associates with worse prognosis in patients with heart failure.
Patients harboring CHIP mutations show enhanced inflammation. However, whether these signatures are derived from the relatively low number of cells harboring mutations or are indicators of
systemic pro-inflammatory activation that is associated with CHIP is unclear. Here we assess the cell-intrinsic effects of CHIP mutant cells in patients with heart failure. Using an improved
single-cell sequencing pipeline (MutDetect-Seq), we show that _DNMT3A_ mutant monocytes, CD4+ T cells and NK cells exhibit altered gene expression profiles. While monocytes showed increased
genes associated with inflammation and phagocytosis, T cells and NK cells present increased activation signatures and effector functions. Increased paracrine signaling pathways are
predicted and validated between mutant and wild-type monocytes and T cells, which amplify inflammatory circuits. Altogether, these data provide novel insights into how CHIP might promote a
worse prognosis in patients with heart failure. SIMILAR CONTENT BEING VIEWED BY OTHERS DNMT3A CLONAL HEMATOPOIESIS-DRIVER MUTATIONS INDUCE CARDIAC FIBROSIS BY PARACRINE ACTIVATION OF
FIBROBLASTS Article Open access 19 January 2024 CLONAL HAEMATOPOIESIS IN CARDIOVASCULAR DISEASE: PROGNOSTIC ROLE AND NOVEL THERAPEUTIC TARGET Article 02 April 2025 SINGLE-CELL
TRANSCRIPTOMICS REVEALS CELL-TYPE-SPECIFIC DIVERSIFICATION IN HUMAN HEART FAILURE Article Open access 16 March 2022 MAIN Somatic mutations are acquired during life in our body. Occurrence of
leukemogenic mutations in hematopoietic stem cells can result in clonal expansion of affected stem cells, a process called clonal hematopoiesis (CH)1. CH is associated with a poor prognosis
of affected subjects, which is only in rare cases (0.5–1.0% per year) due to leukemia, but is mediated by other age-related diseases, particularly cardiovascular disease2,3. We and others
have shown that CH driver mutations in the epigenetic regulators DNMT3A and TET2 are associated with a poor prognosis of patients with heart failure4,5. Several studies point to a critical
role of inflammatory activation of circulating hematopoietic cells induced by the CH driver mutations6,7. Gene editing or silencing of _DNMT3A_ and _TET2_ in monocytes resulted in increased
expression of various inflammatory cytokines7,8. Moreover, bone marrow transplantation of _DNMT3A_ and _TET2_ heterozygous cells impaired heart function after angiotensin II infusion and
increased the number of macrophages and T cells infiltrating the heart7. In humans, circulating cells of patients with _DNMT3A_ CH driver mutations showed an increased expression of
inflammatory genes at single-cell level9. Overall, these data support a pro-inflammatory effect of CH driver mutation. However, the cell-intrinsic effects of the rather small number of
mutated cells, which is between 0.5% and 20% in most patients, are unclear. In this study, we combined single-cell RNA sequencing (scRNA-seq) with Oxford Nanopore long-read sequencing to
identify _DNMT3A_ mutant cells within the circulating immune cells from patients with heart failure and determined the gene expression at single-cell level. RESULTS MUTDETECT-SEQ IDENTIFIES
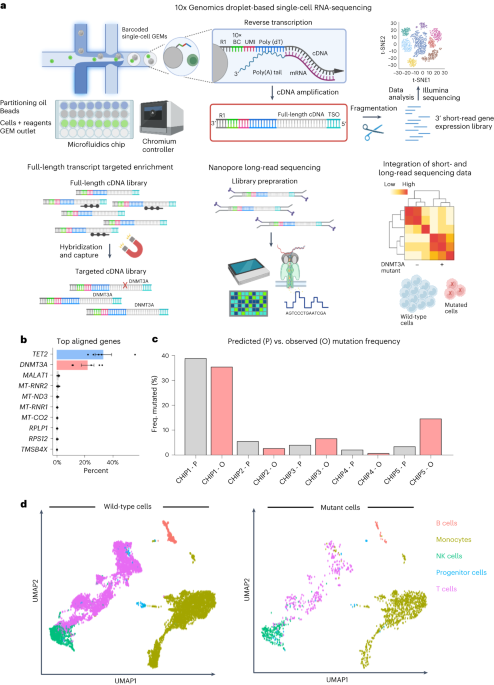
_DNMT3A_ MUTANT CELLS To identify _DNMT3A_ mutant cells at a single-cell level, we developed MutDetect-Seq (Fig. 1a and Extended Data Fig. 1a). MutDetect-Seq combines short-read single-cell
gene expression profiling (10x Genomics) with Oxford Nanopore Technologies (ONT) long-read sequencing. For this purpose, amplified full-length transcripts generated during 10x Genomics
library preparation were subjected to two sequential rounds of hybridization and capture for CH gene, using tiled capture probes spanning all exons to capture the full-length transcript
(here we used _DNMT3A_ and _TET2_ as examples; Fig. 1b). This is followed by Oxford Nanopore long-read sequencing of enriched and barcoded transcripts (Fig. 1a and Extended Data Fig. 1a–c).
This protocol links the presence of a defined mutation to the 10x barcode of a single cell to compare the gene expression of mutated cells with wild-type cells by bioinformatically
integrating the information from short-read and long-read sequencing (Fig. 1a). MutDetect-Seq was applied to unravel characteristics of _DNMT3A_ mutant cells. Specifically, we used
circulating immune cells from five patients with heart failure known to have _DNMT3A_ mutations (Extended Data Tables 1 and 2)8. Targeted enrichment of the cDNA library with _DNMT3A_ capture
probes resulted in a 10,000-fold mean enrichment of targeted _DNMT3A_ transcripts together with a depletion of non-targets, including _GAPDH_, _CD3_ and _TRAC_ (Extended Data Fig. 1b,c).
_DNMT3A_ mutations were identified by using an adapted bioinformatic analysis Sicelore pipeline (Extended Data Fig. 1a)10. Due to the use of capture probes targeting the full-length
transcript, the bioinformatics analysis allowed the identification of specific mutations in the coding sequence of _DNMT3A_ (Extended Data Figs. 2a and 3a) and _TET2_ (Extended Data Fig.
2b). Focusing on the _DNMT3A_ mutations, the resulting mutation matrices of _DNMT3A_ clonal hematopoiesis of indeterminate potential (CHIP) carriers were then combined with the single-cell
short-read sequencing datasets to identify transcriptomic changes of mutated and non-mutated cells. Overall, we could identify 2,035 _DNMT3A_ mutant versus 14,197 wild-type cells. To assess
if our method identifies the predicted number of mutant cells, we compared the percentages of mutant versus wild-type cells identified by MutDetect-Seq with the variant allele frequency
(VAF) of the mutations determined by previous targeted DNA sequencing of whole blood. The comparison revealed that the incidence of mutant cells in the individual patients correlated with
_DNMT3A_ VAFs from previous targeted DNA sequencing (Fig. 1c), suggesting that the mutated cells were correctly identified by the MutDetect-Seq approach, with VAF detection being in a
reasonably anticipated range relative to traditional targeted DNA sequencing. To assess the distribution of mutant cells in the different blood cell populations, total cells were clustered.
Dimensional reduction of the total 16,232 cells revealed 13 clusters, which were assigned to monocytes (45%), T cells (41%), natural killer (NK) cells (10%), B cells (3%) and progenitor
cells (1%) (Fig. 1d and Extended Data Fig. 3b,c). The annotation and classification of the clusters was determined by expression of cell-type-specific markers (Extended Data Fig. 3b).
Consistent with the multipotent pattern of _DNMT3A_ CHIP mutations11, we detected mutant cells in monocytes, T cells, NK cells, B cells and progenitor cells (Fig. 1d and Extended Data Fig.
3d). No enrichment of mutations was detected in one of the cell types (Extended Data Fig. 3d). Mutant cells did not form an individual cluster but were intermingled with wild-type cells in
annotated clusters in uniform manifold approximation and projection (UMAP) plots (Fig. 1d) or when using an advanced clustering tool, such as MILO (Extended Data Fig. 3e). Next, we
determined the effect of _DNMT3A_ mutations on gene expression in the individual cell populations. Even after accounting for differing numbers of cells by downsampling of the different cell
populations examined, the _DNMT3A_ mutation-carrying monocyte population showed the largest number of significantly upregulated genes, whereas the number of significantly upregulated genes
was lower in the _DNMT3A_ mutant T cells and NK cells (Extended Data Fig. 3f,g; F shows results from all cells, and G shows results upon downsampling). MUTANT MONOCYTES HAVE HEIGHTENED
INFLAMMATORY SIGNATURES Because _DNMT3A_ mutant monocytes showed the highest number of differentially regulated genes (Extended Data Fig. 3f,g), we first performed an in-depth analysis of
monocytes. Subclustering of the total monocytes identified classical monocytes (_CD14__+_/_FGCR3A__low_), non-classical monocytes (_CD14__low_/_FGCR3A__+_) and intermediate monocytes
(_CD14__mid_/_FCGR3A__mid_) (Fig. 2a,b). Classified monocyte subsets expressed the known characteristic monocyte class marker genes (for example, increased inflammatory markers such as
_CCR2_ in classical monocytes), thus validating the bioinformatics selection procedure (Extended Data Fig. 4a–d). We first addressed if _DNMT3A_ mutant cells might be enriched in one of the
subclusters, but we did not find significant changes in proportions between wild-type and mutant cells in the different monocyte classes (Fig. 2c). Because classical monocytes comprise the
largest monocyte cell population, we downsampled the three groups to equal numbers to avoid bias. After downsampling, the difference in the number of differentially expressed genes was
negligible (Fig. 2d) relative to analysis without downsampling (Extended Data Fig. 4e). Specifically, we detected significant and distinct changes in gene expression patterns when we
analyzed mutant and wild-type cells in classical monocytes of the individual patients by a paired comparison (Fig. 2e) and in classical monocytes in a pooled comparison of mutant versus
wild-type cells (Fig. 2d,f). The analysis confirmed previous signatures observed when comparing total cells of _DNMT3A_ CHIP mutant carriers versus non-CHIP carriers and identified
additional pathways along with further enrichment of Gene Ontology (GO) terms related to inflammation (Extended Data Fig. 4f). In detail, classical monocytes showed differential expression
of 204 genes associated with GO terms such as ‘inflammatory response’, ‘positive regulation of cytokine production’ and ‘regulation of cell–cell adhesion’ (Fig. 2g). Unique pathways called
in this study also associate with cell killing and PECAM1 interactions. Highly expressed genes in _DNMT3A_ mutant monocytes include members of the S100A family, specifically _S100A8_ and
_S100A9_ (Fig. 2h), which are pro-inflammatory, Ca2+-binding proteins known to stimulate leukocyte recruitment and induce cytokine secretion12. Elevated plasma levels of S100A8/A9 associate
with increased risk of coronary events and all-cause mortality in patients with heart failure13,14. Notably, _DNMT3A_ mutant monocytes further showed enriched expression of _CCR2_ (Fig. 2h),
which mediates homing of pro-inflammatory bone-marrow-derived cells to the injured heart15. Furthermore, the CCAAT/enhancer-binding protein gene subunit delta (_CEBPD_, also known as
nuclear factor of IL-6) was upregulated in mutant cells (Extended Data Fig. 5a). CEBPs are induced by LPS, IL-1 and IL-6 and bind to regulatory regions of acute phase and cytokine genes,
such as _IL6_, _TNF_, _IL8_ and _GCSF_16. Interestingly, the proteoglycan serglycin (_SRGN_), which is upregulated in mutant cells (Fig. 2h), has been shown to be involved in TGF-β-mediated
migration, macrophage-mediated extracellular matrix changes as well as inflammatory signaling17,18,19,20. Furthermore, mutant monocytes also show elevated calreticulin (_CALR_) (Fig. 2h).
Previous studies showed that activated macrophages secrete calreticulin, which binds to the surface of living target cells and targets their removal by programmed cell phagocytosis21.
Interestingly, we also found an upregulation of genes associated with phagocytosis and phagolysosome capacity in _DNMT3A_ mutant cells. Thus, the primary component of the microbicidal
oxidase system of phagocytes (_CYBA_) is significantly upregulated in mutant cells (Fig. 2h). _CYBA_ is part of the phagolysosome machinery, which requires enhanced trafficking and fusion of
the phagosome to the lysosome and is supported via _ARF1_ and _CD63_ (both upregulated in mutant cells) (Fig. 2h and Extended Data Fig. 5a). Excessive monocyte activation and cell targeting
may promote poorly directed macrophage phagocytosis having implications for tissue damage after monocyte extravasation. Moreover, CYBA associates with NOX3 to form a functional NADPH
oxidase constitutively generating superoxide, which is well established to contribute to progression of heart failure22,23. Downregulated genes include members of the major
histocompatibility complex (for example, HLA), genes encoding subunits of the small or large ribosome (for example, _RPL36A_) and the poorly characterized galectin-2 (_LGALS2_) (Fig. 2j and
Extended Data Fig. 5c). As _DNMT3A_ driver mutations are loss-of-function mutations, we confirmed _DNMT3A_-dependent gene regulation by silencing _DNMT3A_ in THP1 macrophages and analyzed
genes of interest by scRNA-seq. We could confirm a significant upregulation of _S100A8/A9_, _SRGN_, _CYBA_, _CALR_, _CCR2_ and _MCEMP1_ as well as a decrease in _LGALS2_ in _DNMT3A_-silenced
THP1 macrophages (Fig. 2i,k and Extended Data Fig. 5b). Together, these data decipher the specific pro-inflammatory gene activation in _DNMT3A_ mutant monocytes, demonstrating additional
molecules, such as proteoglycan serglycin, phagolysosome genes, _MCEMP1_ and calreticulin, previously undescribed for CHIP-carrying patients with heart failure. DYSREGULATED GENE EXPRESSION
IN _DNMT3A_ MUTANT-CARRYING T CELLS Although we detected a low number of significantly upregulated genes in T cells, we wanted to explore the influence of _DNMT3A_ mutations on T cell
subsets in these smaller populations. Subclustering of annotated T cells revealed CD4+ and CD8+ T cells and their subpopulations identified by typical markers (Fig. 3a–c,g–i).
Patient-specific analysis was only powered to assess naive T cells, with grouped analysis performed for other populations. These data do not demonstrate a significant decrease in the
proportion of mutant cells in naive CD4+ cell population or increases in effector cell populations (Treg, Th1, Th2 or Th17) (Fig. 3d,e). However, grouped analysis demonstrated 21 upregulated
genes in CD4+ mutant cells versus wild-type cells, which confirmed a relative induction of effector function in mutant T cells (Fig. 3f)24,25,26,27,28. Thus, established markers of T cell
effector and killing function, such as lysozyme (_LYZ_) and _CXCL8_, are significantly upregulated in mutant CD4+ T cells. In addition, CD4+ mutant T cells showed increased expression of
drivers of proliferation, such as selenoprotein F (_SELENOF_), and markers of T cell differentiation, such as _SLAMF6_ (Fig. 3f). When analyzing the second major T cell cluster, CD8+ T cells
(Fig. 3g–i), we found no notable change in cluster distribution (Fig. 3j). Surprisingly, we found only three significantly upregulated genes (Fig. 3k) and one downregulated gene (Fig. 3l)
in CD8+ T cells, despite CD8+ T cells being more abundant relative to CD4+ T cells (289 mutant CD8+ T cells (7.7% of CD8+ population) and 125 mutant CD4+ T cells (5% of CD4+ population)).
The upregulated genes are poorly described, with one RNA having a non-coding status. Interestingly, the downregulated gene USP3 is a ubiquitin ligase, which is known to inhibit type I
interferon signaling by deubiquitinating RIG-I-like receptors specifically during viral infection29. Given that NK cells displayed the second highest number of differentially upregulated
genes in the peripheral blood mononuclear cell (PBMC) population (41 genes), we finally assessed the impact of CHIP mutations on these cells. Interestingly, NK cells showed upregulation of
the important lysozyme molecule (_LYZ_) by 1.4-fold (adjusted _P_ = 3.9 × 10⁻¹⁶). Neutrophils use lysozyme for selected killing via apoptosis30. Together, our findings suggest a predominant
impact of _DNMT3A_ mutations on CD4+ T cells and NK cells, whereas CD8+ T cells appear less affected. _DNMT3A_ SILENCING ALTERS CD4+ T CELL AND NK CELL ACTIVATION To assess if _DNMT3A_
indeed directly affects T cell functions, we silenced _DNMT3A_ in naive CD4+ T cells (Fig. 4a and Extended Data Fig. 6a) and performed in vitro activation and polarization into Th1, Th2 and
Th17 CD4+ T cell subsets (Fig. 4b,c). Whereas non-polarized CD4+ T cells showed little response to _DNMT3A_ silencing (Fig. 4c, Th0 cells, and Extended Data Fig. 6b), T helper cell cytokines
and transcription factors in _DNMT3A_-silenced CD4+ T cells showed a global activation profile when exposed to Th1-polarizing and Th2-polarizing conditions with significantly increased
levels of IL-4 in Th2 cells (Fig. 4c–e and Extended Data Fig. 6b). These data suggest that Th1 and Th2 CD4+ T cells may gain effector functions in response to _DNMT3A_ silencing. To
investigate the role of _DNMT3A_ in NK cells, _DNMT3A_ was silenced in the NK cell line NKL (Fig. 4f,g). _DNMT3A_-silenced NK cells showed upregulation of the NK cell marker CD56 as well as
increased levels of the effector cytokines _TNFA_ and _IFNG_ (Fig. 4h,i and Extended Data Fig. 7a). In line with this observation, _DNMT3A_-silenced NK cells showed increased cytotoxic
capacity toward co-cultured human umbilical venous endothelial cells (HUVECs) (Fig. 4j and Extended Data Fig. 7b). These data support a direct effect of _DNMT3A_ on functional properties of
CD4+ T cells and NK cells. MUTANT TO WILD-TYPE CELL INTERACTIONS AUGMENT INFLAMMATION Our data support a cell-intrinsic augmented inflammatory signature in _DNMT3A_ mutant monocytes and T
cells. However, the number of mutated cells in patients is low, and it is unclear how such small numbers of activated cells can impact the prognosis of heart failure31. This raises the
question of whether mutant cells indirectly promote the inflammatory response by activating wild-type cells. To address this question, we analyzed the outgoing and incoming signaling
strengths in mutant and wild-type cells by performing a ligand–receptor analysis with CellChatDB32 using all major annotated immune cell types. The differential interactions in the cell–cell
communication networks between wild-type and mutant immune cells was determined and visualized, where red-colored edges represent increased signaling in the mutant immune cells compared to
the wild-type immune cells, whereas blue color indicates decreased interactions (Fig. 5a,b). Thereby, both the numbers of interactions (Fig. 5a) and interaction strength (Fig. 5b and
Extended Data Fig. 8a) were increased in mutant monocytes compared to wild-type monocytes, NK cells and T cells. Mutant T cells showed less outgoing signaling changes relative to wild-type T
cells (Fig. 5a,b). We also compared the information flow (that is, the overall communication probability) across the mutant and wild-type immune cells with secreted extracellular factors
such as thrombospondin 1 (THBS1) and TGF-β being implicated in mutant signaling (Fig. 5c,d and Extended Data Fig. 8a,b). Interestingly, these associations were driven by mutant monocyte
interactions, which showed increased signaling and relative expression of _THBS1_, _NAMPT_, _CCL5_, _RETN_ and _TGF-β_ (Fig. 5c,d). Examples for significantly associated ligand–receptor
interaction pairs are THBS1–CD36 or THBS1–CD47, RETN–CAP1 or RETN–TLR4 and TGFB1–TGFBR2 (Fig. 5c,d). Many of these interactions have known regulatory functions in monocytes. THBS1
interactions are involved in cell adhesion and the phagocytosis of apoptotic cells33; NAMPT is involved in monocyte/macrophage differentiation, polarization and migration34; RETN mediates
monocyte recruitment and promotes inflammation35; and TGF-β is well known for its pro-fibrotic activity36. These data suggest that mutant monocytes can interact and possibly activate
wild-type monocytes in a paracrine manner. To determine the biological relevance of our in silico findings, we investigated whether _DNMT3A_ silencing might indeed lead to a paracrine
activation of wild-type monocyte-derived macrophages (Fig. 6a and Extended Data Fig. 8c). Therefore, we tested the effects of supernatants of _DNMT3A-_silenced macrophages on wild-type
macrophages and showed that the supernatants indeed induced the expression of prototypical pro-inflammatory genes (for example, _IL1B_, _IL6_ and _TNFA_) (Fig. 6b). To next assess if the
macrophages, which are activated by the supernatants from _DNMT3A_-silenced macrophages, may contribute to cardiac dysfunction, we determined their paracrine effects on cardiomyocytes (Fig.
6c). Indeed, the supernatants of the pre-activated macrophages increased the cell size of cardiomyocytes (siNC supernatant-treated mean size: 4,512 µm2; siDNMT3A supernatant-treated mean
size: 5,118 µm2) (Fig. 6d,e). These data demonstrate that _DNMT3A_ mutant macrophages indirectly can promote pro-hypertrophic activity of wild-type macrophages. Because our in silico
analysis additionally predicted an increased interaction of mutant monocytes with T cells (Fig. 5a), we also determined the influence of the supernatants of _DNMT3A_-silenced
monocyte-derived macrophages on CD4+ T cells (Fig. 6f). Naive CD4+ T cells stimulated with the conditioned medium of _DNMT3A_-silenced macrophages expressed increased levels of cytokines
(IL-4 and IL-17) and transcription factors (T-bet and GATA3) indicative of CD4+ T cell differentiation (Fig. 6g and Extended Data Fig. 6b). Because an increased polarization of T cells,
particularly Th17 cells, is associated with cardiac fibrosis in humans37,38, we analyzed the capacity of CD4+ T cells exposed to supernatants from _DNMT3A_-silenced macrophages to activate
human cardiac fibroblasts (HCFs) (Fig. 6f). Therefore, fibroblasts were cultured in the presence of supernatants from stimulated CD4+ T cells. Fibroblasts showed increased expression of the
activation marker αSMA and COL1A1 after exposure to supernatants from CD4+ T cells stimulated with conditioned medium from _DNMT3A-_silenced macrophages (Fig. 6h,i). Together, these data
suggest that _DNMT3A_ mutant macrophages can activate wild-type macrophages and CD4+ T cells, indirectly promoting hypertrophy and fibrosis of cardiac cells in a paracrine manner (Fig. 7).
DISCUSSION Here we provide novel insights into the cell-intrinsic effect of _DNMT3A_ mutations on circulating blood cells in the context of heart failure. Our data demonstrate that _DNMT3A_
mutant cells can be retrieved in all major cell populations, a finding that is consistent with previous reports documenting the multipotent pattern of _DNMT3A_ CHIP mutations and lack of
effects on blood cell counts12. Mutant cells were not enriched in any of the cell types and did not form a new entity but accumulated throughout the clusters, which is consistent with
findings in CD34+cells2. However, _DNMT3A_ mutations induced a substantially altered gene expression in the affected cells compared to wild-type cells in the same individual. It should be
noted that, by comparing circulating cells from patients with established heart failure with versus without _DNMT3A_ CHIP driver mutations, the observed effects are demonstrated on top of
the presence of heart failure, which, by itself, is known to be associated with inflammatory activation of circulating blood cells. Dysregulated gene expression was predominantly observed in
monocytes and NK cells, whereas only limited effects of _DNMT3A_ mutants on T cells were observed. However, when subsetting the diverse T cell populations into CD4+ and CD8+ T cells, gene
expression was considerably altered in the CD4+ T cell population. Here, _DNMT3A_ mutant cells showed gene expression profiles that are indicative of T cell activation and increased effector
functions. These findings were substantiated by showing that silencing of _DNMT3A_ leads to the induction of Th1-, Th2- and Th17-related markers in CD4+ T cells, when additional cytokines
were added to stimulate T cell polarization. It would be interesting to further gain insights into the gene expression profiles of the specific T cell populations in patients carrying
_DNMT3A_ mutations; however, this study does not have sufficient numbers of wild-type and mutant cell numbers to perform in-depth analyses on these divergent populations. The direct effects
of _DNMT3A_ on the activation of T cells observed in the in vitro studies may, however, be particularly relevant in cardiac disease, given that T cells, specifically Th17 cells, are known to
aggravate heart failure39,40. Most notably, we also showed that _DNMT3A_ mutations or _DNMT3A_ silencing promoted NK cell effector functions and increased their cytolytic activity toward
endothelial cells. NK cells are less well studied, but clinical abnormalities in the numbers and functions of NK cells are observed in myocarditis and inflammatory dilated cardiomyopathy,
suggesting their role as regulators of cardiac function. Additionally, it has been shown that NK cells, via T-bet and IFNG signaling, play an essential role in angiotensin II-induced
vascular dysfunction, driving increased NK cell recruitment and endothelial dysfunction41,42. The differentially expressed genes in mutant monocytes confirmed previous studies showing a
pro-inflammatory activation of myeloid cells after _DNMT3A_ gene editing or depletion7. Also, many of the genes, such as S100 family members, were observed in the overall circulating cell
population of patients with heart failure who carry a _DNMT3A_ mutation versus NO-CHIP carriers8. Overlap in genes of total peripheral blood analysis of CHIP versus NO-CHIP patients with
cell-intrinsic regulation of mutant cells suggests that the mutant cells are indeed the major driver in altered gene expression signatures found in CHIP patients despite representing only a
few percent of the total cell population. Our study additionally suggests that the mutant cells can aggravate inflammation in the wild-type cells via a paracrine mechanism. Specifically,
_DNMT3A-_silenced macrophages induced the pro-inflammatory activation of wild-type macrophages, which further induced hypertrophy of cardiomyocytes. Moreover, the supernatants of
_DNMT3A-_silenced macrophages stimulated T cell polarization and stimulated the capacity of the T cells to activate fibroblasts. These paracrine activation mechanisms induced by the
relatively small number of mutant cells may contribute to the progression of heart failure shown in clinical studies4,5. Interestingly, cell communication analysis identified thrombospondin,
resistin, NAMPT and TGF-β as important drivers in cellular interaction. All these genes have known effects in monocytes and may further fuel inflammation. However, many have also
bidirectional and context dependent effects43, and in vivo studies are warranted to determine the specific roles of these genes in mediating pathological effects aggravated by _DNMT3A_ CHIP
in the context of heart failure. In addition to providing, to our knowledge, the first evidence for the cell-intrinsic effects of _DNMT3A_ mutations on peripheral blood cell subsets in
patients with heart failure, the experimental approach may be helpful to address the effects of the various CHIP driver genes in a disease context. Given that mutations of multiple genes
appear to be linked to heart failure44, this may allow one to determine whether a common pro-inflammatory signature underlies the detrimental effects of the mutations or whether
mutation-specific gene expression and functional effects can be observed. This also may have therapeutic consequences as it may lead to mutation-specific treatment strategies.
Patient-specific and mutation-specific treatment is routinely done in the cancer field but is sparse in the treatment of cardiovascular disease. As such, this study may, in the long run,
offer increased opportunities. METHODS The study adheres to all relevant ethical guidelines and was approved by the local ethics review board (Ethikkommission des Fachbereichs Medizin der
Goethe-Universität) and complies with the Declaration of Helsinki. SCRNA-SEQ STUDY POPULATION AND BLOOD COLLECTION Blood was obtained of patients with chronic heart failure at approximately
the same time (between 10:00 and 12:00) on study days. Informed consent was obtained from all patients. The study was approved by the local ethics review board and complies with the
Declaration of Helsinki. Patients were eligible for inclusion into the study if they had stable chronic heart failure symptoms New York Heart Association (NYHA) classification of at least II
and had a previous myocardial infarction at least 3 months before recruitment. Exclusion criteria were the presence of acutely decompensated heart failure with NYHA class IV, an acute
ischemic event within 3 months before inclusion, a history of severe chronic disease, documented cancer within the preceding 5 years or unwillingness to participate. Blood was collected in
sodium citrate–containing cell preparation tubes (CPT Vacutainer, Becton Dickinson), which were centrifuged at 1,500_g_ for 20 min at room temperature. The upper layer containing mononuclear
cells and plasma was collected, and cells were washed and then stored until used for droplet scRNA-seq. The six patients in this study were male, averaged 66 years of age, gave consent for
this study and were not compensated. SCRNA-SEQ LIBRARY PREPARATION Cellular suspensions were loaded on a 10x Chromium Controller (10x Genomics) according to manufacturer’s protocol based on
the 10x Genomics proprietary technology. scRNA-seq libraries were prepared using Chromium Single Cell 3′ Reagent Kit version 3 (10x Genomics) according to the manufacturer’s protocol. In
brief, the initial step consisted of performing an emulsion capture where individual cells were isolated into droplets together with gel beads coated with unique primers bearing 10x cell
barcodes, unique molecular identifiers (UMIs) and poly(dT) sequences. Reverse transcription reactions were engaged to generate barcoded full-length cDNA followed by the disruption of
emulsions using the recovery agent and cDNA cleanup with Dynabeads MyOne Silane Beads (Thermo Fisher Scientific). Bulk cDNA was amplified using a Biometra Thermocycler TProfessional Basic
Gradient with 96-well sample block (98 °C for 3 min; cycled 14×: 98 °C for 15 s, 67 °C for 20 s and 72 °C for 1 min; 72 °C for 1 min; held at 4 °C). Amplified cDNA product was cleaned with
the SPRIselect Reagent Kit (Beckman Coulter). Indexed sequencing libraries were constructed using the reagents from the Chromium Single Cell 3′ Reagent Kit version 3, as follows:
fragmentation, end repair and A-tailing; size selection with SPRIselect; adaptor ligation; post-ligation cleanup with SPRIselect; sample index polymerase chain reaction (PCR) and cleanup
with SPRIselect beads. Library quantification and quality assessment was performed using Bioanalyzer Agilent 2100 using a High Sensitivity DNA Chip (Agilent). Indexed libraries were
equimolarly pooled and sequenced on two Illumina NovaSeq 6000 instruments using paired-end 26 × 98-bp as sequencing mode. For preparing the scRNA-seq library of THP1 samples, the cells were
labeled following Cell Multiplexing Oligo (CMO) Labeling for Single Cell RNA Sequencing Protocols with Feature Barcode technology (10x Genomics). In brief, 0.2 × 10⁶ cells of each sample
were labeled with the CMOs. After the washing steps, the cells were additionally labeled using the TotalSeq-B Human Universal Cocktail version 1.0 (BioLegend), following the manufacturer’s
instructions. The cellular suspension was loaded on a 10x Chromium Controller (10x Genomics) and processed following Chromium Next GEM Single Cell 3′ Reagent Kits version 3.1 (Dual Index)
with Feature Barcode technology for Cell Surface Protein and Cell Multiplexing. cDNA was generated using an 11-cycle program (described above). Then, 3′ Gene Expression Library, Cell Surface
Protein Library and Cell Multiplexing Library were generated using 13-, 10- and 6-cycle programs, respectively. FASTQ files were processed using Cell Ranger 7.0.0 (10x Genomics) and aligned
to the human reference genome GRCh38 according to the manufacturer’s instructions. CHIP GENE CAPTURE PROBE DESIGN A target enrichment library (Roche–NimbleGen) was designed by obtaining
gene annotations of CHIP-associated genes _DNMT3A_ and _TET2_. For each gene, genome coordinates of their corresponding exons were obtained from the GRCh38 primary assembly. Design of probes
from target regions and synthesis was performed by Roche–NimbleGen using the SeqCap RNA Choice format with a maximum of five matches to the human genome. In total, 34 exons were targeted by
the CaptureSeq array. SINGLE-CELL TARGETED ENRICHMENT Before targeted enrichment, a fraction of amplified full-length cDNA from 10x Genomics library construction (2–5 ng) was re-amplified
with KAPA HiFi HotStart ReadyMix (Roche) and 3 µM of each TSO primer NNNAAGCAGTGGTATCAACGCAGAGTACAT and R1 primer NNNCTACACGACGCTCTTCCGATCT. Adopted from previous work10, the Ns at the
primer 5′ end were introduced to avoid preferential amplification of reverse reads. The cycling conditions were as follows: initial denaturation at 98 °C for 3 min, followed by 20 cycles of
98 °C for 30 s, 64 °C for 30 s and 72 °C for 5 min and a final elongation at 72 °C for 10 min. PCR products were purified with 0.6× SPRIselect (Beckmann Coulter), eluted with 40 µl of
nuclease-free water and quantified with a Qubit 4 Fluorometer (Thermo Fisher Scientific). To enrich transcripts of interest, the amplified full-length cDNA (0.5–1 µg) was subjected to two
sequential hybridization and capture reactions following the KAPA HyperCap Workflow version 3.0 (Roche). In brief, the cDNA library was hybridized to 2 µl of biotinylated KAPA HyperChoice
Costum Probes (Roche) at 55 °C for 16 h, excluding Universal Enhancing Oligos, and incubated with Capture Beads for 15 min. A series of washes was performed to remove unbound cDNA. After the
first capture, the enriched cDNA library was amplified with KAPA HiFi HotStart ReadyMix (Roche) and 1 µM of each TSO and R1 primer in an on-bead PCR for five cyles (98 °C for 3 min, cycles
of 98 °C for 30 s, 64 °C for 30 s and 72 °C for 5 min and 72 °C for 10 min). The enriched cDNA library underwent a second hybridization and capture at similar conditions, followed by an
on-bead PCR for 25 cycles with two amplification reactions per sample. After each post-capture amplification, the Capture Beads were magnetically removed from the PCR reaction, and the
enriched cDNA library was cleaned up with KAPA HyperPure Beads. Finally, the enriched cDNA library was analyzed on a High Sensitivity DNA Chip (Agilent), and the enrichment of targeted
transcripts was assessed by quantitative real-time PCR (qPCR) before Oxford Nanopore library preparation. OXFORD NANOPORE LONG-READ SEQUENCING Nanopore sequencing libraries were prepared
from 200 fmol targeted capture cDNA library using the Ligation Sequencing Kit (SQK-LSK110) and the Amplicons by Ligation Protocol (ONT). Adapter-ligated libraries (20–50 fmol) were loaded on
MinION106D (R9.4.1) flow cells and sequenced on either an Oxford Nanopore Mk1C device with MinKNOW Software at Goethe University or an Oxford Nanopore PromethION device by FutureGenomics.
Base calling was performed offline on a high-performance computing cluster using ONT’s Albacore software pipeline (version 2.2.7). NANOPORE READ MAPPING Reads from the Nanopore sequencing
were mapped to the human reference genome (GRCH38) via minimap2 version 2.24 in splice alignment mode with the following parameters: ‘-ax splice -uf–MD–sam-hit-only -t 20–junc-bed’. Before
the cellBc and UMIs were assigned, we added the gene name, nanopore read sequence and the read quality to the SAM record via the Sicelore companion tools AddGeneNameTag and
AddBamReadSequenceTag, as proposed in the Sicelore protocol10. CELLBC AND UMI ASSIGNMENT TO NANOPORE READS To assign cellBC and UMI sequences to the mapped Nanopore reads, we basically
followed the Sicelore protocol suggested by Lebrigand et al.10. In brief, valid cellBC and UMIs were extracted from the single-cell BAM file with the IlluminaParser tool. Afterwards,
Nanopore reads are parsed for poly-(A/T) and adapter sequences via NanoporeReadScanner. Only reads containing both were kept for further processing. After the Nanopore reads were mapped as
described in the previous subsection, cellBC and UMIs were searched in the BAM file, with an allowed edit distance of 1. If successful, the tool NanoporeBC_UMI_finder adds both sequences as
flags to the SAM/BAM record. To reduce the impact of sequencing errors, reads with identical mapping positions in the target gene and identical UMI barcodes were used to generate a consensus
sequence. For this purpose, the ComputeConsensus tool was used, with default parameters. These consensus sequences are then mapped to the human reference genome. The previously detected
single-nucleotide polymorphisms (SNPs) were then individually searched in the patients using the tool SNPMatrix. A cell was assigned as ‘mutated’ if only the mutated allele could be detected
or the mutated allele was detected along with the original allele. If no sequences were detected at the mutation site, the reads were assigned as ‘no-coverage’. If only the native alleles
could be found, the cells were assigned as ‘non-mutated’. Finally, the mutation information for each patient was assigned the cells in the Seurat objects with the function
combineSeuratandSicelore. All steps described in the above subsection were automatized in the run_sicelore.sh bash script. All scripts and source codes can be found at
https://github.com/djhn75/Sicelore-scRNA-Integration. SHORT-READ SCRNA-SEQ Each library was sequenced at high coverage on a NovaSeq 6000 sequencing system (Illumina) using the paired-end
150-bp approach (Illumina) as specified by the manufacturer. BCL files were converted and demultiplexed in BaseSpace by Illumina. SCRNA-SEQ DATA ANALYSES Single-cell expression data were
processed using STARsolo (version 2.7.3a) to perform quality control, barcode processing and single-cell 3′ gene counting. Sequencing reads were aligned to the human reference genome
(GRCh38). STARsolo was run with default parameters, and quality and content of the sequenced libraries were assessed (Extended Data Table 2). Further analysis was performed in Seurat
(version 4) R (version 3.6). Data were filtered based on the number of genes detected per cell (cells with fewer than 200 genes per cell were filtered). A global-scaling normalization method
for the gene–cell–barcode matrix of the samples was employed. We normalized the feature expression measurements for each cell by the total expression, multiplied this by a scale factor
(10,000) and log-transformed the result to yield the normalized unique molecular identifier (nUMI) value later reported. Regression in gene expression was performed based on the number of
nUMIs. Principal component analysis (PCA) was run on the normalized gene–barcode matrix. Barnes–Hut approximation to UMAP was then performed on principal components to visualize cells in a
two-dimensional space. This graph-based clustering method relies on a clustering algorithm based on shared nearest neighbor (SNN) modularity optimization. Differential transcriptional
profiles by cluster were generated in Seurat with associated GO terms derived from the functional annotation tools DAVID Bioinformatics Resources 6.7 (NIAID/NIH,
https://david.ncifcrf.gov/summary.jsp) and Metascape (http://metascape.org). For THP-1 analyses, first _DNMT3A_ knockdown efficiency was assessed to detect siRNA responsive and
non-responsive cells. Within the siRNA treatment, there were three ranges of data based on _DNMT3A_ expression (no expression, low expression and high expression). As 10x Genomics data have
gene dropout issues, we considered for analysis only cells with detectable _DNMT3A_ and stratified these by high and low _DNMT3A_ expression, which is termed responsive and non-responsive.
Ligand–receptor interaction was performed per standard pipelines using the CellChatDB tool. SCENIC was used to assess transcription factor regulation implicated in _DNMT3A-_mutated cells.
Cell annotation was then performed by assessing relative expression of immune markers as described in the Results section. To perform differential abundance testing between mutated and
unmutated cells for each cell type, we applied MILO45 according to their vignettes. In brief, the Seurat object was transformed to a SingleCellObject by as.SingleCellExperiment(), followed
by a PCA with RunPCA() and an UMAP reduction via RunUMAP(). The resulting object was then imported to MILO, and a _k_-nearest neighbor (KNN) graph was generated via buildGraph() with the
parameters _k_ = 10 and _d_ = 30. Afterwards, representative neighborhoods were defined with makeNhoods() with the parameters _prop_ = 0.1, _k_ = 10 and _d_ = 30. Based on the cell type and
mutation information, the cells for each KNN neigborhood were counted by countCells(). Finally, differential abundance testing was performed by calcNhoodDistance() and testNhood(). VARIANT
CALLING AND ANNOTATION STRATEGIES FOR TARGETED DNA SEQUENCING Read quality was assessed using FastQC. FASTQ files from each patient were merged, and reads were grouped into UMI families
using the UMI-tools software package (version 1.1.2). Reads were mapped to the hg19 draft of the human genome using Burrows–Wheeler Alignment–MEM. The ‘dedup‘ command of the UMI-tools
software package was used to remove PCR duplicates with the same UMIs and alignment coordinates. Variant calling was performed using FreeBayes without allele frequency threshold, a minimum
alternate read count of 2 and a minimum base and mapping quality of 20. Variant effect prediction and variant annotation were performed using SnpEff and SnpSift. The identified variants were
processed and filtered using the R programming language, version 3.3.1. Common SNPs with a minor allele frequency of at least 5% in the 1000 Genomes Project, Exome Variant Server or ExAC
databases were excluded. In addition, variants with allow mapping quality (<20) and variants occurring in 8% or more of the patients in the studied cohort were considered as technical
artifacts and excluded. Furthermore, variants covered with fewer than 100 reads in at least one set of amplicons (CAT A or CAT B), variants called with only one of the set of amplicons (CAT
A or CAT B), SNPs identified as common in the SNP database (≥1% in the human population) and variants with sequence ontology terms ‘LOW’ or ‘MODIFIER’ were filtered out. According to
previously established definitions, all variants with a VAF of at least 0.01 (1%) were considered; VAF was calculated by using the formula VAF = alternate reads / (reference + alternate
reads). Variants with a VAF of 0.45–0.55 were not considered, to exclude potential germline variants. The variants were further validated on the basis of being reported in the literature
and/or the Catalogue of Somatic Mutations in Cancer (https://cancer.sanger.ac.uk/cosmic) and ClinVar (https://www.ncbi.nlm.nih.gov/clinvar). Four patients had a mutation in the MTPase
region; one patient had a deletion in the MTPase region; and one patient exhibited a frame shift (amino acid 449). CELL CULTURE AND SIRNA TRANSFECTION THP1 cells were purchased from the
German Collection of Microorganisms and Cell Cultures (ACC16), and the NK cell line NKL was a kind gift from Winfried Wells (Georg-Speyer-Haus). Human cardiomyocyte ventricular (HCM-VT)
primary cells were obtained from Celprogen (36044-15VT), and primary HCFs (C-12375) were from PromoCell. HUVECs were purchased from Lonza (C2519A). Human primary immune cells were isolated
from PBMCs derived from buffy coats of healthy donors. Immune cell lines and primary cells were cultured in RPMI 1640 media (11875093, Thermo Fisher Scientific) with 10% heat-inactivated FBS
(10082147, Thermo Fisher Scientific), 1% penicillin–streptomycin (15140122, Thermo Fisher Scientific), 1% glutamin (35050061, Thermo Fisher Scientific) (basic RPMI) and cell-type-specific
additives at 37 °C and 5% CO2. THP1 cells, NKL cells and primary cells isolated from peripheral blood were cultured in basic RPMI supplemented with 10 mM HEPES (H0887, Sigma-Aldrich), with
200 U ml−1 IL-2 (200-02, PeproTech) and with 1% sodium pyruvate (S8636, Sigma-Aldrich) and 50 µM β-mercaptoethanol (M3148, Sigma-Aldrich), respectively. HCM-VT cells were kept in Human
Cardiomyocyte Complete Media with Serum (M36044-15S, PromoCell), and HCFs were maintained in Fibroblast Growth Medium 3 (C-23130, PromoCell) according to the manufacturer’s protocol. HUVECs
were cultured in endothelial basal medium (CC31221) supplemented with EGM BulletKit components (CC-3124) containing hydrocortisone (1 μg ml−1), bovine brain extract (12 μg ml−1), gentamicin
(50 μg ml−1), amphotericin B (50 ng ml−1), epidermal growth factor (10 ng ml−1) and FBS (2%). Silencing of target genes was performed with siRNA and siTrans2.0 transfection reagent (T320001,
OriGene) according to the manufacturer’s protocol. _DNMT3A_ was silenced using stealth siRNA (1299001, HSS176225) and a corresponding negative control of median GC content (12935300,
Invitrogen). PREPARATION OF PBMCS PBMCs were isolated from buffy coats of healthy donors, obtained from Blutspendedienst Frankfurt, by density gradient centrifugation. In brief,
PBMC-enriched blood was diluted 1:3 with pre-warmed PBS supplemented with 0.5% BSA (A1595, Sigma-Aldrich) and 2 mM EDTA (E8008, Sigma-Aldrich) and layered on top of human Pancoll (1.077 g
ml−1, P04-60500, PAN Biotech), followed by centrifugation at 400_g_ for 25 min with disabled break. The PBMC layer was collected, washed and centrifuged at 300_g_ for 10 min. Platelets were
removed by two additional washing steps and centrifugation at 200_g_ for 10 min. Cell types of interest were enriched by magnetic-activated cell sorting (MACS, Miltenyi Biotec). Monocytes
and naive CD4+ T cells were isolated using the human Pan Monocyte Isolation Kit (130-096-537) and the Naive CD4+ T Cell Isolation Kit II (130-094-131), respectively (all from Miltenyi
Biotec), following the manufacturer’s guidelines. The enrichment of desired cell types was confirmed by flow cytometry. MONOCYTE-DERIVED MACROPHAGES Monocytes freshly isolated from PBMCs
were seeded in six-well plates (1.5 × 10⁶ cells per well) and allowed to adhere in non-supplemented RPMI 1640 media for 2 h. Macrophage differentiation was induced in complete media with 20
ng ml−1 GM-CSF (300-03, PeproTech), culturing cells in the presence of GM-CSF for 6 d with a media exchange after 3 d. After the differentiation was completed, macrophages were transfected
with 100 nM siRNA, refreshing the media after 6 h. THP1 monocytes were differentiated into THP1-derived macrophages with 100 ng ml−1 phorbol 12-myristate 13-acetate (PMA) (P8139,
Sigma-Aldrich) for 48 h, followed by 24 h of culture in media without PMA. THP1 macrophages were transfected with 50 nM siRNA, and the media were refreshed 16 h after transfection. For
indirect co-culture experiments, the supernatant of siRNA-transfected macrophages was collected after 48 h, diluted 1:2 and applied on primary wild-type macrophages for 24 h. Wild-type THP1
macrophages were indirectly co-cultured with siRNA-transfected THP1 macrophages for 72 h. The supernatants of stimulated wild-type macrophages were diluted 1:2 with cardiomyocyte media and
applied on HCM-VT cells for 48 h. DIFFERENTIATION OF NAIVE CD4+ T HELPER CELLS After MACS isolation, naive CD4+ T cells were seeded in 48-well plates (2 × 10⁵ cells per well) and rested for
3 h before transfection with 100 nM siRNA. The media were refreshed 16 h after transfection, followed by T cell activation and differentiation into T helper cell subsets. Naive T cells were
activated in the presence of 5 ng ml−1 IL-2 (200-02, PeproTech) and CD3 and CD28 agonists (T Cell TransAct, 130-111-160, Miltenyi Biotec) to generate Th0 cells. Th1, Th2 and Th17 cells were
induced with 20 ng ml−1 IL-12 (200-12), 20 ng ml−1 IL-4 (200-04) and 5 ng ml−1 TGF-β (100-21C), plus 50 ng ml−1 IL-6 (200-06), respectively (all cytokines from PeproTech). In addition,
polarizing cytokines were replaced by supernatant from siRNA-transfected human primary macrophages used in 1:5 dilution for CD4+ T cell differentiation. Cells were differentiated for 6 d
with a media exchange after 3 d. Supernatants of CD4+ T cells indirectly co-cultured with human macrophages were collected from day 3 to day 6 of differentiation, diluted 1:2 with HCF media
and used to stimulate HCFs for 48 h. RNA EXTRACTION AND QPCR For qPCR analysis, intron-spanning primers were designed using the Primer BLAST tool. Primers were confirmed to amplify a
specific product meeting qPCR efficiency of 100 ± 15%. All qPCR primers are listed in Supplementary Table 1. SYBR Green-based assays were performed in a 10-µl reaction consisting of 5 µl of
Fast SYBR Green Master Mix 2× (Applied Biosystems, 4385617, Thermo Fisher Scientific), 2 µl of nuclease-free water, 0.25 µl of each 10 mM forward and reverse primer and 10 ng of cDNA
template in 2.5 µl. Assays were carried out in 384-well plates in technical triplicates and run on a ViiA 7 instrument with Quant Studio Real-Time PCR Software (both Applied Biosystems). The
thermal profile consisted of 95 °C for 20 s, followed by 40 cycles of 95 °C for 1 s and 60 °C for 20 s and a final melt curve stage (95 °C for 15 s, 60 °C for 1 min and 95 °C for 15 s).
Data were analyzed using the ΔΔCt method and RPLP0 as reference gene. Data are represented as relative mRNA level (2−ΔΔCt) normalized to the expression level in the respective control.
IMMUNOFLUORESCENCE HCFs were seeded at a density of 5,000 cells per cm2 in eight-well µ-Slides (80826, ibidi) coated with human fibronectin (F0895, Sigma-Aldrich), and HCM-VT cells were
seeded at a density of 200 cells per cm2 in eight-well µ-Slides for immunofluorescence stainings. After the respective treatment, cells were washed two times with DBPS and fixed with 4%
paraformaldehyde (PFA) (28908, Thermo Fisher Scientific) for 10 min at room temperature. After two washing steps, each for 5 min, with DPBS, cells were permeabilized with 0.1% Triton X-100
(T8787, Thermo Fisher Scientific) in DPBS for 15 min. Cells were blocked with 5% donkey serum (ab7475, Abcam) in DPBS for 60 min at room temperature. Primary antibodies were incubated in the
same blocking solution overnight at 4 °C. Cells were stained with phalloidin (1:100, O7466, Thermo Fisher Scientific), mouse anti-α-smooth muscle actin-Cy3 (1:200, C6198, Sigma-Aldrich) and
rabbit anti-collagen type I (1:200, 72026, Cell Signaling Technology). Cells were washed four times with DPBS, each 5 min, and secondary antibodies in DPBS were incubated for 1 h at room
temperature. The following dyes and secondary antibodies were used: DAPI (1:1,000, D9542, Merck) and donkey anti-rabbit-647 (1:200, A31573, Thermo Fisher Scientific). Cells were mounted with
Fluoromount-G (00-4958-0, Invitrogen). Images were taken using a Leica STELLARIS confocal microscope and analyzed with Leica Application Suite X (2.0.1.14392). Distance between _z_
acquisitions was defined to the half of the optical section of the objective used. Cardiomyocyte area was detected by the immunofluorescence signal for phalloidin and determined as the sum
of areas acquired within the _z_-stack for each cell. Quantification was done using Volocity software version 6.5 (Quorum Technologies). FLOW CYTOMETRY Multicolor flow cytometry was
performed to analyze surface markers in combination with intracellular transcription factors and secreted cytokines. The panels consisting of fluorochrome-conjugated antibodies in
Supplementary Table 2 were applied. Potential spectral overlap in the emission of fluorochromes was compensated in advance with bulk PBMCs using unstained, single-stained,
fluorescence-minus-one and complete stained controls. For intracellular detection of secreted cytokines, differentiated CD4+ T cells were re-stimulated with 50 ng ml−1 PMA (P8139,
Sigma-Aldrich) and 1 µg ml−1 ionomycin (I0634, Sigma-Aldrich) in the presence of 5 µg ml−1 Brefeldin A (420601, BioLegend) for 4 h. NK cells were treated with Brefeldin A for 4 h before
intracellular cytokine staining. Then, cells were processed for flow cytometry analysis as follows. After washing with 2 ml of staining buffer (420201, BioLegend) and centrifugation at
400_g_ for 5 min, cell surface antigens were stained in 100 µl of staining buffer. Afterwards, cells were washed with 2 ml of staining buffer, centrifuged at 400_g_ for 5 min and fixed with
an equal volume of IC Fixation Buffer (eBioscience, 00-8222-49, Thermo Fisher Scientific) for 20 min. After washing the cells with 2 ml of permeabilization buffer (eBioscience, 00-8333-56,
Thermo Fisher Scientific), intracellular targets were stained in 100 µl of permeabilization buffer for 30 min. A final washing step with 2 ml of staining buffer was carried out before flow
cytometry analysis. Data were acquired with a LSR Fortessa X-20 Cell Analyzer and FACSDiva Software (BD Biosciences); FCS files were analyzed with FlowJo Software (version 10.8.1). CFSE
STAINING To distinguish HUVECs from co-cultured NK cells, HUVECs were fluorescently labeled with CFSE (CellTrace, C34570, Thermo Fisher Scientific) according to the manufacturer’s
instructions. In brief, after staining 1 × 10⁶ cells with 5 µM CFSE in 1 ml of PBS for 20 min at 37 °C, remaining dye in the solution was quenched with five volumes of complete media for 5
min. Then, the cells were pelleted and resuspended in pre-warmed complete media. Cells were analyzed by flow cytometry after staining after a resting period of at least 10 min. Before
co-culture with NK cells, HUVECs were rested overnight. NK CELL CYTOTOXICITY ASSAY To study the cytotoxic capacity of NK cells on HUVECs, the NK cells were co-cultured with CFSE-labeled
HUVEC target cells in a ratio of 1:1 for 4 h. Then, cells were trypsinized, washed with staining buffer and stained with 5 µl of 7-AAD (420404, BioLegend) for 15 min to identify dead cells.
7-AAD+ HUVEC cells were determined by flow cytometry. The percentage of lysed HUVECs was calculated as follows: %CFSE + 7-AAD + HUVEC (co-culture) − %CFSE + 7-AAD + HUVEC (HUVEC only).
REPORTING SUMMARY Further information on research design is available in the Nature Portfolio Reporting Summary linked to this article. DATA AVAILABILITY Sequencing data supporting the
findings of this study have been deposited in the ArrayExpress Data Depository with series accession number E-MTAB-13016. Data supporting the findings of this study are included in the main
article and associated files and/or at the referenced depositories. CODE AVAILABILITY Scripts to reproduce the analysis presented in this study have been deposited on GitHub
(https://github.com/djhn75/Sicelore-scRNA-Integration). REFERENCES * Steensma, D. P. et al. Clonal hematopoiesis of indeterminate potential and its distinction from myelodysplastic
syndromes. _Blood_ 126, 9–16 (2015). Article CAS PubMed PubMed Central Google Scholar * Nam, A. S. et al. Single-cell multi-omics of human clonal hematopoiesis reveals that _DNMT3A_
R882 mutations perturb early progenitor states through selective hypomethylation. _Nat. Genet._ 54, 1514–1526 (2022). Article CAS PubMed PubMed Central Google Scholar * Jaiswal, S. et
al. Age-related clonal hematopoiesis associated with adverse outcomes. _N. Engl. J. Med._ 371, 2488–2498 (2014). Article PubMed PubMed Central Google Scholar * Dorsheimer, L. et al.
Association of mutations contributing to clonal hematopoiesis with prognosis in chronic ischemic heart failure. _JAMA Cardiol._ 4, 25–33 (2019). Article PubMed Google Scholar *
Pascual-Figal, D. A. et al. Clonal hematopoiesis and risk of progression of heart failure with reduced left ventricular ejection fraction. _J. Am. Coll. Cardiol._ 77, 1747–1759 (2021).
Article PubMed Google Scholar * Jaiswal, S. et al. Clonal hematopoiesis and risk of atherosclerotic cardiovascular disease. _N. Engl. J. Med._ 377, 111–121 (2017). Article PubMed PubMed
Central Google Scholar * Sano, S. et al. CRISPR-mediated gene editing to assess the roles of Tet2 and Dnmt3a in clonal hematopoiesis and cardiovascular disease. _Circ. Res._ 123, 335–341
(2018). Article CAS PubMed PubMed Central Google Scholar * Abplanalp, W. T. et al. Clonal hematopoiesis-driver DNMT3A mutations alter immune cells in heart failure. _Circ. Res._ 128,
216–228 (2021). Article CAS PubMed Google Scholar * Abplanalp, W. T. et al. Association of clonal hematopoiesis of indeterminate potential with inflammatory gene expression in patients
with severe degenerative aortic valve stenosis or chronic postischemic heart failure. _JAMA Cardiol._ 5, 1170–1175 (2020). Article PubMed Google Scholar * Lebrigand, K., Magnone, V.,
Barbry, P. & Waldmann, R. High throughput error corrected Nanopore single cell transcriptome sequencing. _Nat. Commun._ 11, 4025 (2020). Article CAS PubMed PubMed Central Google
Scholar * Buscarlet, M. et al. Lineage restriction analyses in CHIP indicate myeloid bias for _TET2_ and multipotent stem cell origin for _DNMT3A_. _Blood_ 132, 277–280 (2018). Article CAS
PubMed Google Scholar * Wang, S. et al. S100A8/A9 in inflammation. _Front. Immunol._ 9, 1298 (2018). Article PubMed PubMed Central Google Scholar * Ma, L.-P. et al. S100A8/A9 complex
as a new biomarker in prediction of mortality in elderly patients with severe heart failure. _Int. J. Cardiol._ 155, 26–32 (2012). Article PubMed Google Scholar * Schiopu, A. &
Cotoi, O. S. S100A8 and S100A9: DAMPs at the crossroads between innate immunity, traditional risk factors, and cardiovascular disease. _Mediators Inflamm._ 2013, 828354 (2013). Article
PubMed PubMed Central Google Scholar * Bajpai, G. et al. The human heart contains distinct macrophage subsets with divergent origins and functions. _Nat. Med._ 24, 1234–1245 (2018).
Article CAS PubMed PubMed Central Google Scholar * Akira, S. et al. A nuclear factor for IL-6 expression (NF-IL6) is a member of a C/EBP family. _EMBO J._ 9, 1897–1906 (1990). Article
CAS PubMed PubMed Central Google Scholar * Scuruchi, M. et al. Serglycin as part of IL-1β induced inflammation in human chondrocytes. _Arch. Biochem. Biophys._ 669, 80–86 (2019). Article
CAS PubMed Google Scholar * Zhang, Z. et al. SRGN-TGFβ2 regulatory loop confers invasion and metastasis in triple-negative breast cancer. _Oncogenesis_ 6, e360 (2017). Article CAS
PubMed PubMed Central Google Scholar * Chang, M. Y. et al. Monocyte-to-macrophage differentiation: synthesis and secretion of a complex extracellular matrix. _J. Biol. Chem._ 287,
14122–14135 (2012). Article CAS PubMed PubMed Central Google Scholar * Kolseth, I. B. M. et al. Serglycin is part of the secretory repertoire of LPS-activated monocytes. _Immun.
Inflamm. Dis._ 3, 23–31 (2015). Article CAS PubMed PubMed Central Google Scholar * Feng, M. et al. Programmed cell removal by calreticulin in tissue homeostasis and cancer. _Nat.
Commun._ 9, 3194 (2018). Article PubMed PubMed Central Google Scholar * Münzel, T. & Harrison, D. G. Increased superoxide in heart failure: a biochemical baroreflex gone awry.
_Circulation_ 100, 216–218 (1999). Article PubMed Google Scholar * Ueno, N., Takeya, R., Miyano, K., Kikuchi, H. & Sumimoto, H. The NADPH oxidase Nox3 constitutively produces
superoxide in a p22_phox_-dependent manner: its regulation by oxidase organizers and activators. _J. Biol. Chem._ 280, 23328–23339 (2005). Article CAS PubMed Google Scholar * Allen, P.
M., Babbitt, B. P. & Unanue, E. R. T-cell recognition of lysozyme: the biochemical basis of presentation. _Immunol Rev_ 98, 171–187 (1987). Article CAS PubMed Google Scholar *
Gartshteyn, Y., Askanase, A. D. & Mor, A. SLAM associated protein signaling in T cells: tilting the balance toward autoimmunity. _Front. Immunol._ 12, 654839 (2021). Article CAS PubMed
PubMed Central Google Scholar * Luster, A. D. Chemokines—chemotactic cytokines that mediate inflammation. _N. Engl. J. Med._ 338, 436–445 (1998). Article CAS PubMed Google Scholar *
LaFleur, M. W. et al. PTPN2 regulates the generation of exhausted CD8+ T cell subpopulations and restrains tumor immunity. _Nat. Immunol._ 20, 1335–1347 (2019). Article CAS PubMed PubMed
Central Google Scholar * Ma, C. & Hoffmann, P. R. Selenoproteins as regulators of T cell proliferation, differentiation, and metabolism. _Semin. Cell Dev. Biol._ 115, 54–61 (2021).
Article CAS PubMed Google Scholar * Cui, J. et al. USP3 inhibits type I interferon signaling by deubiquitinating RIG-I-like receptors. _Cell Res._ 24, 400–416 (2014). Article CAS
PubMed Google Scholar * Zhang, N., Aiyasiding, X., Li, W.-J., Liao, H.-H. & Tang, Q.-Z. Neutrophil degranulation and myocardial infarction. _Cell Commun. Signal._ 20, 50 (2022).
Article CAS PubMed PubMed Central Google Scholar * Assmus, B. et al. Clonal haematopoiesis in chronic ischaemic heart failure: prognostic role of clone size for _DNMT3A_- and
_TET2_-driver gene mutations. _Eur. Heart J._ 42, 257–265 (2021). Article CAS PubMed Google Scholar * Jin, S. et al. Inference and analysis of cell–cell communication using CellChat.
_Nat. Commun._ 12, 1088 (2021). Article CAS PubMed PubMed Central Google Scholar * Krispin, A. et al. Apoptotic cell thrombospondin-1 and heparin-binding domain lead to dendritic-cell
phagocytic and tolerizing states. _Blood_ 108, 3580–3589 (2006). Article CAS PubMed Google Scholar * Travelli, C., Colombo, G., Mola, S., Genazzani, A. A. & Porta, C. NAMPT: a
pleiotropic modulator of monocytes and macrophages. _Pharmacol. Res._ 135, 25–36 (2018). Article CAS PubMed Google Scholar * Silswal, N. et al. Human resistin stimulates the
pro-inflammatory cytokines TNF-α and IL-12 in macrophages by NF-κB-dependent pathway. _Biochem. Biophys. Res. Commun._ 334, 1092–1101 (2005). Article CAS PubMed Google Scholar *
Henderson, N. C., Rieder, F. & Wynn, T. A. Fibrosis: from mechanisms to medicines. _Nature_ 587, 555–566 (2020). Article CAS PubMed PubMed Central Google Scholar * Baldeviano, G. C.
et al. Interleukin-17A is dispensable for myocarditis but essential for the progression to dilated cardiomyopathy. _Circ. Res._ 106, 1646–1655 (2010). Article CAS PubMed Google Scholar
* Liu, Y. et al. IL-17 contributes to cardiac fibrosis following experimental autoimmune myocarditis by a PKCβ/Erk1/2/NF-κB-dependent signaling pathway. _Int. Immunol._ 24, 605–612 (2012).
Article CAS PubMed Google Scholar * Martini, E. et al. T cell costimulation blockade blunts age-related heart failure. _Circ. Res._ 127, 1115–1117 (2020). Article CAS PubMed PubMed
Central Google Scholar * Kallikourdis, M. et al. T cell costimulation blockade blunts pressure overload-induced heart failure. _Nat. Commun._ 8, 14680 (2017). Article PubMed PubMed
Central Google Scholar * Knorr, M., Münzel, T. & Wenzel, P. Interplay of NK cells and monocytes in vascular inflammation and myocardial infarction. _Front. Physiol._ 5, 295 (2014).
Article PubMed PubMed Central Google Scholar * Kossmann, S. et al. Angiotensin II-induced vascular dysfunction depends on interferon-γ-driven immune cell recruitment and mutual
activation of monocytes and NK-cells. _Arterioscler. Thromb. Vasc. Biol._ 33, 1313–1319 (2013). Article CAS PubMed Google Scholar * Ashcroft, G. S. Bidirectional regulation of macrophage
function by TGF-β. _Microbes Infect._ 1, 1275–1282 (1999). Article CAS PubMed Google Scholar * Cremer, S. et al. Multiple somatic mutations for clonal hematopoiesis are associated with
increased mortality in patients with chronic heart failure. _Circ. Genom. Precis. Med._ 13, e003003 (2020). Article PubMed Google Scholar * Dann, E., Henderson, N. C., Teichmann, S. A.,
Morgan, M. D. & Marioni, J. C. Differential abundance testing on single-cell data using _k_-nearest neighbor graphs. _Nat. Biotechnol._ 40, 245–253 (2022). Article CAS PubMed Google
Scholar Download references ACKNOWLEDGEMENTS This work was funded, in part, by Dr. Rolf M. Schwiete Stiftung (S.D.), Project 08/2018, cluster project ENABLE funded by the Hessian Ministry
for Science and the Art (S.D. and W.T.A.), the German Center for Cardiovascular Research (A.M.Z. and W.T.A.), the German Research Foundation, Exc2026 and CRC1531 project number 456687919
(W.T.A.) and ERC-2021-ADG: GAP – 101054899 (CHIP-AVS) (A.M.Z.). The authors thank K. Häfner for technical assistance and I. Kühnel and W. Wels for providing cell lines. Figures 1a, 4b,f and
6a,c,f were created with BioRender. AUTHOR INFORMATION Author notes * These authors contributed equally: Wesley T. Abplanalp, Bianca Schuhmacher. * These authors jointly supervised this
work: David John, Stefanie Dimmeler. AUTHORS AND AFFILIATIONS * Institute of Cardiovascular Regeneration, Goethe University, Frankfurt, Germany Wesley T. Abplanalp, Bianca Schuhmacher,
Sebastian Cremer, Maximilian Merten, Mariana Shumliakivska, Igor Macinkovic, Andreas M. Zeiher, David John & Stefanie Dimmeler * German Center for Cardiovascular Research DZHK, Partner
Site Frankfurt Rhine-Main, Berlin, Germany Wesley T. Abplanalp, Sebastian Cremer, Maximilian Merten, Mariana Shumliakivska, Andreas M. Zeiher, David John & Stefanie Dimmeler *
Cardiopulmonary Institute, Goethe University, Frankfurt, Germany Wesley T. Abplanalp, Bianca Schuhmacher, Sebastian Cremer, Maximilian Merten, Mariana Shumliakivska, Andreas M. Zeiher, David
John & Stefanie Dimmeler Authors * Wesley T. Abplanalp View author publications You can also search for this author inPubMed Google Scholar * Bianca Schuhmacher View author publications
You can also search for this author inPubMed Google Scholar * Sebastian Cremer View author publications You can also search for this author inPubMed Google Scholar * Maximilian Merten View
author publications You can also search for this author inPubMed Google Scholar * Mariana Shumliakivska View author publications You can also search for this author inPubMed Google Scholar *
Igor Macinkovic View author publications You can also search for this author inPubMed Google Scholar * Andreas M. Zeiher View author publications You can also search for this author
inPubMed Google Scholar * David John View author publications You can also search for this author inPubMed Google Scholar * Stefanie Dimmeler View author publications You can also search for
this author inPubMed Google Scholar CONTRIBUTIONS All authors provided insight for study design. S.C. and A.M.Z. recruited and enrolled patients with heart failure for the study. W.T.A.
designed the sequencing approach. W.T.A., B.S. and I.M. performed sequencing experiments. B.S., M.M. and M.S. performed in vitro experiments. W.T.A., B.S., M.M., M.S. and D.J. analyzed the
data. W.T.A., B.S., S.C., M.M., M.S., I.M., A.M.Z., D.J. and S.D. interpreted data. W.T.A., A.M.Z. and S.D. funded the project. W.T.A., B.S., A.M.Z., D.J. and S.D. wrote the manuscript. All
authors provided feedback and comments. W.T.A. and B.S. contributed equally to this work, and D.J. and S.D. jointly supervised the study. CORRESPONDING AUTHOR Correspondence to Stefanie
Dimmeler. ETHICS DECLARATIONS COMPETING INTERESTS A.M.Z. is an unpaid consultant for TenSixteen Bio. All remaining authors declare no competing interests. PEER REVIEW PEER REVIEW INFORMATION
_Nature Cardiovascular Research_ thanks Dominique Bonnet and the other, anonymous, reviewer(s) for their contribution to the peer review of this work. ADDITIONAL INFORMATION PUBLISHER’S
NOTE Springer Nature remains neutral with regard to jurisdictional claims in published maps and institutional affiliations. EXTENDED DATA EXTENDED DATA FIG. 1 SCHEMATIC OVERVIEW OF
EXPERIMENTAL PROCEDURES FOR SINGLE CELL TARGETED LONG-READ SEQUENCING AND QUALITY CONTROL RESULTS. A. Detailed workflow of 10X Genomics Single Cell 3‘ gene expression protocol combined with
targeted enrichment of full-length transcripts by hybridization and capture and Nanopore long-read sequencing. B. Enrichment of targeted transcripts by single and double capture approach (n
= 6 patients except for _TRAC_ n = 4) relative to cDNA input. The double capture improves the enrichment of targets by a factor of 10 (from 103- to 104-fold) compared to the single capture
and more efficiently depletes non-target transcripts. Initial test experiment of single capture (n = 1 patient) is shown. C. Representative Agilent Bioanalyzer traces of cDNA libraries
before and after targeted enrichment. The amplified full-length cDNA and the post-capture targeted cDNA library were analyzed on an Agilent High Sensitivity DNA Chip. The gel (left) and cDNA
profiles (right) suggest the presence of an enriched fraction after two rounds of hybridization and capture compared to the input cDNA library. Panel B: error bars ± SD shown. EXTENDED DATA
FIG. 2 ALIGNMENT OF LONG-READS TO CHIP GENE AND MUTATION LOCATIONS. A. Map of exons and introns for the _DNMT3A_ gene (upper panel). Distribution of reads from long read sequencing along
the _DNMT3A_ gene with non-synonymous mutation location indicated by red vertical line (lower panel). B. Validation of detection of somatic mutations in _TET2_ for a known carrier by
MutDetect-seq. EXTENDED DATA FIG. 3 PROPORTION OF CELLS CAPTURED IN SCRNA-SEQ AND REGULATED GENES. A. Proportion of reads mapped to target genes in long read sequencing. B. Expression of
cell type specific markers shown in Featureplots. C. Relative abundance of cells with coverage at patient-respective DNMT3A-mutation sites. D. Enrichment plot of mutated cells compared to
wild type cell with distribution by class (each dot represents an individual sample, with the fill pattern of the dot representing a specific sample across the different cell types). E.
Neighborhood distribution analysis by Milo. The Nodes represent the detected neighborhoods by MILO, which are colored by their log fold change between mutated and WT samples.
Non-differential abundance neighborhoods (FDR 10%) are colored white, and sizes correspond to the number of cells in a neighborhood. Number of cells shared between adjacent neighborhoods are
shown by the graph edges. The node position is set by the position of the neighborhood defining cells in the UMAP representation (left). F/G. Number of upregulated genes in DNMT3A mutant
cells versus wild type cells by immune cell class (F) using all cells and (G) when down-sampling to the number of NK cells (that is 1599 cells per cell type). (Panels a-g: n = 5 for relative
mutation analysis and pooled differential gene expression analysis. Panel d: data show means of each processed library ± SEM). EXTENDED DATA FIG. 4 SECONDARY MONOCYTE CLASS CONFIRMATION
MARKERS FOR ANNOTATION. A-C. Violin plots of common monocyte subclass maker genes for (A) classical monocytes, (B) intermediate monocytes and (C) non-classical monocytes confirming monocyte
annotation. D. Heatmap of unbiased monocyte subclass maker regulated genes. E. Number of upregulated genes in DNMT3A mutant cells versus wild type cells in different monocyte classes in
pooled analysis. F. Novel DNMT3A-mutant associated gene regulation differentially are called from parent GO term associated with immune processes and inflammation. (CM: classical monocytes;
IM: intermediate monocytes; NCM: non-classical monocytes). (Significance denoted by * and reflects adj. p-value < 0.05). EXTENDED DATA FIG. 5 REGULATED GENES IN DNMT3A MUTANT MONOCYTES
AND _DNMT3A_-SILENCED THP1 MACROPHAGES. A. Violin plots of significantly upregulated genes in mutant vs. wild type cells in monocytes of patients. B. Violin plots of significantly
upregulated genes in responsive _DNMT3A_ silenced THP1 cells. C. Violin plots of significantly downregulated genes in mutant vs. wild type cells in monocytes of patients. (Panels A/C: n = 5
for pooled analysis. Panels B: n = 644 siDNMT3A non-reponsive cells, n = 387 siDNMT3A responsive cells. (Significance denoted by * and reflects adj. p-value < 0.05). EXTENDED DATA FIG. 6
NAIVE CD4 + T CELL ISOLATION AND T CELL GATING STRATEGIES. A. Enrichment of naive CD4 + T (lower panel) cells from PBMCs (upper panel). Naive CD4+ T cells express CD45RA and CCR7. B.
Identification of T helper cell markers in CD4 + CD25+ T cells differentiated from naive CD4+ T cells. Arrows indicate sequential gates. EXTENDED DATA FIG. 7 NK CELL GATING STRATEGIES. A.
Detection of CD56, TNFA and IFNG in NKL cells. B. NK cell cytotoxicity assay. CFSE-stained HUVEC lysed by NK cells are identified as CFSE + 7-ADD+ cells. Arrows indicate sequential gates.
EXTENDED DATA FIG. 8 CHANGES IN SIGNALING BY DNMT3A MUTATION PRESENCE. A. Interaction strength between wild type and _DNMT3A_ mutant monocytes. Overall interaction strength is shown B.
Differentially regulated pathways for _DNMT3A_ mutant vs. WT cells. C. _DNMT3A_ expresssion after _DNMT3A_ silencing in human macrophages (n = 11 biologically independent samples, 4 donors),
P = 1,63 × 10⁻¹⁰ (left) and in THP1-derived macrophages (n = 3 independent experiments), P = 9,59 × 10⁻⁶ (right). Means ± SEM is shown. Statistical significance was determined by two-tailed
unpaired t-test. (**** _P_ < 0.0001). Source data SUPPLEMENTARY INFORMATION SUPPLEMENTARY TABLES 1 AND 2 REPORTING SUMMARY SOURCE DATA SOURCE DATA FIG. 4 Statistical Source Data SOURCE
DATA FIG. 6 Statistical Source Data SOURCE DATA EXTENDED DATA FIG./TABLE 8 Statistical Source Data RIGHTS AND PERMISSIONS Springer Nature or its licensor (e.g. a society or other partner)
holds exclusive rights to this article under a publishing agreement with the author(s) or other rightsholder(s); author self-archiving of the accepted manuscript version of this article is
solely governed by the terms of such publishing agreement and applicable law. OPEN ACCESS This article is licensed under a Creative Commons Attribution 4.0 International License, which
permits use, sharing, adaptation, distribution and reproduction in any medium or format, as long as you give appropriate credit to the original author(s) and the source, provide a link to
the Creative Commons license, and indicate if changes were made. The images or other third party material in this article are included in the article’s Creative Commons license, unless
indicated otherwise in a credit line to the material. If material is not included in the article’s Creative Commons license and your intended use is not permitted by statutory regulation or
exceeds the permitted use, you will need to obtain permission directly from the copyright holder. To view a copy of this license, visit http://creativecommons.org/licenses/by/4.0/. Reprints
and permissions ABOUT THIS ARTICLE CITE THIS ARTICLE Abplanalp, W.T., Schuhmacher, B., Cremer, S. _et al._ Cell-intrinsic effects of clonal hematopoiesis in heart failure. _Nat Cardiovasc
Res_ 2, 819–834 (2023). https://doi.org/10.1038/s44161-023-00322-x Download citation * Received: 13 January 2023 * Accepted: 24 July 2023 * Published: 04 September 2023 * Issue Date:
September 2023 * DOI: https://doi.org/10.1038/s44161-023-00322-x SHARE THIS ARTICLE Anyone you share the following link with will be able to read this content: Get shareable link Sorry, a
shareable link is not currently available for this article. Copy to clipboard Provided by the Springer Nature SharedIt content-sharing initiative


:max_bytes(150000):strip_icc():focal(319x0:321x2)/people_social_image-60e0c8af9eb14624a5b55f2c29dbe25b.png)