- Select a language for the TTS:
- UK English Female
- UK English Male
- US English Female
- US English Male
- Australian Female
- Australian Male
- Language selected: (auto detect) - EN
Play all audios:
ABSTRACT Sediment microbial communities drive the biogeochemical cycles that make rivers globally important sources and sinks of carbon (C) and nitrogen (N). The structure of these
communities is strongly determined by the local physico-chemical environment. However, we currently lack an understanding of the factors that determine microbial community structures at the
catchment scale. Here, we show that the contribution of groundwater to total river flow (quantified as base flow index; BFI) predicts the structure and diversity of the different microbial
functional groups that cycle N and C across nine UK rivers, spanning a geological BFI gradient from 0.23 (clay sediment) to 0.95 (chalk gravel sediment). Furthermore, the GC-content
(percentage of guanine-cytosine bases in a DNA sequence) and codon-usage bias of ammonia monooxygenase DNA sequences, and the hydrophobicity and net-charge of the corresponding amino acid
sequences, were all strongly correlated with BFI, likely reflecting physiological adaptations to different riverbed sediment structure along the BFI gradient. Our results offer an
opportunity to overcome the “paradox of scales” that has seen microbial ecologists focus on small- rather than large-scale environmental variables, enabling us to scale-up our understanding
of microbial biogeochemistry to the catchment and beyond. SIMILAR CONTENT BEING VIEWED BY OTHERS UNRAVELLING LARGE-SCALE PATTERNS AND DRIVERS OF BIODIVERSITY IN DRY RIVERS Article Open
access 22 August 2024 HYDRODYNAMIC DISTURBANCE CONTROLS MICROBIAL COMMUNITY ASSEMBLY AND BIOGEOCHEMICAL PROCESSES IN COASTAL SEDIMENTS Article Open access 28 September 2021 LOCAL EUKARYOTIC
AND BACTERIAL STREAM COMMUNITY ASSEMBLY IS SHAPED BY REGIONAL LAND USE EFFECTS Article Open access 26 June 2023 INTRODUCTION Rivers play a crucial role in the biogeochemical cycles of key
macronutrients such as nitrogen (N) and carbon (C). Not only do rivers transport 0.4 Pg of C [1] and 61.5 Tg of N [2] per year to the sea, but they are increasingly recognised as key players
in global biogeochemical cycles. Less than half of the C pool transported by rivers reaches the coast [3] whilst around 40% of terrestrial N-runoff is converted to inert atmospheric N2 gas
within rivers [4], highlighting the ability of rivers to attenuate and transform macronutrients. Within rivers, sediment microbial communities are the major drivers of C- and N-cycles, and
thus control the abundance and forms of these nutrients. Consequently, understanding the environmental and ecological drivers of these functionally important microbial communities has
remained a key priority in advancing our knowledge of riverine biogeochemistry [5,6,7,8,9]. To date, most microbiological research in rivers and other ecosystems has focussed on the
small-scale physico-chemical environment. Consequently, extrapolating ecological patterns to understand microbial biogeochemistry at spatial scales beyond single rivers has remained
challenging. The ability of landscape-scale geodiversity variables—the diversity of geology, landforms and abiotic processes [10]—to explain microbial community dynamics offers a viable, but
understudied, route to scale-up microbial ecological research [11]. Along the river continuum, from headwaters to estuaries, shifts in hydraulic conditions alter microbial functional
profiles [12, 13], but the landscape-scale variables that explain differences in community composition between similar order streams and rivers remain elusive. Base flow is the contribution
of flow to a river from delayed groundwater pathways. The base flow index (BFI) of a river is the ratio of flow from base flow to total river flow and ranges from 0 (no contribution of
delayed groundwater flow) to 1 (river totally fed from delayed groundwater) [14] and, as such, reflects the permeability of the catchment. Catchment permeability is largely determined by
underlying geology, but also depends on surrounding land use and soil type [15,16,17]. Similar factors can also influence the riverbed physicochemistry at local scales. Our previous work in
the Hampshire Avon catchment (UK) has shown BFI to be highly correlated with various physico-chemical variables including pore-water oxygen concentration, sediment particle size, dissolved
organic C, and pH [8, 17, 18]. BFI therefore integrates up-stream catchment permeability and thus offers a potential path to upscale our understanding of the microbial communities driving
fluvial biogeochemistry. Here, we test the ability of BFI to predict the diversity, composition, and abundance of six C- and N-cycling microbial functional groups across a BFI gradient,
spanning impermeable clay sediments (BFI 0.234–0.635), moderately permeable greensand sediments (BFI 0.695–0.868) and highly permeable chalk sediments (BFI 0.838–0.953). We demonstrate that
the BFI alone explains up to 35% of the variation in community diversity, and 58% of the variation in community composition. Furthermore, we show that the predictive power of BFI extends
beyond broad community-level properties to various enzymatic characteristics of biogeochemically significant functional genes, highlighting BFI as a potential route to studying fluvial
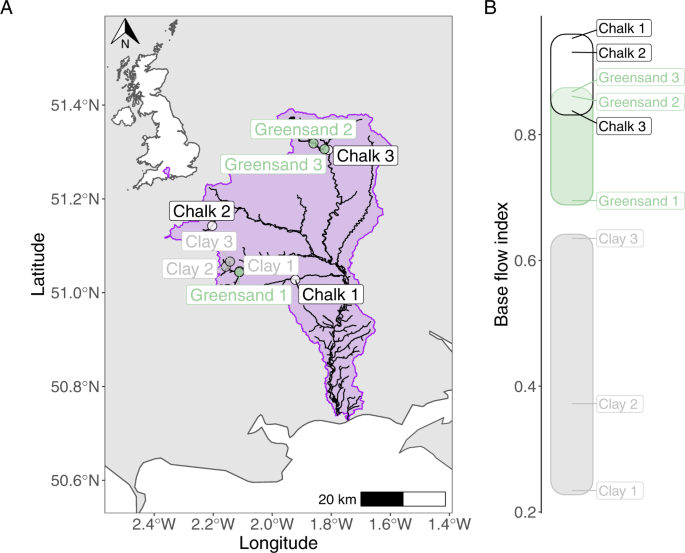
biogeochemistry at the catchment-scale. METHODS FIELD SAMPLING Sampling was conducted during February (winter), April (spring), August (summer) and November (autumn) in 2013 at nine river
sites within the Hampshire Avon catchment (southern England), as described in [8]. Three sites were selected from each of three geologically contrasting sub-catchments (clay, Greensand and
Chalk, Fig. 1) that differ in permeability, thus maximising the range of base flow conditions observed. The BFI for each site was calculated previously from a 2-year discharge dataset [17],
using the hydrograph separation procedure [14]. At each site, three replicate sediment cores (9 cm diameter) were taken from the middle of the river channel, representing 0–5 cm depth,
avoiding areas with substantial macrophyte growth, as described by [8]. A smaller single sediment subsample was taken from each core, homogenised and cryogenically preserved in a vapour
shipper, before being stored at −20 °C prior to molecular analyses. Our total dataset therefore consisted of 108 samples (4 seasons × 9 sites × 3 replicate sediment samples = 108 samples).
Pore water chemistry was measured as described previously [8]. MOLECULAR ANALYSES DNA was extracted from 0.25 g of frozen sediment using a PowerSoil DNA isolation kit (MO BIO Laboratories),
following the manufacturer’s protocol. N (_amoA, nirS, hzo_) and C (_mcrA_) cycle functional gene abundances and bacterial 16S rRNA gene abundances were quantified by qPCR using a SensiFAST
SYBR No-ROX kit (Bioline) on a CFX96 Touch Real-Time PCR Detection system (BioRad), using gene-specific primer sets (Table S1). Briefly, gene abundances were quantified against an internal
standard calibration curve using DNA standards of each target gene from 102 to 107 copies in 20 μl reactions, containing 200 nM of primers and 1 μl of DNA template. Cycle conditions for all
genes were 95 °C for 3 mins followed by 40 cycles at 95 °C for 10 s then 60 °C for 30 s. Specificity of qPCR assays were confirmed via melt curve analysis. All qPCR amplifications were
performed in triplicate and averaged (arithmetic mean) prior to downstream statistical analysis. Amplicon sequencing of N (_amoA, nirS, hzo_) and C (_mcrA, pmoA_) cycle genes and of
phylogenetic marker genes (archaeal and bacterial 16S rRNA) was performed for samples collected in February and August (_n_ = 54 samples). All genes were analysed via locus-specific primer
sets to exclude non-specific amplification (e.g. between _pmoA_ and _amoA_ genes). Each primer was flanked by an Illumina-specific overhang sequence that enables multiplexing indices and
MiSeq flow cell binding sequences to be attached downstream (see Table S1 for further details). PCR conditions for ammonia oxidising archaea (AOA) and bacteria (AOB) _amoA_ genes and
anaerobic ammonium oxidising (anammox) bacterial _hzo_ genes followed those described previously [8, 19]. PCR conditions for other genes replicated those in Clark et al. [19] either exactly
(archaeal 16S rRNA, bacterial 16S rRNA), or with modified annealing temperatures (_nirS_ = 57 °C, _mcrA_ = 60 °C, _pmoA_ = 56 °C). Preparation of sequencing libraries broadly followed those
described by Illumina (https://support.illumina.com/downloads/16s_metagenomic_sequencing_library_preparation.html). Amplicons were initially bead-purified using Agencourt AMPure XP beads
(Beckman Coulter Ltd), before a short eight-cycle PCR to attach sample-specific Nextera XT indices (Illumina). Indexed libraries were then bead purified again prior to quantification.
Libraries were quantified using a Quant-iT PicoGreen dsDNA assay kit (Invitrogen) on a NanoDrop 3300 (Thermo Fisher), before being pooled in equimolar ratios. The quality and concentration
of multiplexed libraries were verified using a DNA 1000 kit on an Agilent 2100 Bioanalyzer. Sequencing was conducted on an Illumina MiSeq using a V3 MiSeq Reagent kit (2 × 300 bp; Illumina)
at the Earlham Institute (Norwich, UK). BIOINFORMATIC ANALYSES For all functional genes, we used cutadapt (v 2.4 [20]) to remove primer sequences, using a minimum overlap 2–3 bp shorter than
the primer length, and demultiplex libraries by primer sequence. Sequences were then quality-controlled using fastp (v 0.20.0 [21]) with the following criteria; minimum Phred score 20,
maximum 20% of bases below min phred score, minimum length after trimming of 150 bp, minimum of 30% complexity in sequence, and a sliding window moving from 5′ to 3′. For genes where the
amplicon length was short enough (all genes except archaeal _amoA_), we also used fastp to overlap paired-end sequences, allowing error correction in the overlap region, and specifying a
minimum overlap of 10 bp. Errors were corrected using the BayesHammer algorithm with default settings, implemented in SPAdes (v 3.13.0 [22, 23]). Custom Linux shell scripts were then used to
inspect sequence length distributions and to filter overly long or short sequences that could represent PCR artefacts or poor quality overlaps. The following length (_ɭ_) thresholds were
used to filter sequences, archaeal _amoA; ɭ_ ≥ 280 bp, bacterial _amoA; ɭ_ ≥448 bp, _hzo_; 160 bp ≤ _ɭ_ ≤ 190 bp, _nirS;_ 360 bp ≤ _ɭ_ ≤390 bp, _mcrA; ɭ_ ≥ 415 bp, _pmoA; ɭ_ ≥ 460 bp. Linux
shell shell scripts were then used again to inspect the library size of each sample. Samples were discarded if they had fewer sequences than the following thresholds: archaeal _amoA;_ 1800
sequences, bacterial _amoA;_ 2600 sequences, _hzo_; 17,000 sequences, _nirS;_ 3900 sequences, _mcrA;_ 4900, _pmoA;_ 3000, in order to ensure that remaining samples retained an adequate
number of sequences after normalisation (details of final sample sizes are presented in Table S2). Phylogenetic marker gene (bacterial and archaeal 16S rRNA) libraries were analysed as
described in [19] following protocols detailed in [24]. After filtering small library sizes from the dataset the remaining sequences were pooled. To correct any frameshift errors and remove
any non locus-specific sequences from the functional gene datasets, we used a local installation of the FrameBot tool [25], which aligns and compares functional gene translated protein
sequences to those in a database. For each gene, we assembled a custom database by downloading locus-specific protein sequences from the FunGene database [26] with a Hidden Markov Model
coverage ≥90% and then de-replicated sequences using USEARCH (v 11.0667 [27]). For archaeal AmoA, the resulting database was too large to use with FrameBot (>18,000 sequences), so we
randomly subsampled this database to 2000 sequences. The number of protein sequences in the de-replicated databases for other functional genes were as follows; bacterial AmoA = 306, anammox
HZO = 2883, NirS = 197, McrA = 209, PmoA = 369. FrameBot was run using a minimum amino acid identity of 50% to remove non locus-specific sequences. The resulting sequences were then analysed
at the amino acid level and nucleotide level. Firstly, to examine shifts in the putative functional composition of microbial communities, corrected protein sequences were dereplicated by
sample using USEARCH, and used to create an amino acid variant (AAV) matrix. Here, an AAV represents a cluster of nucleotide sequences (with no fixed similarity threshold) that share an
identical protein sequence, and thus any variation in nucleotide sequences within an AAV is silent. Secondly, a more traditional approach was used to examine shifts in community structure
based on nucleotide sequences. Here, frameshift corrected nucleotide sequences output by FrameBot were clustered into operational taxonomic units (OTUs) at a 97% similarity level, using
VSEARCH (v 2.10.2 [28]). Herein, we focus on the analysis of AAVs, but present results from OTU analyses for comparison in the supplementary materials. STATISTICAL ANALYSES AAV and OTU
tables were imported into R (v 3.6.2, [29]) and any AAVs or OTUs that occurred in only one sample were discarded prior to further analyses. OTU and AAV tables were rarefied independently to
the minimum sample size of each table prior to statistical analyses (Methods and Table S2) in order to normalise variance due to unequal library sizes in an ecologically meaningful manner
[30, 31]. To investigate the role of BFI on the β-diversity of AAV and OTU communities, pairwise community dissimilarity was quantified as Sørensen dissimilarity. To test the relationship
between BFI and community turnover, we parameterised negative exponential functions using a generalised linear modelling (GLM) approach [32]. Goodness of fit was quantified as a pseudo-_R2_,
defined as the reduction in deviance compared to a null model. The statistical significance of these relationships was quantified by a bootstrapping procedure using 1000 permutations. For
each functional group, relationships to BFI were compared between AAV and OTU datasets by bootstrapping coefficients 1000 times. α-diversity was measured as either AAV or OTU richness, and
was modelled as a function of BFI and geology using negative binomial GLMs. Adjusted _D__2_ was calculated to quantify the explained deviance of a model. In addition, the qPCR-based
abundance of AOA, AOB, and anaerobic ammonia-oxidisers as a proportion of the total ammonia-oxidising community (AOA + AOB + anammox), and of other functional groups as a proportion of the
total bacterial community (16S rRNA gene copies) were analysed using β-GLMs. Coefficients are presented on the odds-scale. To test the hypothesis that shifts in AAV composition were related
to differences in protein hydrophobicity selected for by differences in base flow regimes, we calculated the Kyte-Doolittle hydrophobicity index for each AAV, and used this to calculate an
average hydrophobicity index for each sample, weighted by the abundance of each AAV in each community. We then tested for any relationship between the average hydrophobicity and BFI or
geology using linear regression. Similarly, we also calculated the net charge for each protein sequence, using the Lehninger pKa scale and assuming an intracellular pH of 7 for charge
calculations. The following R packages were necessary to conduct our analyses: vegan [33], betapart [34], MASS [35], Peptides [36], datatable [37], and ggplot2 [38]. Our catchment map (Fig.
1) was constructed using data available from the Environment Agency (UK) Catchment Data Explorer portal [39] and manipulated using the sf package in R [40]. All R/Linux shell scripts and
data necessary to recreate our analyses are available in the Figshare repository under the https://doi.org/10.6084/m9.figshare.c.5404437. Raw sequence data are available in the NCBI sequence
read archive under accession number PRJNA723875. RESULTS AND DISCUSSION RELATIONSHIPS BETWEEN MICROBIAL DIVERSITY AND BASE FLOW INDEX The number of reads obtained per sample and total
number of OTUs obtained after rarefaction for each gene dataset are summarised in Table S2. According to taxonomic analyses of our 16S rRNA gene dataset, archaeal communities in our river
sediment samples consisted largely of OTUs assigned to the Woesarchaeota (20.8% of OTUs and 24.7% of reads) and Methanomicrobia (16.9% of OTUs and 31.8% of reads). Of the functional groups
analysed here, ten OTUs were assigned to AOA, _Nitrososphaera_ (_n_ = 8) and _Nitrosopumilus_ (_n_ = 2), that together formed 4.8% of all archaeal 16S rRNA reads. A total of 137 OTUs were
assigned to orders of methanogenic archaea, with 15.3% and 16% of archaeal reads assigned to the orders Methanomicrobiales and Methanosarcinales, respectively, with other methanogen orders
constituting a further 6.7% of reads. Bacterial communities were more diverse and OTUs assigned to taxa within the functional groups analysed here formed a relatively small proportion of our
bacterial 16S rRNA gene dataset. Ammonia oxidising bacteria were represented by only five OTUs (all assigned to _Nitrosospira_) that together constituted 0.02% of the total bacterial
community across our sediments. A further 84 OTUs were assigned to methanotrophic genera, and these OTUs contributed a total of 0.88% of all bacterial 16S rRNA sequences. These were
_Methylobacter_ (30 OTUs, 0.7% of bacterial sequences), _Methylophilus_ (15 OTUs, 0.1% of bacterial sequences), _Methylosoma_ (7 OTUs, 0.004% of bacterial sequences), _Methylomonas_ and
_Methylotenera_ (6 OTUs each, 0.02 and 0.002% of bacterial sequences, respectively), and _Methylosarcina_ (5 OTUs, 0.002% of bacterial sequences), with a further eight genera represented by
a total of 15 OTUs. As reported previously, no OTUs were assigned to known anammox genera, which were likely below the limit of detection in our study [8]. The OTU richness of archaeal
communities (based on 16S rRNA amplicons) was negatively, albeit weakly, related to BFI (coef = 0.52, _z_ = −2.95, adj-D2 = 0.12, _P_ < 0.01), whereas bacterial OTU richness was not
significantly related to BFI (coef = 0.88, _z_ = −1.53, adj-D2 = 0.003, _P_ = 0.13). The richness of both aerobic ammonia-oxidising bacteria and anammox bacteria changed along the BFI
gradient, positively for anammox and negatively for AOB (Fig. 2 and Table S3). Ammonia oxidising archaea (AOA) increased in AAV richness in high BFI rivers, but not at the OTU level (Fig.
2). No relationships were observed between BFI and AAV or OTU richness for nitrite-reducing, methanotrophic, or methanogenic communities (Fig. S1). Temporal shifts in richness between summer
and winter were rarely significant for any of the genes analysed (Fig. S1; Table S3). Communities from rivers with similar BFI were compositionally more similar to each other than those
from contrasting BFI rivers (Fig. 3 and S2). BFI explained the most variance in community composition for ammonia-oxidising archaea (AAV _R__2_ = 0.40, _P_ < 0.001; OTU _R__2_ = 0.52, _P_
< 0.001) and nitrite-reducing communities (AAV _R__2_ = 0.52, _P_ < 0.001; OTU _R__2_ = 0.58, _P_ < 0.001). In contrast, BFI had a less explanatory power for the composition of
methane-oxidising and methanogenic communities (Fig. 3), and for the overall composition of the archaeal and bacterial communities. Contrasting levels of phylogenetic diversity, encapsulated
within the functional groups analysed here, could partly explain the different strengths of relationships between BFI and community composition due to phylogenetic niche conservatism.
Aerobic and anaerobic ammonia oxidisers comprise relatively narrow phylogenetic diversity [41, 42] compared to methane-oxidisers and nitrite-reducers which are spread across several
taxonomic classes [43, 44]. The strong relationship observed between BFI and nitrite-reducing community composition is therefore unexpected, as this group contains phylogenetically diverse
species that, together, likely have a broad niche width. Potentially, the nitrite-reducers detected in our sediments represent only a limited subset of the phylogenetic diversity encompassed
within this group, albeit some of which may overlap with taxa found in the other functional groups studied here due to _nir_ genes being found in genomes from across the bacterial tree of
life. Shifts in community composition along the BFI gradient can be driven by turnover (the replacement of phylotypes along the gradient), or nestedness (the subsetting of communities along
the gradient). Therefore, we partitioned Sørensen dissimilarity into its turnover and nestedness components to examine the roles of these distinct processes separately. Turnover dominated
the total dissimilarity between communities across the BFI gradient compared to nestedness (Fig. S3). For many of the communities analysed, relationships between BFI and nestedness were
statistically significant but the effect size and explanatory power of these relationships was small compared to those for turnover-BFI relationships (Fig. S4 and Table S4). This result
shows that phylotype replacement drives compositional changes in microbial communities along the BFI gradient. Turnover of AAV communities was generally higher than for OTU communities
across all genes (Fig. S5), indicating a fine-scale partitioning of widespread OTUs into multiple amino acid sequences. Contrastingly, BFI explained substantially more variation in community
composition for OTU datasets than for AAVs, presumably reflecting different levels of ecological selection acting on them. Despite occasional differences in the turnover-BFI relationships
between AAV and OTU datasets, overall dissimilarity patterns for these datasets were generally strongly correlated, especially for nitrite reducers and methane oxidisers, but less
well-correlated for ammonia-oxidising bacteria and methanogens (Table S5). Stronger patterns at the DNA level (for OTU datasets) than at the amino acid level (AAV datasets) could indicate a
higher frequency of synonymous substitutions, leading to higher turnover of DNA sequence diversity relative to amino acid sequence diversity. Thus, environmental selection may not be acting
on the physical structure of the enzyme, but could be selecting for distinct strains or species (for an example in AOB, see [45]). Instances where we observed a stronger relationship between
BFI and AAV communities (e.g. in the richness of AOA communities) suggest selection on the primary structure of the enzyme that may propagate to/from higher levels of protein structure.
Subtle changes in the amino acid sequence of the ammonia monooxygenase enzyme may alter its activity or substrate-affinity [46], with potential biogeochemical implications. Significantly,
the active site, or sites, of the archaeal ammonia monooxygenase enzyme remain unresolved [47, 48] and thus variation in the AmoA subunit may have implications for nitrification in
geologically contrasting rivers. BASE FLOW NICHES OF MICROBIAL FUNCTIONAL GROUPS Ammonia-oxidising archaea and bacteria, and anammox bacteria potentially compete for the substrate ammonia,
and thus we tested for evidence of niche differentiation between these groups in relation to BFI based on gene abundances measured via qPCR. The ratio of AOA _amoA_ genes to other
ammonia-oxidisers (bacterial _amoA_ and anammox _hzo_ genes) decreased with increasing BFI (Fig. 4A; coef = 0.03, _z_ = −28.24, adj-_D__2_ = 0.56, _P_ < 0.001) so that AOA dominated the
low BFI clay sediments, and AOB were more abundant in high BFI chalk sediments, reflecting similar observations from permeable Mediterranean catchments [49]. Furthermore, the ratio of
anammox bacterial _hzo_ genes to aerobic ammonia-oxidiser (AOA and AOB) _amoA_ genes increased with BFI (Fig. 4B; coef = 5.06, _z_ = _4.48_, adj-_D__2_ = 0.18, _P_ < 0.0001), reaching a
mean of 21.7% of the total ammonia-oxidising community in the most permeable chalk sediments (BFI = 0.953). The ratio of bacterial _amoA_ and anammox _hzo_ gene abundances to bacterial 16S
rRNA gene abundance also increased dramatically in high BFI rivers (AOB; coef = 5.47, adj-_D__2_ = 0.23, _P_ < 0.0001, hzo; coef = 8.53, adj-_D__2_ = 0.33, _P_ < 0.0001) reflecting an
increase in the abundance of these groups relative to the total bacterial community as well as archaeal ammonia oxidisers. Bacterial _nirS_ gene abundance increased relative to bacterial 16S
rRNA gene abundance in high BFI rivers, albeit less markedly than the AOB or anammox bacteria (coef = 2.24, adj-_D__2_ = 0.06, _P_ < 0.01), whilst the absolute abundance of bacterial 16S
rRNA genes decreased by approximately 32% across the BFI gradient (coef = 0.32, adj-_D__2_ = 0.11, _P_ < 0.001). AOA:AOB ratios are often interpreted as evidence of niche differentiation
between these functionally synonymous groups. In the surrounding floodplain soils of the Hampshire Avon, we previously found AOA to be dominant, regardless of underlying geology [19]. In
contrast, here we found that ammonia-oxidising communities transition from being AOA-dominated to AOB/anammox-dominated at a BFI of ~0.6, suggesting that catchment permeability impacts
fluvial communities but not their counterparts in floodplain soils. AOA usually dominate at low ammonium concentrations due to their greater affinity for ammonium [50], however, the clay
sediments in our study catchment had the highest pore-water ammonium concentrations where the AOA dominated (Table S6). Instead, the dominance of AOA in the low BFI sediments may be due to
the overriding effects of lower dissolved oxygen concentrations and more acidic pH, both of which favour AOA (Table S6 [19, 51]). The higher relative abundance of anammox bacteria in high
BFI gravel sediments compared to low BFI clays suggests the presence of a micro-anoxic niche in these otherwise oxic, permeable sediments, perhaps provided by sediment grain topography
and/or stratified biofilm formation [52, 53]. Several of the functional groups showed temporal shifts in their relative proportions between the sampling months (Table S7). However, the
importance of accounting for sampling month varied strongly between the different functional groups. The ratio of _nirS_ gene copies to total bacterial 16S rRNA gene copies appeared most
dependent on sampling month, with inclusion of sampling month improving model fit ~10 fold (Table S7), whereas temporal variation explained little further variance in the ratio of _hzo_ gene
copies to bacterial 16S rRNA gene copies (Table S7). Temporal variation within our study had negligible impacts on the richness of the functional groups analysed but varying effects on the
relative proportions of each functional group. From our study it is not possible to detect whether these effects are seasonal, however if they are, they may be driven by nutrient inputs
which have been shown to vary seasonally in these rivers [17]. Over longer temporal scales (years to decades), we would expect the patterns observed here to be relatively stable given that
BFI is most strongly related to geology which does not usually vary much over non-geological timescales [15]. However, climate change and land-use shifts in the catchment may invoke more
rapid changes in BFI that could in turn impact upon sediment microbiomes over the coming decades [54, 55]. DNA AND PROTEIN SEQUENCE PROPERTIES For both ammonia-oxidising archaea and
bacteria, GC-content of _amoA_ genes decreased with BFI (Fig. 5A and Table S8), whereas CAI increased in AOA and decreased in AOB (Fig. 5B and Table S8). The shifts in GC-content and CAI of
archaeal and bacterial _amoA_ genes were accompanied by changes in the average hydrophobicity and net-charge of the translated protein sequences. AOA and AOB showed opposing relationships
between BFI and AmoA hydrophobicity (AOA; coef = −0.07, AOB; coef = 0.03, Table S8), with archaeal AmoA protein sequences becoming more hydrophilic in high BFI rivers, and bacterial AmoA
sequences becoming more hydrophobic. Despite the contrasting trends of hydrophobicity and CAI between AOA and AOB along the BFI gradient, both groups showed negative relationships between
BFI and the average net-charge of their AmoA protein sequence (AOA; coef = −0.08, AOB; coef = −0.25, Table S8). The DNA and protein sequence properties of the other microbial functional
genes analysed here were less clearly related to BFI. GC-content and CAI of _nirS_ genes showed weak relationships with BFI compared to those of AOA and AOB, whilst both NirS and McrA
protein sequences became more negatively charged as BFI increased (NirS; coef = −0.59, _R_2 = 0.12, McrA; coef = −1.13, _R_2 = 0.15, _P_ < 0.05 in both cases, Table S8). Along the BFI
gradient, the sediment changed from silty clays in the low BFI rivers to coarse gravels in the high BFI chalk rivers, likely shifting the dominant mode of life from free-living to
biofilm-associated. The observed relationships between BFI and protein sequence properties, particularly for the AmoA sequences, may therefore represent broad physiological responses to the
shift in lifestyle between sediment types. The ammonia monooxygenase enzyme is a membrane-bound protein ([56, 57], although see [58] for an example of a soluble form). The charge and
hydrophobicity of microbial cell membranes play important roles in biofilm formation [59, 60]. Microbial cells tend to adhere better to surfaces that match their membrane
hydrophobicity/hydrophilicity—that is to say that a hydrophobic surface will be more readily adhered to by hydrophobic cells and vice-versa [60]. We found that both AOA and AOB AmoA protein
sequences showed opposing hydrophobicity trends along the BFI gradient. Potentially, this suggests that they may adhere to different components of the river sediment that differ in their
hydrophobicity, thus spatially differentiating their niche at the scale of individual sediment particles. Ammonia oxidising archaeal and bacterial AmoA protein sequences also showed similar
(negative) relationships between net charge and BFI. The more negative charge associated with AmoA proteins in high BFI sites may play a role in acquiring ammonium from the environment [47],
although the role of hydrophobicity and charge in substrate affinity and enzymatic function remain unknown. For AmoA sequences, changes in protein sequence properties along the BFI gradient
were accompanied by changes in DNA properties, showing that not only did the identity of amino acids forming these proteins change, but so too did the underlying DNA sequences encoding
them. Biased codon use is associated with increased gene expression at the genomic level, but also reflects contrasting lifestyles among microorganisms [61]. Codon usage has also been found
to differ between phylogenetic lineages, including in _amoA_ sequences from the archaeal orders Nitrosopumilales and Nitrososphaerales [41], both of which were detected by our analysis of
archaeal 16S rRNA amplicons. The relationships between CAI and BFI could therefore result from taxonomic turnover across the base flow gradient. The average GC-content of archaeal and
bacterial _amoA_ genes also changed with respect to BFI. GC-content may be environmentally driven [62], but is also indicative of growth rate differences between microbial taxa [63]. In AOA,
the GC-content of entire _amoA_ genes predicts GC-content in the third codon position of each amino acid, potentially explaining concurrent shifts in CAI and GC-content of the archaeal and
bacterial _amoA_ genes [64]. These coupled relationships may therefore both result from taxonomic turnover along the BFI gradient. Higher GC-content (both across the genome and in the third
codon position) has been proposed as an adaptation to oxidative stress in aerobic prokaryotes [65, 66]. However, given that both AOA and AOB showed lower average GC-content in the high BFI
river sediments, which had the highest pore water oxygen saturation (Table S6), this explanation seems unlikely. The _pmoA_ gene is evolutionarily related to the _amoA_ gene, both being part
of the copper-containing membrane-bound monooxygenase family of enzymes [67, 68]. Therefore, it is surprising that we did not observe strong relationships between the sequence properties of
_pmoA_ genes and BFI, as we did for _amoA_ genes. Codon usage biases may arise as the result of limitation of certain resources, such as N [69, 70], and can also improve transcriptional and
translational efficiency in certain environments, as observed in type 1a methanotrophs [71]. Consequently, the contrasting relationships observed between the functional groups analysed here
may reflect substrate limitations specific to each functional group, as observed in global marine microbiomes [70]. The lack of relationship between BFI and _pmoA_ gene properties could
alternatively result from a complex interplay between substrate-competition-inhibition effects between ammonia-oxidisers, methanotrophs, and ammonia. Both ammonia- and particulate
methane-monooxygenase enzymes can oxidise methane and ammonia [72], but neither ammonia oxidisers or methanotrophs are able to use the energy from the oxidation of the alternate substrate
for growth. However, ammonia competitively inhibits the PMO enzyme and produces a toxic product, hydroxylamine, when oxidised. Methanotrophs have different strategies to detoxify
hydroxylamine, and these may differ from those of AOB or AOA, thus further setting apart their environmental niche from that of the AOA or AOB based on their ability to deal with reactive N
[73]. LIMITATIONS AND FUTURE DIRECTIONS An important caveat of our results is that correlation is not causation. BFI is not acting on microbial communities per se—BFI is a synthetic concept,
and a microorganism cannot sense the BFI of its habitat afterall. However, BFI is strongly correlated with a number of small-scale variables that do act directly upon microbial communities
such as redox profiles, pH, pore water oxygen saturation, and importantly geological sediment type [8, 17, 18, 74]. Furthermore, BFI will not explain all of the variation in microbial
community composition and functionality, as river biodiversity is likely structured by a hierarchy of variables acting at different spatial scales. However, as BFI is a large-scale
integrative property [16], which constrains the physico-chemical profile of river sediments, it represents a useful proxy for estimating microbial community composition at the regional scale
(Fig. S6). Here, amplicon-based analyses of the target C and N cycling functional groups was required in order to provide sufficient coverage of known rare groups, particularly the anammox
bacteria which constitute <1% of the total bacterial community in the sampled river sediments [8], and even less once archaeal and eukaryotic DNA detected by a metagenomic survey is
accounted for. However, metagenomic analysis of other membrane-associated enzymes from the wider microbial community, in tandem with analyses of whole-community functional profiles [12], may
shed further light on microbial functionalities associated with geological- or hydrological contexts. In particular, metagenomic data may show us the extent to which shifts in microbial
lifestyles from geologically distinct rivers constrains the physiological properties of their enzyme encoding protein sequences, and thus their contributions to riverine biogeochemistry.
Establishing the generality of the relationships observed here across a greater diversity of geological settings is a key priority in order to fully disentangle the role of hydrology from
geology. In our study sites, sediment types shifted from silty clays to highly permeable coarse gravels along the BFI gradient, reflecting the fact that both of these properties are strongly
linked to the underlying geology of a catchment. Therefore, we would expect the relationships observed here between BFI and microbial community properties to be replicable across other
catchments. That said, opportunities to unravel potential confounding effects of sediment structure from hydrology may come from sampling rivers with similar base flow conditions but
contrasting sediment properties [75]. Alternatively, in situ experiments that manipulate the sediment structure of a river (e.g. to create fish spawning habitat; [76]) would allow us to
control for the effects of hydrological variation and biogeographical processes, separating variation solely due to sediment structural changes. Understanding how hydrology and sediment
properties interactively shape microbial community structure and functionality will further enhance our ability to make large-scale predictions about the microbial ecology supporting
riverine biogeochemistry. In summary, our results show the statistical power of a single geodiversity variable, catchment permeability, in predicting not only shifts in community composition
of C- and N-cycling functional groups, but also genetic and protein properties. Our study highlights the ability of geodiversity variables to overcome what we term the “paradox of scales”
that has seen microbial ecologists predominantly focus on the small-scale physico-chemical environment. Questions about the spatial scales at which the environment influences microbial
communities remain enigmatic and difficult to answer [77, 78]. In part, this is because we know that microorganisms perceive their environment at microscopic scales [53, 79], and thus even
macroecological studies usually consider environmental variables that can vary at small spatial grain [78]. However, because these environmental variables change across very small spatial
scales, they do not facilitate a generalised understanding of microbial community ecology that can be extrapolated to larger scales or new sites [80, 81]. Instead, shifting our focus to
broader spatial scales by using geodiversity variables as proxies for smaller scale environmental heterogeneity may enable us to make more generalisable links between microbes and their
roles in global biogeochemical cycles, a need for which has long been recognised [82, 83]. Overall, our results offer a possible route towards ‘scaling-up’ predictions of fluvial
biogeochemistry and explaining differences in the fluxes of C and N between geologically distinct river catchments. REFERENCES * Cauwet, G. DOM in the Coastal Zone. In: Hansell, DA and
Carlson, CA, editors. Biogeochemistry of Marine Dissolved Organic Matter. London, UK: Academic Press; 2002. p. 579–609. * Schlesinger WH. On the fate of anthropogenic nitrogen. Proc Natl
Acad Sci. 2009;106:203–8. CAS PubMed Google Scholar * Cole JJ, Prairie YT, Caraco NF, McDowell WH, Tranvik LJ, Striegl RG, et al. Plumbing the Global Carbon Cycle: Integrating Inland
Waters into the Terrestrial Carbon Budget. Ecosystems. 2007;10:172–85. Google Scholar * Galloway JN, Dentener FJ, Capone DG, Boyer EW, Howarth RW, Seitzinger SP, et al. Nitrogen Cycles:
Past, Present, and Future. Biogeochemistry. 2004;70:153–226. CAS Google Scholar * Battin TJ, Besemer K, Bengtsson MM, Romani AM, Packmann AI. The ecology and biogeochemistry of stream
biofilms. Nat Rev Microbiol. 2016;14:251–63. CAS PubMed Google Scholar * Beaulieu JJ, Tank JL, Hamilton SK, Wollheim WM, Hall RO, Mulholland PJ, et al. Nitrous oxide emission from
denitrification in stream and river networks. Proc Natl Acad Sci. 2011;108:214–9. CAS PubMed Google Scholar * Clark DR, Ferguson RMW, Harris DN, Nicholass KJM, Prentice HJ, Randall KC, et
al. Streams of data from drops of water: 21st century molecular microbial ecology. Wiley Interdiscip Rev Water. 2018;5:e1280. Google Scholar * Lansdown K, McKew BA, Whitby C, Heppell CM,
Dumbrell AJ, Binley A, et al. Importance and controls of anaerobic ammonium oxidation influenced by riverbed geology. Nat Geosci. 2016;9:357–60. CAS Google Scholar * Shen L, Ouyang L, Zhu
Y, Trimmer M. Active pathways of anaerobic methane oxidation across contrasting riverbeds. ISME J. 2019;13:752–66. CAS PubMed Google Scholar * Gray, M. Geodiversity: valuing and
conserving abiotic nature. Chichester, UK: John Wiley & Sons; 2004. * Kärnä O-M, Heino J, Laamanen T, Jyrkänkallio-Mikkola J, Pajunen V, Soininen J, et al. Does catchment geodiversity
foster stream biodiversity? Landsc Ecol. 2019;34:2469–85. Google Scholar * Niederdorfer R, Peter H, Battin TJ. Attached biofilms and suspended aggregates are distinct microbial lifestyles
emanating from differing hydraulics. Nat Microbiol. 2016;1:1–7. Google Scholar * Widder S, Besemer K, Singer GA, Ceola S, Bertuzzo E, Quince C, et al. Fluvial network organization imprints
on microbial co-occurrence networks. Proc Natl Acad Sci. 2014;111:12799–804. CAS PubMed PubMed Central Google Scholar * Gustard A, Bullock A, and Dixon JM. Low flow estimation in the
United Kingdom. Wallingford: Institute of Hydrology; 1992. * Bloomfield JP, Allen DJ, Griffiths KJ. Examining geological controls on Baseflow Index (BFI) using regression analysis: an
illustration from the Thames Basin, UK. J Hydrol. 2009;373:164–76. Google Scholar * Griffin A, Young A, Stewart L. Revising the BFIHOST catchment descriptor to improve UK flood frequency
estimates. Hydrol Res. 2019;50:1508–19. Google Scholar * Heppell CM, Binley A, Trimmer M, Darch T, Jones A, Malone E, et al. Hydrological controls on DOC: nitrate resource stoichiometry in
a lowland, agricultural catchment, southern UK. Hydrol Earth Syst Sci. 2017;21:4785–802. CAS Google Scholar * Rovelli L, Attard KM, Binley A, Heppell CM, Stahl H, Trimmer M, et al.
Reach-scale river metabolism across contrasting sub-catchment geologies: Effect of light and hydrology. Limnol Oceanogr. 2017;62:S381–S399. PubMed PubMed Central Google Scholar * Clark
DR, McKew BA, Dong LF, Leung G, Dumbrell AJ, Stott A, et al. Mineralization and nitrification: Archaea dominate ammonia-oxidising communities in grassland soils. Soil Biol Biochem.
2020;143:107725. CAS Google Scholar * Martin M. Cutadapt removes adapter sequences from highthroughput sequencing reads. EMBnet.journal 2011;17:10. https://doi.org/10.14806/ej.17.1.200. *
Chen S, Zhou Y, Chen Y, Gu J. fastp: an ultra-fast all-in-one FASTQ preprocessor. Bioinformatics. 2018;34:i884–i890. PubMed PubMed Central Google Scholar * Nikolenko SI, Korobeynikov AI,
Alekseyev MA. BayesHammer: Bayesian clustering for error correction in single-cell sequencing. BMC Genomics. 2013;14(Suppl 1):S7. https://doi.org/10.1186/1471-2164-14-S1-S7. Article PubMed
PubMed Central Google Scholar * Nurk S, Bankevich A, Antipov D, Gurevich A, Korobeynikov A, Lapidus A, et al. Assembling genomes and mini-metagenomes from highly chimeric reads. In
Annual International Conference on Research in Computational Molecular Biology (pp. 158-170). Berlin, Heidelberg: Springer, 2013. * Dumbrell AJ, Ferguson RMW, and Clark DR Microbial
Community Analysis by Single-Amplicon High-Throughput Next Generation Sequencing: Data Analysis – From Raw Output to Ecology. In:McGenity, TJ, Timmis, KN, and Nogales, B, editors.
Hydrocarbon and Lipid Microbiology Protocols: Microbial Quantitation, Community Profiling and Array Approaches. Springer Protocols Handbooks. Berlin, Heidelberg: Springer Berlin Heidelberg;
2016. p. 155–206. * Q Wang, JF Quensen 3rd, JA Fish, TK Lee, Y Sun, JM Tiedje, JR Cole 4, mBio 2013. https://doi.org/10.1128/mBio.00592-13. * Fish JA, Chai B, Wang Q, Sun Y, Brown CT, Tiedje
JM, et al. FunGene: the functional gene pipeline and repository. Front Microbiol. 2013;4:291. PubMed PubMed Central Google Scholar * Robert C, Edgar. Search and clustering orders of
magnitude faster than BLAST. Bioinformatics. 2010;26:2460–2461. https://doi.org/10.1093/bioinformatics/btq461. Article CAS Google Scholar * Rognes T, Flouri T, Nichols B, Quince C, Mahé
F. VSEARCH: a versatile open source tool for metagenomics. PeerJ. 2016;4:e2584. https://doi.org/10.7717/peerj.2584. Article PubMed PubMed Central Google Scholar * R Core Team. R: A
Language and Environment for Statistical Computing. Vienna, Austria: R Foundation for Statistical Computing; 2019. Google Scholar * McKnight DT, Huerlimann R, Bower DS, Schwarzkopf L,
Alford RA, Zenger KR. Methods for normalizing microbiome data: An ecological perspective. Methods Ecol Evol. 2019;10:389–400. Google Scholar * Weiss S, Xu ZZ, Peddada S, Amir A, Bittinger
K, Gonzalez A, et al. Normalization and microbial differential abundance strategies depend upon data characteristics. Microbiome. 2017;5:27. PubMed PubMed Central Google Scholar *
Gómez‐Rodríguez C, Baselga A. Variation among European beetle taxa in patterns of distance decay of similarity suggests a major role of dispersal processes. Ecography. 2018;41:1825–34.
Google Scholar * Oksanen J, Blanchet FG, Friendly M, Kindt R, Legendre P, McGlinn D, et al. vegan: Community Ecology Package. 2019. https://CRAN.R-project.org/package=vegan. * Baselga A,
Orme CDL. betapart: an R package for the study of beta diversity. Methods Ecol Evol. 2012;3:808–12. Google Scholar * Venables WN and Ripley BD. Modern Applied Statistics with S. 4th ed. New
York: Springer-Verlag; 2002. * Osorio D, Rondón-Villarreal P, Torres R. Peptides: A Package for Data Mining of Antimicrobial Peptides. R J. 2015;7:4. Google Scholar * Dowle M and
Srinivasan A. data.table: Extension of ‘data.frame’; 2019. https://CRAN.R-project.org/package=data.table. * Wickham H. ggplot2: Elegant Graphics for Data Analysis New York: Springer-Verlag;
2009. * Environment Agency. Catchment Data Explorer; 2018. https://environment.data.gov.uk/catchment-planning/. * Pebesma E. Simple Features for R: standardized support for spatial vector
data. R J. 2018;10:439. Google Scholar * Alves RJE, Minh BQ, Urich T, von Haeseler A, Schleper C. Unifying the global phylogeny and environmental distribution of ammonia-oxidising archaea
based on amoA genes. Nat Commun. 2018;9:1517. PubMed PubMed Central Google Scholar * Niftrik Lvan, Jetten MSM. Anaerobic Ammonium-Oxidizing Bacteria: Unique Microorganisms with
Exceptional Properties. Microbiol Mol Biol Rev. 2012;76:585–96. PubMed PubMed Central Google Scholar * Knief C. Diversity and Habitat Preferences of Cultivated and Uncultivated Aerobic
Methanotrophic Bacteria Evaluated Based on pmoA as Molecular Marker. Front Microbiol. 2015;6:1346. PubMed PubMed Central Google Scholar * Wei W, Isobe K, Nishizawa T, Zhu L, Shiratori Y,
Ohte N, et al. Higher diversity and abundance of denitrifying microorganisms in environments than considered previously. ISME J. 2015;9:1954–65. CAS PubMed PubMed Central Google Scholar
* Rotthauwe JH, Witzel KP, Liesack W. The ammonia monooxygenase structural gene amoA as a functional marker: molecular fine-scale analysis of natural ammonia-oxidizing populations. Appl
Environ Microbiol. 1997;63:4704–12. CAS PubMed PubMed Central Google Scholar * Sintes E, De Corte D, Haberleitner E, Herndl GJ. Geographic Distribution of Archaeal Ammonia Oxidizing
Ecotypes in the Atlantic Ocean. Front Microbiol. 2016;7:77. PubMed PubMed Central Google Scholar * Li PN, Herrmann J, Tolar BB, Poitevin F, Ramdasi R, Bargar JR, et al. Nutrient transport
suggests an evolutionary basis for charged archaeal surface layer proteins. ISME J. 2018;12:2389–402. CAS PubMed PubMed Central Google Scholar * Wright CL, Schatteman A, Crombie AT,
Murrell JC, Lehtovirta-Morley LE. Inhibition of Ammonia Monooxygenase from Ammonia-Oxidizing Archaea by Linear and Aromatic Alkynes. Appl Environ Microbiol. 2020;86:e02388–19. CAS PubMed
PubMed Central Google Scholar * Merbt SN, Auguet J-C, Blesa A, Martí E, Casamayor EO. Wastewater Treatment Plant Effluents Change Abundance and Composition of Ammonia-Oxidizing
Microorganisms in Mediterranean Urban Stream Biofilms. Microb Ecol. 2015;69:66–74. CAS PubMed Google Scholar * Prosser JI, Nicol GW. Archaeal and bacterial ammonia-oxidisers in soil: the
quest for niche specialisation and differentiation. Trends Microbiol. 2012;20:523–31. CAS PubMed Google Scholar * French E, Kozlowski JA, Mukherjee M, Bullerjahn G, Bollmann A.
Ecophysiological Characterization of Ammonia-Oxidizing Archaea and Bacteria from Freshwater. Appl Environ Microbiol. 2012;78:5773–80. CAS PubMed PubMed Central Google Scholar * Kindaichi
T, Tsushima I, Ogasawara Y, Shimokawa M, Ozaki N, Satoh H, et al. In Situ Activity and Spatial Organization of Anaerobic Ammonium-Oxidizing (Anammox) Bacteria in Biofilms. Appl Environ
Microbiol. 2007;73:4931–9. CAS PubMed PubMed Central Google Scholar * Probandt D, Eickhorst T, Ellrott A, Amann R, Knittel K. Microbial life on a sand grain: from bulk sediment to single
grains. ISME J. 2018;12:623–33. PubMed Google Scholar * Ahiablame L, Sheshukov AY, Rahmani V, Moriasi D. Annual baseflow variations as influenced by climate variability and agricultural
land use change in the Missouri River Basin. J Hydrol. 2017;551:188–202. Google Scholar * Beck HE, Dijk AIJM, van, Miralles DG, Jeu RAM, de, Bruijnzeel LA, (Sampurno), et al. Global
patterns in base flow index and recession based on streamflow observations from 3394 catchments. Water Resour Res. 2013;49:7843–63. Google Scholar * Norton JM, Low JM, Klotz MG. The gene
encoding ammonia monooxygenase subunit A exists in three nearly identical copies in _Nitrosospira_ sp. NpAV. FEMS Microbiol Lett. 1996;139:181–8. CAS PubMed Google Scholar * Sakoula D,
Smith GJ, Frank J, Mesman RJ, Kop LFM, Jetten MSM, et al. Universal activity-based labelling method for ammonia and alkane-oxidizing bacteria. ISME J. 2021.
https://doi.org/10.1038/s41396-021-01144-0. * Gilch S, Meyer O, Schmidt I. A soluble form of ammonia monooxygenase in Nitrosomonas europaea. Biol Chem. 2009;390:863–73. CAS PubMed Google
Scholar * Donlan RM. Biofilms: Microbial Life on Surfaces. Emerg Infect Dis. 2002;8:881–90. PubMed PubMed Central Google Scholar * Krasowska A, Sigler K. How microorganisms use
hydrophobicity and what does this mean for human needs? Front Cell Infect Microbiol. 2014;4:112. PubMed PubMed Central Google Scholar * Willenbrock H, Friis C, Juncker AS, Ussery DW. An
environmental signature for 323 microbial genomes based on codon adaptation indices. Genome Biol. 2006;7:R114. PubMed PubMed Central Google Scholar * Reichenberger ER, Rosen G, Hershberg
U, Hershberg R. Prokaryotic Nucleotide Composition Is Shaped by Both Phylogeny and the Environment. Genome Biol Evol. 2015;7:1380–9. CAS PubMed PubMed Central Google Scholar * Raghavan
R, Kelkar YD, Ochman H. A selective force favoring increased G+C content in bacterial genes. Proc Natl Acad Sci. 2012;109:14504–7. CAS PubMed PubMed Central Google Scholar * Tavormina
PL, Orphan VJ, Kalyuzhnaya MG, Jetten MSM, Klotz MG. A novel family of functional operons encoding methane/ammonia monooxygenase-related proteins in gammaproteobacterial methanotrophs.
Environ Microbiol Rep. 2011;3:91–100. CAS PubMed Google Scholar * Aslam S, Lan X-R, Zhang B-W, Chen Z-L, Wang L, Niu D-K. Aerobic prokaryotes do not have higher GC contents than anaerobic
prokaryotes, but obligate aerobic prokaryotes have. BMC Evol Biol. 2019;19:35. PubMed PubMed Central Google Scholar * Goncearenco A, Ma B-G, Berezovsky IN. Molecular mechanisms of
adaptation emerging from the physics and evolution of nucleic acids and proteins. Nucleic Acids Res. 2014;42:2879–92. CAS PubMed Google Scholar * Holmes AJ, Costello A, Lidstrom ME,
Murrell JC. Evidence that particulate methane monooxygenase and ammonia monooxygenase may be evolutionarily related. FEMS Microbiol Lett. 1995;132:203–8. CAS PubMed Google Scholar *
Khadka R, Clothier L, Wang L, Lim CK, Klotz MG, Dunfield PF. Evolutionary History of Copper Membrane Monooxygenases. Front Microbiol. 2018;9:2493. PubMed PubMed Central Google Scholar *
Seward EA, Kelly S. Dietary nitrogen alters codon bias and genome composition in parasitic microorganisms. Genome Biol. 2016;17:226. PubMed PubMed Central Google Scholar * Shenhav L,
Zeevi D. Resource conservation manifests in the genetic code. Science. 2020;370:683–7. CAS PubMed Google Scholar * Villada JC, Duran MF, Lee PKH. Genomic Evidence for Simultaneous
Optimization of Transcription and Translation through Codon Variants in the pmoCAB Operon of Type Ia Methanotrophs. mSystems. 2019;4:e00342–19. PubMed PubMed Central Google Scholar *
Bédard C, Knowles R. Physiology, biochemistry, and specific inhibitors of CH4, NH4+, and CO oxidation by methanotrophs and nitrifiers. Microbiol Mol Biol Rev. 1989;53:68–84. Google Scholar
* Stein LY, Roy R, and Dunfield PF. Aerobic methanotrophy and nitrification: processes and connections. _eLS_. 2012. * Jordan TE, Correll DL, Weller DE. Relating nutrient discharges from
watersheds to land use and streamflow variability. Water Resour Res. 1997;33:2579–90. CAS Google Scholar * Hale VC, McDonnell JJ. Effect of bedrock permeability on stream base flow mean
transit time scaling relations: 1. A multiscale catchment intercomparison. Water Resour Res. 2016;52:1358–74. Google Scholar * Barlaup BT, Gabrielsen SE, Skoglund H, Wiers T. Addition of
spawning gravel—a means to restore spawning habitat of atlantic salmon (Salmo salar L.), and Anadromous and resident brown trout (Salmo trutta L.) in regulated rivers. River Res Appl.
2008;24:543–50. Google Scholar * Ladau J, Eloe-Fadrosh EA. Spatial, Temporal, and Phylogenetic Scales of Microbial Ecology. Trends Microbiol. 2019;27:662–9. CAS PubMed Google Scholar *
Xu X, Wang N, Lipson D, Sinsabaugh R, Schimel J, He L, et al. Microbial macroecology: In search of mechanisms governing microbial biogeographic patterns. Glob Ecol Biogeogr. 2020;29:1870–86.
Google Scholar * Vos M, Wolf AB, Jennings SJ, Kowalchuk GA. Micro-scale determinants of bacterial diversity in soil. FEMS Microbiol Rev. 2013;37:936–54. CAS PubMed Google Scholar *
Alzarhani AK, Clark DR, Underwood GJC, Ford H, Cotton TEA, Dumbrell AJ. Are drivers of root-associated fungal community structure context specific? ISME J. 2019;13:1330. PubMed PubMed
Central Google Scholar * Hendershot JN, Read QD, Henning JA, Sanders NJ, Classen AT. Consistently inconsistent drivers of microbial diversity and abundance at macroecological scales.
Ecology. 2017;98:1757–63. PubMed Google Scholar * Antwis RE, Griffiths SM, Harrison XA, Aranega-Bou P, Arce A, Bettridge AS, et al. Fifty important research questions in microbial ecology.
FEMS Microbiol Ecol. 207;93. * Schimel J. Playing scales in the methane cycle: from microbial ecology to the globe. Proc Natl Acad Sci. 2004;101:12400–1. CAS PubMed PubMed Central Google
Scholar Download references ACKNOWLEDGEMENTS We thank Ashley Lewis and Ed Malone for assistance in field hydrological measurements, Katrina Lansdown, Garwai Leung and Scott Warren for
assistance with field sampling. DC, CW, BM (NE/P011624/1), CW, BM (NE/J011959/1), AB (NE/J011738/1) and CMH, MT (NE/J012106/1) were supported by NERC funding whilst working on this project.
We also thank landowners for permitting site access during fieldwork. AUTHOR INFORMATION AUTHORS AND AFFILIATIONS * School of Life Sciences, University of Essex, Wivenhoe Park, Colchester,
Essex, CO4 3SQ, UK Dave R. Clark, Boyd A. McKew & Corinne Whitby * Institute for Analytics and Data Science, University of Essex, Wivenhoe Park, Colchester, Essex, CO4 3SQ, UK Dave R.
Clark * Lancaster Environment Centre, Lancaster University, Lancaster, LA1 4YQ, UK Andrew Binley * School of Geography, Queen Mary University of London, Mile End Road, London, E1 4NS, UK
Catherine M. Heppell * School of Biological and Behavioural Sciences, Queen Mary University of London, Mile End Road, London, E1 4NS, UK Mark Trimmer Authors * Dave R. Clark View author
publications You can also search for this author inPubMed Google Scholar * Boyd A. McKew View author publications You can also search for this author inPubMed Google Scholar * Andrew Binley
View author publications You can also search for this author inPubMed Google Scholar * Catherine M. Heppell View author publications You can also search for this author inPubMed Google
Scholar * Corinne Whitby View author publications You can also search for this author inPubMed Google Scholar * Mark Trimmer View author publications You can also search for this author
inPubMed Google Scholar CONTRIBUTIONS BAM, AB, CW, CMH and MT conceived and designed the study. BAM conducted the sampling and laboratory analyses for molecular work. DRC analysed the data
with support from BAM. DRC wrote the paper and all authors contributed to editing the manuscript. AB, CW, CMH and MT secured the funding for this study. CORRESPONDING AUTHOR Correspondence
to Dave R. Clark. ETHICS DECLARATIONS COMPETING INTERESTS The authors declare no competing interests. ADDITIONAL INFORMATION PUBLISHER’S NOTE Springer Nature remains neutral with regard to
jurisdictional claims in published maps and institutional affiliations. SUPPLEMENTARY INFORMATION SUPPLEMENTARY INFORMATION RIGHTS AND PERMISSIONS OPEN ACCESS This article is licensed under
a Creative Commons Attribution 4.0 International License, which permits use, sharing, adaptation, distribution and reproduction in any medium or format, as long as you give appropriate
credit to the original author(s) and the source, provide a link to the Creative Commons license, and indicate if changes were made. The images or other third party material in this article
are included in the article’s Creative Commons license, unless indicated otherwise in a credit line to the material. If material is not included in the article’s Creative Commons license and
your intended use is not permitted by statutory regulation or exceeds the permitted use, you will need to obtain permission directly from the copyright holder. To view a copy of this
license, visit http://creativecommons.org/licenses/by/4.0/. Reprints and permissions ABOUT THIS ARTICLE CITE THIS ARTICLE Clark, D.R., McKew, B.A., Binley, A. _et al._ Hydrological
properties predict the composition of microbial communities cycling methane and nitrogen in rivers. _ISME COMMUN._ 2, 5 (2022). https://doi.org/10.1038/s43705-022-00087-7 Download citation *
Received: 25 May 2021 * Revised: 18 December 2021 * Accepted: 23 December 2021 * Published: 21 January 2022 * DOI: https://doi.org/10.1038/s43705-022-00087-7 SHARE THIS ARTICLE Anyone you
share the following link with will be able to read this content: Get shareable link Sorry, a shareable link is not currently available for this article. Copy to clipboard Provided by the
Springer Nature SharedIt content-sharing initiative