- Select a language for the TTS:
- UK English Female
- UK English Male
- US English Female
- US English Male
- Australian Female
- Australian Male
- Language selected: (auto detect) - EN
Play all audios:
ABSTRACT The interannual variation of evapotranspiration in tropical rainforests is thought to be small, despite the variability of precipitation. Here we investigated the cause of this
phenomenon in the Maritime Continent using observations, reanalysis data and model simulations. We find that evapotranspiration’s interannual variation is dampened by the self-compensating
mechanism of canopy evaporation and transpiration. During El Niño, when precipitation is lower than climatology, canopy evaporation decreases due to less interception, while canopy
transpiration increases in response to increased incoming solar radiation, resulting in a compensating effect and a small interannual variation of evapotranspiration. Deforestation, however,
eliminates transpiration’s dampening effect and, thus, amplifies the interannual variation of evapotranspiration significantly. This increase in evapotranspiration’s interannual variation
due to deforestation further affect the local hydrological cycle, resulting in decreased interannual variation of precipitation. The results highlight the impacts of deforestation and
emphasize the critical role of tropical rainforests in the hydroclimatological cycle. SIMILAR CONTENT BEING VIEWED BY OTHERS DECIPHERING THE ROLE OF EVAPOTRANSPIRATION IN DECLINING RELATIVE
HUMIDITY TRENDS OVER LAND Article Open access 12 February 2025 DEFORESTATION INTENSIFIES DAILY TEMPERATURE VARIABILITY IN THE NORTHERN EXTRATROPICS Article Open access 10 October 2022
LAND-USE INDUCED CHANGES IN EXTREME TEMPERATURE PREDOMINANTLY INFLUENCED BY DOWNWARD LONGWAVE RADIATION Article Open access 05 December 2024 INTRODUCTION The variation in evapotranspiration
is a critical topic in understanding the hydrological water cycle1,2 and surface energy balance3. Evapotranspiration is influenced by changes in surface properties and meteorological
conditions. It consists of canopy evaporation, canopy transpiration, and soil evaporation, each responding differently to alterations in land surface type and meteorological variables. In
tropical rainforests, canopy transpiration is the major contributor to evapotranspiration, followed by canopy evaporation, and soil evaporation is the least4. However, deforestation, a
significant change in land surface type, could reduce leaf interception, leading to decreased canopy evaporation, and can also impact canopy transpiration by eliminating deep root systems
used for extracting water from deeper soil layers. As a result, soil evaporation may increase and dominate evapotranspiration after deforestation. Deforestation can alter
evapotranspiration’s partitioning and hydrological cycle, impacting moisture recycling patterns and redistributing water resources5. Meteorological conditions, such as precipitation and
incoming solar radiation, could affect evapotranspiration sensitivity6,7,8,9,10. Each meteorological variable plays a unique role in changing different parts of evapotranspiration. For
instance, precipitation provides available water for canopy interception and soil evaporation. Specifically, canopy interception is highly dependent on precipitation rather than other
meteorological variables11. Canopy transpiration, on the other hand, is primarily related to solar radiation through photosynthesis, particularly in energy-limited tropical rainforests4.
When there is more incoming solar radiation, rainforests have stronger photosynthesis and higher canopy transpiration, even during extreme droughts when roots can reach deeper soil layers to
extract water for transpiration, keeping total evapotranspiration at a certain level12,13. Furthermore, changes in meteorological variables in tropical regions are strongly associated with
natural variabilities, such as the El Niño-Southern Oscillation (ENSO), an interannual climate variability in the tropical Pacific region. ENSO leads to abnormal large-scale circulation and
precipitation over the tropics, e.g., affecting evapotranspiration in the MC and Amazon rainforests6,10. During El Niño years (warm phase of ENSO), the decrease in precipitation results in
the decreased canopy evaporation. However, an increase in incoming solar radiation leads to stronger photosynthesis and increased canopy transpiration, offsetting the decrease in evaporation
from both the canopy and soil, indicating a compensatory relationship between these components14,15. The above-mentioned studies emphasize the role of the compensating relationship in the
year-to-year changes of evapotranspiration. This relationship may change due to the increased deforestation within the MC16,17, which subsequently decreases canopy evaporation and
transpiration. Examining how evapotranspiration varies between different ENSO phases in a deforested environment is important for understanding the local water cycle and climate. Therefore,
this study focuses on the differences in evapotranspiration during various ENSO phases and investigates the role of rainforests in changing surface evapotranspiration using observations,
reanalysis datasets, and model experiments. This study investigates changes in evapotranspiration and its partitioning, and their interannual variation related to ENSO in the MC rainforest,
which has experienced increasing deforestation in recent decades16,17. More specifically, the interannual variation was defined by the difference between El Niño and La Niña. We used the
Global Precipitation Climatology Centre (GPCC18,19) precipitation data to quantify the precipitation changes in different ENSO phases over the MC. To estimate land surface evapotranspiration
and its components during different ENSO phases, we utilized various datasets, including the European Centre for Medium-Range Weather Forecasts Reanalysis v5 land data (ERA5-land20,21) and
the Global Land Evaporation Amsterdam Model (GLEAM22,23), the Community Earth System Model (CESM) 2 piControl (CESM2-piC), and the CESM1 large ensemble (CESM1-LE24). We defined ENSO cases
using the Oceanic Niño Index. Further details can be found in the data, method, and experiments section. To explore the role of forests in managing evapotranspiration fluctuations, we
conducted a series of idealized deforestation experiments in the MC using the offline Community Land Model version 4 (CLM425) and the fully coupled Community Earth System Model 2 (CESM2).
The simulation results showed that the interannual variation of evapotranspiration could increase after deforestation, thereby affecting the hydroclimatological cycle and decreasing the
interannual variation of precipitation. RESULTS THE INTERANNUAL VARIATION OF PRECIPITATION AND EVAPOTRANSPIRATION During El Niño, there is a warm anomaly in the sea surface temperature of
the tropical eastern or central Pacific, which leads to a change in the Walker circulation and an eastward shift of convection, resulting in decreased precipitation in the MC region.
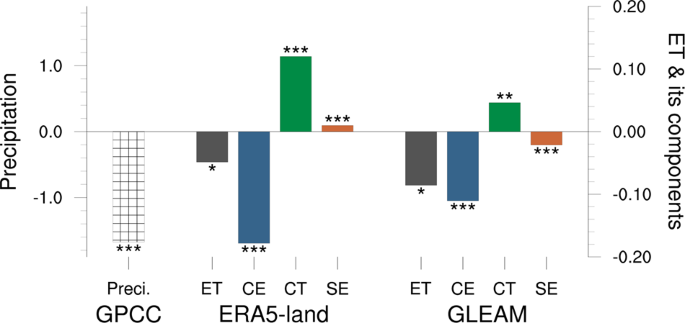
Conversely, during La Niña years, convection and precipitation in the MC increase. The GPCC observed a significant precipitation difference between El Niño and La Niña years of −1.68 mm
day−1 (represented by the white square bar in Fig. 1), which is 23.3% of the mean annual precipitation of 7.19 mm day−1 (Supplementary Table 1 in Supporting Information), indicating a
significant interannual variation in precipitation. However, reanalysis data from ERA5-Land and GLEAM show the difference in evapotranspiration between El Niño and La Niña years to be −0.05
mm day−1 and −0.09 mm day−1, respectively (represented by the gray bars in Fig. 1). The ratio of these differences to their respective climatological evapotranspiration is only 1.3% and 3.2%
(Supplementary Table 1), respectively. This relatively stable evapotranspiration characteristic is consistent with findings in Kume et al.11, Kosugi et al.12 and Fatichi and Ivanov26.
CANOPY TRANSPIRATION DAMPENS THE INTERANNUAL VARIATION OF EVAPOTRANSPIRATION We then examined changes in evapotranspiration components during different ENSO phases to investigate the small
interannual variation of evapotranspiration, which can be attributed to the biophysical characteristics of rainforests. In the MC rainforests, soil evaporation accounts for only about 6% of
evapotranspiration in the reanalysis data. Therefore, our discussion in this section focuses on canopy evaporation and transpiration only. Figure 1 shows that the difference in canopy
evaporation is −0.18 mm day−1 for ERA5-Land and −0.11 mm day−1 for GLEAM (blue bars), indicating less canopy interception in response to decreased precipitation during El Niño years than La
Niña years. Conversely, more canopy transpiration occurs during El Niño years compared to La Niña years, with the difference in canopy transpiration being 0.12 mm day−1 for ERA5-Land and
0.05 mm day−1 for GLEAM (green bars in Fig. 1). This is because El Niño years feature the eastward shift of the ascending branch of Walker circulation. Consequently, the less-than-normal
convection leads to less cloud cover and more incoming solar radiation, allowing rainforests to absorb more energy and draw more water for transpiration from deeper soil layers. Thus, the
biophysical characteristics of rainforests increase canopy transpiration, dampening the decrease of canopy evaporation in El Niño years and vice versa for La Niña years. As a result,
evapotranspiration shows smaller interannual variations compared to precipitation. The same characteristic can also be observed in the CESM2-piC and CESM1-LE simulations (see Supplementary
Fig. 1). In these two simulations, the decrease in precipitation between two different ENSO phases is both ~1.23 mm day−1 (white square bars in Supplementary Fig. 1), which is slightly
smaller than the decrease in the GPCC observations. The ratio of precipitation changes relative to their climatology is 12.4% for CESM2-piC and 16.2% for CESM1-LE (Supplementary Table 1).
However, the decrease in evapotranspiration is also relatively small, with a decrease of 0.05 mm day−1 in CESM2-piC (or 1.6% of its climatology; Supplementary Table 1) and 0.02 mm day−1 in
CESM1-LE (or 0.4% of its climatology; Supplementary Table 1). This is because the decrease in canopy evaporation (−0.12 mm day−1 in CESM2-piC and −0.17 mm day−1 in CESM1-LE, blue bars in
Supplementary Fig. 1) is partially offset by the increase in canopy transpiration (0.07 mm day−1 in the CESM2-piC and 0.15 mm day−1 in the CESM1-LE, green bars in Supplementary Fig. 1). THE
ROLE OF FOREST IN THE INTERANNUAL VARIATION OF EVAPOTRANSPIRATION To investigate the role of rainforests in regulating terrestrial hydrological cycles, we conducted two idealized experiments
using the modified CESM CLM4 model. The CLM4 was modified to correct the overestimation of soil evaporation27. These experiments consisted of a control simulation and a forest removal
simulation, where all canopy in the MC was replaced with bare soil from 90°E to 140°E (see Supplementary Fig. 2). This resulted in near-zero canopy evaporation and transpiration, with
evapotranspiration primarily driven by soil evaporation. Both simulations were subjected to two atmospheric forcing datasets, the Climatic Research Unit version 7 (CRUv728) and the Global
Soil Wetness Project Phase 3 (GSWP329), from 1981 to 2014 to drive the modified CLM4, resulting in a total of four offline simulations. More information can be found in the data, method, and
experiments section. We then assessed the impacts of MC rainforest removal on changes in evapotranspiration and its interannual variations due to ENSO by comparing the two simulations.
Figure 2 shows that the CLM4 with CRUv7 forcing can reasonably simulate changes in evapotranspiration and its partitioning in response to changes in precipitation between different ENSO
phases. In both runs, with the same prescribed precipitation forcing, precipitation in the MC decreased by 1.43 mm day−1 (white square bar in Fig. 2) in El Niño years compared to La Niña
years. The corresponding decrease in evapotranspiration in the MC was only 0.1 mm day−1 in the control run (darker gray bar). The increase in canopy transpiration (0.17 mm day−1, green bar)
was able to dampen the changes in canopy evaporation (−0.26 mm day−1, blue bar), thereby decreasing the interannual variation of evapotranspiration. In the deforestation simulations, the
mean evapotranspiration decreased from 4.19 mm day−1 in the control run to 2.09 mm day−1 in the deforestation run due to the lack of canopy evaporation and transpiration. Meanwhile, the
difference in evapotranspiration between El Niño and La Niña years was larger, with a decrease of 0.17 mm day−1 (lighter gray bar), since there was no canopy transpiration to adjust the
amount of water transported from deeper soil layers to the atmosphere. The ratio of the evapotranspiration difference to its climatology increased from 2.4% in the control run to 8.3% in the
deforestation run, indicating that interannual evapotranspiration would vary more vigorously after forest removal. Similar results were obtained when another atmospheric forcing was used
(GSWP3; see Supplementary Fig. 3). Our results imply that forests can significantly impact the interannual variation of evapotranspiration. THE IMPLICATION OF ENHANCING INTERANNUAL VARIATION
OF EVAPOTRANSPIRATION ON THE INTERANNUAL VARIATION OF LOCAL PRECIPITATION Idealized offline simulations have demonstrated that deforestation can significantly impact the interannual
variation of evapotranspiration. To further investigate the impacts on precipitation, we conducted the same paired experiments (i.e., control and idealized deforestation run) using the fully
coupled CESM2 model with forty ensemble members (see the “Data, method, and experiments” section) to examine how the interannual variation of local precipitation is affected in response to
changes in evapotranspiration over an interannual time scale. Our results show that the dampening effect of canopy transpiration can also be reproduced in the control simulations of the
fully coupled model (Fig. 3). During El Niño years, when precipitation decreased by 1.4 mm day−1 (white square bar) compared to La Niña years, evapotranspiration decreased by only 0.04 mm
day−1 (darker gray bar) due to the increase in transpiration (0.08 mm day−1, darker green bar) offsetting the decrease in evaporation (−0.12 mm day−1, darker blue bar). In contrast, in the
deforestation scenario, the interannual variation of evapotranspiration was more pronounced (−0.21 mm day−1, lighter gray bar). Evapotranspiration is also more strongly correlated with
precipitation, with the correlation increasing from 0.30 in the control run to 0.86 in the deforestation run. This can also be seen in the scatter plot presented in Supplementary Fig. 4,
where the slope indicating the relation is significantly steeper in the deforestation run (red) than in the control run (black). This suggests that, without the dampening effect of
transpiration in the deforestation run, evapotranspiration is more responsive to changes in precipitation. However, it is important to note that the interannual difference in precipitation
decreased after deforestation (−1.09 mm day−1, black square bar in Fig. 3) in the fully coupled model, despite the increase in the interannual variation of evapotranspiration. The amplified
impacts of deforestation during El Niño15,30,31 help elucidate the decreased interannual variation of precipitation. In a neutral climate scenario, deforestation led to reduced local
evapotranspiration, causing surface warming and creating an unstable atmosphere that facilitated increased low-level moisture convergence from the surrounding sea; consequently, mean
precipitation increased due to deforestation32. However, these impacts of deforestation were further enhanced during El Niño years15,30,31. Supplementary Table 2 shows the decrease of
evapotranspiration in response to deforestation during El Niño was 1.22 mm day−1, which was larger than the decrease observed during La Niña (−1.04 mm day−1). This intensified decrease in
evapotranspiration during El Niño years also resulted in a more pronounced increase in surface warming (3.75 °C). This, in turn, led to greater low-level moisture convergence, potentially
creating a more unstable atmospheric environment. This could be a contributing factor to the increased precipitation responses due to deforestation during El Niño years (0.37 mm day−1)
compared to La Niña years (0.06 mm day−1). On the other hand, in the control run, precipitation was already lower in El Niño years (9.68 mm day−1) than in La Niña years (11.08 mm day−1).
With the intensified increase in precipitation due to deforestation during El Niño years (0.37 mm day−1), the interannual variation of precipitation declined in the deforestation run (−1.09
mm day−1). Our findings reveal the responses of evapotranspiration and precipitation to an idealized deforestation scenario in the context of climatic phenomena like ENSO. Further research
is needed to assess the broader role of forests in hydrological processes to develop sustainable strategies for mitigating the potential impacts of deforestation on local water cycles.
DISCUSSION The precipitation anomalies in the MC resulting from ENSO exhibit seasonality (Supplementary Fig. 5b–e). During the ENSO developing stage, precipitation decreased in El Niño
compared to La Niña across the entire MC (Supplementary Fig. 5b, c). Supplementary Fig. 6a, b shows our overall findings of the dampening effects remain consistent during these two seasons.
Moreover, precipitation responses during ENSO peak and decaying seasons33,34 showed spatial heterogeneity (Supplementary Fig. 5d, e). Analyzing the spatial pattern of evapotranspiration and
its components in DJF (December–January–February) and MAM (March–April–May), we observe the dampening effect throughout the MC but with an opposite sign. In regions where precipitation
decreased during El Niño compared to La Niña (i.e., northeastern Borneo and western New Guinea; Supplementary Fig. 5d, e), ERA5 data generally showed a corresponding decrease in canopy
evaporation (Supplementary Fig. 5s, t) and an increase in canopy transpiration (Supplementary Fig. 5n, o). Conversely, southwestern Borneo and Sumatra experienced increased precipitation
during El Niño compared to La Niña, also exhibiting a dampening effect but with an opposite sign. In these regions, the decrease in canopy transpiration compensated for the increase in
canopy evaporation (Supplementary Fig. 5n, o, s, t), also leading to a minor variation in evapotranspiration (Supplementary Fig. 5i, j). These findings were further corroborated by the GLEAM
data, as shown in Supplementary Figs. 6 and 7. Therefore, the spatially heterogeneous changes in precipitation may weaken the overall results when considering the dampening effect across
the entire MC in DJF and MAM. Specifically, the differences of each variable were generally small during these two seasons (bars in Supplementary Fig. 6c, d). Nevertheless, the dampening
effect remained observable, where the decrease in canopy evaporation was compensated by an increase in transpiration. Spatial heterogeneity in precipitation differences (El Niño minus La
Niña) was also evident in both the CRUv7 and GSWP3 atmospheric forcing datasets, as well as in our fully coupled model control simulations (Supplementary Figs. 8a–e, 9a–e and 10a–e). The
simulations demonstrated that regions with decreased (increased) precipitation differences also exhibited corresponding decreased (increased) canopy evaporation differences, and the opposite
changes in transpiration differences. This leads to minor variations in evapotranspiration (Supplementary Figs. 8–10). However, certain grid cells displayed exceptions where changes in
canopy evaporation were not offset by transpiration. Given the heterogeneity of precipitation responses across different areas of the MC, we further introduce the coefficient of variation
(cv)35, calculated as the ratio of standard deviation to mean, as a representation of interannual variability in evapotranspiration. Our analysis revealed that the cv increased after
deforestation in nearly every part of the MC (Supplementary Fig. 11), suggesting a raised interannual variance of evapotranspiration in the deforestation run. These amplified variances can
be attributed to the lack of transpiration’s dampening effect in the deforestation run. Despite varying signs of the dampening effect in southwestern Borneo and Sumatra during DJF and MAM,
deforestation consistently led to an increase in the variance of evapotranspiration across the MC. After confirming the presence of the dampening effect across all seasons, we endeavor to
provide a comprehensive perspective on the effect. Canopy transpiration can dampen the interannual variation of evapotranspiration by releasing more (less) water from land to the atmosphere
through the canopy in dry (wet) years. This phenomenon occurs due to a large amount of soil moisture available, allowing plants to sustain photosynthesis and transpiration even under
relatively dry conditions, or El Niño years, and vice versa for La Niña years. The same idea can also be applied on a seasonal time scale. Studies across different rainforest sites in MC
have shown that deep root systems in rainforests can access water from deeper soil layers, aiding their ability to survive prolonged dry seasons or drought events12,36. Similarly, the same
characteristics of the compensation between canopy evaporation and transpiration and the small variance of evapotranspiration can be observed in the Amazon37,38. Additionally, previous
studies have addressed the effect across different species in different climate zones7,39. In temperate areas, evapotranspiration in crops40 and temperate deciduous forests41 exhibited
relatively smaller interannual variability compared to the variability of precipitation. This phenomenon is attributed to greater canopy transpiration and soil evaporation associated with
high radiation and atmospheric vapor deficit during dry years, which compensates for reduced canopy interception losses41. This study specifically seeks to emphasize the importance of MC
rainforests in stabilizing evapotranspiration for the following reasons. Firstly, the compensatory relationship between canopy evaporation and transpiration is not seen in other species with
shallower root systems, particularly during dry periods36,42. Secondly, deforestation in MC rainforests has increased in recent decades16,17. These factors necessitate an exploration of the
potential changes in interannual evapotranspiration and precipitation variation resulting from increasing human activities and land use changes. While the focus of this study is on MC, it
is worth noting that the Amazon rainforest and other tropical land regions, with their vast biodiversity, also deserve future investigation. CONCLUSIONS We observed a weak interannual
variation of evapotranspiration in the forests of MC despite the vigorous variation of precipitation with ENSO. Analysis of reanalysis data and model output revealed that the smaller
interannual variation is due to the biophysical characteristics of rainforests. During El Niño, when precipitation was lower than the climatology in the MC, canopy evaporation decreased due
to less interception, while canopy transpiration increased in response to increased incoming solar radiation, and the opposite occurred with La Niña. The compensating effect between canopy
evaporation and transpiration of the rainforest dampens the interannual variation of evapotranspiration. This result is further supported by in situ rainforest data in Southern Vietnam,
which showed that El Niño years had more evapotranspiration than La Niña years14. To assess the role of forests in the local water cycle, we carried out idealized experiments in which we
removed all trees in the MC. This was achieved by replacing rainforests with bare soil, thereby eliminating the dampening effects of transpiration. Prior to deforestation, the variation of
evapotranspiration related to ENSO was small, as rainforests had a self-compensating mechanism among different evapotranspiration components. However, after deforestation, the interannual
variation of evapotranspiration was amplified and more closely followed the variation of precipitation. The statistical analysis of cv further confirmed the increased interannual variance of
evapotranspiration without forests (Supplementary Fig. 11a, f, k). This decrease in mean evapotranspiration and increase in its interannual variation further impacted the local hydrological
cycle, resulting in increased mean but decreased interannual variation of precipitation. Although our experiments are idealized, we have demonstrated the potential threat of MC
deforestation on the mean changes in local evapotranspiration and precipitation, as well as their interannual variation. These alterations will have additional effects on the local
hydrological cycle. Further studies should explore changes in runoff or soil water storage to investigate the local water and energy cycles. To accurately assess the impacts of deforestation
on the local hydrological cycle in terms of long-term changes and interannual variations, a realistic deforestation scenario should be considered in future work. DATA, METHOD, AND
EXPERIMENTS GPCC (GLOBAL PRECIPITATION CLIMATOLOGY CENTRE) GPCC18,19 is a monthly precipitation dataset based on quality-controlled global stations. It is used to calculate the annual mean
precipitation. The spatial resolution used is 0.25 by 0.25 degree and the period covers from 1981 to 2014. ENSO’s peak season is during the boreal winter, so we define a year as starting
from June and ending in May of the following year. The data used here is from June of 1981 to May of 2014 (33 years). For more information and data, interested readers can refer to
https://psl.noaa.gov/data/gridded/data.gpcc.html. ERA5-LAND (THE EUROPEAN CENTRE FOR MEDIUM-RANGE WEATHER FORECASTS REANALYSIS V5 LAND DATA) ERA5-land20,21 is the replayed land component of
ERA5, which is the fifth generation of atmospheric reanalysis data provided by ECMWF. The H-TESSEL (the hydrology tiled ECMWF scheme for surface exchanges over land) land surface model is
forced by the meteorological fields of ERA5 and produces ERA5-land with the finer spatial resolution (~9 km, 0.1 by 0.1 degree) land surface variables. The data used in this analysis is
monthly data from June 1981 to May 2014. For additional information and to download the data, readers are referred to the following website
https://cds.climate.copernicus.eu/cdsapp#!/dataset/10.24381/cds.68d2bb30?tab=overview. GLEAM (THE GLOBAL LAND EVAPORATION AMSTERDAM MODEL) GLEAM22,23 provides estimated land variables based
on a set of algorithms. Each variable (i.e., evaporation, transpiration, and bare-soil evaporation) is separately estimated using the Priestley and Taylor evaporation equation based on
observed atmospheric near-surface air temperature and surface net radiation field. The version we used is 3.5a. The spatial resolution is 0.25 by 0.25 degree and the period is from June of
1981 to May of 2014. The data are available on https://www.gleam.eu/. CESM2 PICONTROL (CESM2-PIC) The Coupled Model Intercomparison Project Phase 6 (CMIP6) CESM2-piC is a fully coupled model
simulation of pre-industrial conditions. The model components utilized for the CESM2-piC simulation are Community Atmosphere Model version 6 (CAM6) for atmosphere and Community Land Model
version 5 (CLM5) for land, with a resolution of 0.9 degrees in latitude, 1.25 degrees in longitude, and 32 vertical levels. Parallel Ocean Program, version 2 (POP2) is used for the ocean
component with a resolution of 1° in both latitude and longitude and 60 vertical levels. Data from June of the first modeling year to May of the 1200th modeling year (1199 years) is used.
Further information on this simulation can be obtained through https://www.wdc-climate.de/ui/cmip6?input=CMIP6.CMIP.NCAR.CESM2.piControl) and the data are available on
https://esgf-node.llnl.gov/search/cmip6/. CESM1 LARGE ENSEMBLE (CESM1-LE) CESM1-LE24 provides forty fully coupled simulations. In our analysis, we utilized only 35 of these members
(001-035), which were conducted at NCAR (National Center for Atmospheric Research). The components used for the members are Community Atmosphere Model version 5 (CAM5) for the atmosphere,
Community Land Model version 4 (CLM4) for land, and POP2 for the ocean. The simulation period is 1920-2100, with monthly data from June 1920 to May 2005 being used to avoid the effects of
global warming. The data are available on https://www.earthsystemgrid.org/. THE SELECTION OF ENSO CASES We used the Oceanic Niño Index (ONI) to define ENSO cases. An El Niño case was
identified when the 3-month running averaged NINO3.4 (5°N–5°S, 120–170°W) sea surface temperature anomaly (removing its climatology) was at or above 0.5 °C for five or more consecutive
months. On the other hand, a La Niña case was identified if the index was at or below −0.5 °C. For GPCC, ERA5-land, GLEAM, and our offline model simulations, we used the ENSO years
identified on the website (https://ggweather.com/enso/oni.htm) to ensure consistency across all datasets and our simulations. These included El Niño years 1982, 1986, 1987, 1991, 1994, 1997,
2002, 2004, 2006, and 2009, and La Niña years 1983, 1984, 1988, 1995, 1998, 1999, 2000, 2005, 2007, 2008, 2010, and 2011. We applied the same method with a 0.7 standard deviation as a
threshold43 on fully coupled model outputs (i.e., CESM2-piC, CESM1-LE, and our idealized fully coupled model simulations). For a period of 1199 years in the CESM2-piC dataset, we selected
306 El Niño and 305 La Niña events. In the CESM1-LE dataset, there were 35 members, each with between 11–17 El Niño and 11–19 La Niña events. In the forty idealized paired simulations
utilizing the CESM2 fully coupled model, we selected 10 El Niño and 12 La Niña events/members. The ONI index of these members was calculated based on the full period (1200 years) of the
CESM2-piC output. Any members whose ONI met the criteria mentioned above were categorized as an ENSO event/member. In addition, the two-tailed student t-test was applied when comparing the
differences in variables (i.e., precipitation, evapotranspiration, canopy evaporation/transpiration, or soil evaporation) between El Niño and La Niña. CESM OFFLINE LAND MODEL EXPERIMENTS The
model used here is the CESM CLM4 with some modifications. The CLM4 has been reported to overestimate evapotranspiration mainly from soil evaporation27. We corrected this bias by applying
the dry surface layer (DSL) based soil resistance expression instead of the existing CLM soil resistance parameterization. The modified CESM CLM4 was driven by two atmospheric forcing
datasets [i.e., the Climatic Research Unit version 7 (CRUv7) and the Global Soil Wetness Project Phase 3 (GSWP3)]. The CRUv7 dataset is an atmospheric forcing data for the CLM28, combining
the CRU time series version 3.224 monthly data (1901–2002) and the NCEP (National Centers for Environmental Prediction) reanalysis 6-hourly data (1948–2016) with 0.5° × 0.5° spatial
resolution and 6-hourly temporal resolution from 1971 to 2016. The GSWP3 version 1 data is a downscaling atmospheric dataset based on the Twentieth Century Reanalysis data44 and has a
spatial resolution of 0.5° × 0.5° and a temporal resolution of 3-hourly from 1971 to 201429. The atmospheric forcings used to drive the modified CLM4 were precipitation, solar radiation,
temperature, wind, specific humidity, pressure, and incident longwave radiation. The period of both datasets utilized in this analysis was from June of 1981 to May of 2014. We conducted two
simulations for each forcing: a control, and a deforestation run. In the control simulation, we employed the default Plant Functional Types (PFT). In the deforestation run, the PFT is set to
bare soil only within the MC (green area in Supplementary Fig. 2) to amplify the changes of canopy transpiration’s dampening effects. Altogether, four simulations were conducted. Chiang31
suggested an upward motion anomaly associated with La Niña existed west of 140°E (see their Fig. 2b). To reduce the spatial inconsistency of ENSO on the precipitation response in MC, we
deforested MC from 90° to 140°E. CESM2 FULLY COUPLED MODEL ENSEMBLE EXPERIMENTS We utilized experiments conducted by Chiang31 to compare the impacts of deforestation on local
hydroclimatology. Chiang31 employed forty paired control and deforestation simulations with the CESM2 fully coupled model, which was constructed using the same components as the CESM2-piC.
Chiang31 selected 40 different starting points in the CESM2-piC to initiate the fully coupled model; for more details about the selection of the starting points, please refer to Chiang31. To
minimize the effects of ocean dynamics on the global climate between the control and deforestation runs, the simulation was conducted for 1 year. The 1-year period was not a traditional
calendar year; instead, it was defined from June to May of the following year to coincide with the peak phases of El Niño-Southern Oscillation (ENSO) during the boreal winter. This
experimental design allowed for rapid ocean feedback in response to MC deforestation, while not significantly altering the mean state between the control and deforestation runs.
Additionally, the forty members of the 1-year paired simulations helped to reduce the effect of the model’s internal variability on our results. DATA AVAILABILITY A comprehensive dataset
comprising observation data (https://psl.noaa.gov/data/gridded/data.gpcc.html), ERA5-land (https://cds.climate.copernicus.eu/cdsapp#!/dataset/10.24381/cds.68d2bb30?tab=overview), GLEAM
(https://www.gleam.eu/), CESM2 piControl (https://www.wdc-climate.de/ui/cmip6?input=CMIP6.CMIP.NCAR.CESM2.piControl), and CESM1 large ensemble datasets (https://www.earthsystemgrid.org/) is
available online. Processed data, including area-averaged variables within the study area for each dataset, can be accessed at https://zenodo.org/record/8352453. Please note that we do not
provide the raw output of our simulations on Zenodo due to storage limitations, but the processed data are accessible at the same link, https://zenodo.org/record/8352453. CODE AVAILABILITY
All the codes for the data processing, figures, and tables can be downloaded in https://zenodo.org/record/8352453. REFERENCES * Oki, T. & Kanae, S. Global hydrological cycles and world
water resources. _Science._ 313, 1068–1072 (2006). Article CAS Google Scholar * Trenberth, K. E., Smith, L., Qian, T., Dai, A. & Fasullo, J. Estimates of the global water budget and
its annual cycle using observational and model data. _J. Hydrometeorol._ 8, 758–769 (2007). Article Google Scholar * Jung, M. et al. Recent decline in the global land evapotranspiration
trend due to limited moisture supply. _Nature_ 467, 951–954 (2010). Article CAS Google Scholar * Miralles, D. G., DeJeu, R. A. M., Gash, J. H., Holmes, T. R. H., & Dolman, A. J.
Magnitude and variability of land evaporation and its components at the global scale. _Hydrol. Earth Syst. Sci._ 15, 967–981 (2011). Article Google Scholar * van der Ent, R. J.,
Wang-Erlandsson, L., Keys, P. W. & Savenije, H. H. G. Contrasting roles of interception and transpiration in the hydrological cycle—part 2: moisture recycling. _Earth Syst. Dynam._ 5,
471–489 (2014). Article Google Scholar * Dong, B. & Dai, A. The uncertainties and causes of the recent changes in global evapotranspiration from 1982 to 2010. _Clim. Dyn._ 49, 279–296
(2017). Article Google Scholar * Zhang, Y. et al. Global variation of transpiration and soil evaporation and the role of their major climate drivers. _J. Geophys. Res. Atmos._ 122,
6868–6881 (2017). Article Google Scholar * Martens, B., Waegeman, W., Dorigo, W. A., Verhoest, N. E. C. & Miralles, D. G. Terrestrial evaporation response to modes of climate
variability. _npj Clim. Atmos. Sci._ 1, 43 (2018). Article Google Scholar * Bosilovich, M. G., Robertson, F. R. & Stackhouse, P. W. El Niño-related tropical land surface water and
energy response in MERRA-2. _J. Clim._ 33, 1155–1176 (2020). Article Google Scholar * Le, T. & Bae, D.-H. Response of global evaporation to major climate modes in historical and future
Coupled Model Intercomparison Project Phase 5 simulations. _Hydrol. Earth Syst. Sci._ 24, 1131–1143 (2020). Article Google Scholar * Kume, T. et al. Ten-year evapotranspiration estimates
in a Bornean tropical rainforest. _Agric. For. Meteorol._ 151, 1183–1192 (2011). Article Google Scholar * Kosugi, Y. et al. Effect of inter-annual climate variability on evapotranspiration
and canopy CO2 exchange of a tropical rainforest in Peninsular Malaysia. _J. For. Res._ 17, 227–240 (2012). Article CAS Google Scholar * Broedel, E., Tomasella, J., Cândido, L. A. &
von Randow, C. Deep soil water dynamics in an undisturbed primary forest in central Amazonia: differences between normal years and the 2005 drought. _Hydrol. Process._ 31, 1749–1759 (2017).
Article Google Scholar * Luong, V. V. Effects of ENSO and climate change on reference evapotranspiration in Southern Vietnam. _J. Meteorol. Res._ 35, 868–881 (2021). Article Google
Scholar * Lee, T. H. & Lo, M. H. The role of El Niño in modulating the effects of deforestation in the Maritime Continent. _Environ. Res. Lett_. 16, 54056 (2021). * Hansen, M. C. et al.
High-resolution global maps of 21st-century forest cover change. _Science._ 342, 850–853 (2013). Article CAS Google Scholar * Huang, S. & Oey, L. Malay Archipelago forest loss to
cash crops and urban expansion contributes to weaken the Asian Summer Monsoon: an atmospheric modeling study. _J. Clim._ 32, 3189–3205 (2019). Article Google Scholar * Becker, A. et al. A
description of the global land-surface precipitation data products of the Global Precipitation Climatology Centre with sample applications including centennial (trend) analysis from
1901–present. _Earth Syst_. _Sci. Data_ 5, 71–99 (2013). Google Scholar * Schneider, U., Becker, A., Finger, P., Meyer-Christoffer, A. & Ziese, M. GPCC Full Data Monthly Product Version
2018 at 0.25°: Monthly Land-Surface Precipitation from Rain-Gauges built on GTS-based and Historical Data. https://doi.org/10.5676/DWD_GPCC/FD_M_V2018_025 (2018). * Muñoz-Sabater, J.
ERA5-Land monthly averaged data from 1981 to present, Copernicus Climate Change Service (C3S) Climate Data Store (CDS).
https://cds.climate.copernicus.eu/cdsapp#!/dataset/10.24381/cds.68d2bb30?tab=overview (2019). * Muñoz-Sabater, J. et al. ERA5-Land: a state-of-the-art global reanalysis dataset for land
applications. _Earth Syst. Sci. Data_ 13, 4349–4383 (2021). Article Google Scholar * Miralles, D. G. et al. Global land-surface evaporation estimated from satellite-based observations.
_Hydrol. Earth Syst. Sci._ 15, 453–469 (2011). Article Google Scholar * Martens, B. et al. GLEAM v3: satellite-based land evaporation and root-zone soil moisture. _Geosci. Model Dev._ 10,
1903–1925 (2018). Article Google Scholar * Kay, J. E. et al. The Community Earth System Model (CESM) Large Ensemble Project: a community resource for studying climate change in the
presence of internal climate variability. _Bull. Am. Meteorol. Soc._ 96, 1333–1349 (2015). Article Google Scholar * Oleson, W. B. et al. Technical Description of version 4.0 of the
Community Land Model (CLM). (2010). * Fatichi, S. & Ivanov, V. Y. Interannual variability of evapotranspiration and vegetation productivity. _Water Resour. Res._ 50, 3275–3294 (2014).
Article Google Scholar * Swenson, S. C. & Lawrence, D. M. Assessing a dry surface layer-based soil resistance parameterization for the Community Land Model using GRACE and FLUXNET-MTE
data. _J. Geophys. Res. Atmos._ 119, 10,210–299,312 (2014). Article Google Scholar * Viovy, N. CRUNCEP Version 7—Atmospheric Forcing Data for the Community Land Model.
https://doi.org/10.5065/PZ8F-F017 (2018). * Kim, H. Global Soil Wetness Project Phase 3. http://hydro.iis.u-tokyo.ac.jp/GSWP3/ (2014). * Chiang, C.-L., Lee, T.-H. & Lo, M.-H. The roles
of different ENSO phases in the deforestation induced precipitation increases over the Maritime Continent: an analysis of NCAR CESM. _Atmos. Sci._ 50
https://www.asjmsrc.org/uploads/1/1/9/2/119209495/50-2.pdf (2022). * Chiang, C. L. _Mean-States Dependence of Deforestation Induced Precipitation Changes in the Maritime Continent_. Master’s
thesis, National Taiwan University (2023). * Chen, C.-C. et al. Thermodynamic and dynamic responses to deforestation in the Maritime Continent: a modeling study. _J. Clim._ 32, 3505–3527
(2019). Article Google Scholar * Juneng, L. & Tangang, F. T. Evolution of ENSO-related rainfall anomalies in Southeast Asia region and its relationship with atmosphere–ocean variations
in Indo-Pacific sector. _Clim. Dyn._ 25, 337–350 (2005). Article Google Scholar * Jiang, L. & Li, T. Why rainfall response to El Niño over Maritime Continent is weaker and non-uniform
in boreal winter than in boreal summer. _Clim. Dyn._ 51, 1465–1483 (2018). Article Google Scholar * Phillips, N. & Oren, R. Intra- and inter-annual variation in transpiration of a
pine forest. _Ecol. Appl._ 11, 385–396 (2001). Article Google Scholar * Kume, T. et al. Impact of soil drought on sap flow and water status of evergreen trees in a tropical monsoon forest
in northern Thailand. _For. Ecol. Manage._ 238, 220–230 (2007). Article Google Scholar * da Rocha, H. R. et al. Patterns of water and heat flux across a biome gradient from tropical forest
to savanna in Brazil. _J. Geophys. Res_. _Biogeosci._ 114, D20 (2009). * Maeda, E. E. et al. Evapotranspiration seasonality across the Amazon Basin. _Earth Syst. Dyn._ 8, 439–454 (2017).
Article Google Scholar * Zhang, Y. et al. Multi-decadal trends in global terrestrial evapotranspiration and its components. _Sci. Rep._ 6, 19124 (2016). Article CAS Google Scholar * Hu,
X. & Lei, H. Evapotranspiration partitioning and its interannual variability over a winter wheat-summer maize rotation system in the North China Plain. _Agric. For. Meteorol._ 310,
108635 (2021). Article Google Scholar * Oishi, A. C., Oren, R., Novick, K. A., Palmroth, S. & Katul, G. G. Interannual invariability of forest evapotranspiration and its consequence to
water flow downstream. _Ecosystems_ 13, 421–436 (2010). Article Google Scholar * Tanaka, N. et al. A review of evapotranspiration estimates from tropical forests in Thailand and adjacent
regions. _Agric. For. Meteorol._ 148, 807–819 (2008). Article Google Scholar * Fang, S. W. & Yu, J. Y. Contrasting transition complexity between El Niño and La Niña: observations and
CMIP5/6 models. _Geophys. Res. Lett._ 47, e2020GL088926 (2020). Article Google Scholar * Compo, G. P. et al. The Twentieth Century Reanalysis Project. _Q. J. R. Meteorol. Soc._ 137, 1–28
(2011). Article Google Scholar Download references ACKNOWLEDGEMENTS This study was supported by the MOST 110-2628-M-002-004-MY4 to National Taiwan University. We would like to acknowledge
National Center for High-performance Computing (NCHC) of National Applied Research Laboratories (NARLabs) in Taiwan. AUTHOR INFORMATION Author notes * Yan-Ning Kuo Present address:
Department of Earth and Atmospheric Sciences, Cornell University, Ithaca, NY, USA AUTHORS AND AFFILIATIONS * Department of Atmospheric Sciences, National Taiwan University, Taipei, Taiwan
Ting-Hui Lee, Min-Hui Lo, Chun-Lien Chiang & Yan-Ning Kuo Authors * Ting-Hui Lee View author publications You can also search for this author inPubMed Google Scholar * Min-Hui Lo View
author publications You can also search for this author inPubMed Google Scholar * Chun-Lien Chiang View author publications You can also search for this author inPubMed Google Scholar *
Yan-Ning Kuo View author publications You can also search for this author inPubMed Google Scholar CONTRIBUTIONS T.H.L. designed and conducted the simulations. T.H.L. also performed the data
analysis and contributed to the writing. M.H.L. conceived the study, designed the experiments, and contributed to the writing. C.L.C. designed and conducted the experiments. Y.N.K.
contributed to the writing. All authors contributed to the interpretation of the results. CORRESPONDING AUTHOR Correspondence to Min-Hui Lo. ETHICS DECLARATIONS COMPETING INTERESTS M.H.L. is
an Editorial Board Member for Communications Earth & Environment, but was not involved in the editorial review of, nor the decision to publish this article. The authors declare no
competing interests. PEER REVIEW PEER REVIEW INFORMATION _Communications Earth & Environment_ thanks the anonymous reviewers for their contribution to the peer review of this work.
Primary Handling Editor: Aliénor Lavergne. A peer review file is available. ADDITIONAL INFORMATION PUBLISHER’S NOTE Springer Nature remains neutral with regard to jurisdictional claims in
published maps and institutional affiliations. SUPPLEMENTARY INFORMATION SUPPLEMENTARY INFORMATION PEER REVIEW FILE RIGHTS AND PERMISSIONS OPEN ACCESS This article is licensed under a
Creative Commons Attribution 4.0 International License, which permits use, sharing, adaptation, distribution and reproduction in any medium or format, as long as you give appropriate credit
to the original author(s) and the source, provide a link to the Creative Commons license, and indicate if changes were made. The images or other third party material in this article are
included in the article’s Creative Commons license, unless indicated otherwise in a credit line to the material. If material is not included in the article’s Creative Commons license and
your intended use is not permitted by statutory regulation or exceeds the permitted use, you will need to obtain permission directly from the copyright holder. To view a copy of this
license, visit http://creativecommons.org/licenses/by/4.0/. Reprints and permissions ABOUT THIS ARTICLE CITE THIS ARTICLE Lee, TH., Lo, MH., Chiang, CL. _et al._ The maritime continent’s
rainforests modulate the local interannual evapotranspiration variability. _Commun Earth Environ_ 4, 482 (2023). https://doi.org/10.1038/s43247-023-01126-4 Download citation * Received: 12
June 2023 * Accepted: 20 November 2023 * Published: 15 December 2023 * DOI: https://doi.org/10.1038/s43247-023-01126-4 SHARE THIS ARTICLE Anyone you share the following link with will be
able to read this content: Get shareable link Sorry, a shareable link is not currently available for this article. Copy to clipboard Provided by the Springer Nature SharedIt content-sharing
initiative