- Select a language for the TTS:
- UK English Female
- UK English Male
- US English Female
- US English Male
- Australian Female
- Australian Male
- Language selected: (auto detect) - EN
Play all audios:
ABSTRACT Past East Asian Monsoon variability has been reconstructed using oxygen isotopes of cave speleothems as well as proxy indicators from Chinese loess sequences. However, where the
speleothem record is dominated by precession cycles, loess magnetic susceptibility primarily shows a glacial-interglacial pattern. Here we generate a ~ 130,000 years high resolution record
of plant wax hydrogen isotopes from a loess section on the western Chinese Loess Plateau that can directly be compared with both speleothem oxygen isotopes and with magnetic susceptibility
from the same section. We find that variations in our plant wax hydrogen isotope record follow the precessional pattern of the speleothem record as opposed to the glacial-interglacial
changes in magnetic susceptibility. We propose that hydrogen isotopes mainly record precipitation during the growing season, whereas magnetic susceptibility represents an annual climate
signal, including precipitation and temperature. Our findings imply that summer vs annual climate variability is driven by distinct orbital forcings. SIMILAR CONTENT BEING VIEWED BY OTHERS
MOISTURE VARIABILITY IN NORTHEAST TIBET FOLLOWING THE MIDDLE MIOCENE CLIMATE TRANSITION Article Open access 03 October 2024 VARIATIONS IN TRIPLE OXYGEN ISOTOPE OF SPELEOTHEMS FROM THE ASIAN
MONSOON REGION REVEAL MOISTURE SOURCES OVER THE PAST 300 YEARS Article Open access 18 October 2023 CENTRAL EUROPEAN WARM PHASES RECORDED BY EPISODIC SPELEOTHEM GROWTH DURING MIS 3 Article
Open access 20 November 2024 INTRODUCTION The East Asian Monsoon (EAM) is one of the world’s strongest climate systems and controls the water supply to over one-third of the global
population1. It is composed of the East Asian Summer Monsoon (EASM) that dominates during interglacial periods and transports moisture and heat from the low-latitude oceans towards northern
China, and the East Asian Winter Monsoon (EAWM) that dominates during glacial periods and is characterized by cold, dry Siberian air moving southward2. The EASM variability is recorded in
the oxygen isotopes (δ18O) of Chinese cave speleothems, where low values reflect periods of a more intense EASM2,3,4,5. Speleothems from the Hulu and Sanbao caves have provided a
high-resolution, well-dated record of EASM variability over the last 640 thousand years (kyr). This record is dominated by a strong precession signal (23 kyr cycle), which has been explained
by the EASM strength being mainly driven by Northern Hemisphere (NH) summer insolation2,3,5. However, it has also been argued that the changes in the speleothem δ18O record contain an
annual signal or contributions from the Indian Summer Monsoon6,7,8, or are rather forced by insolation variations at low-latitudes (30°N-30°S)9,10, where temperature gradients between land
and sea, and between hemispheres drive the position of the Inter-Tropical Convergence Zone (ITCZ) and monsoon rainfall9,11. The latter scenario would also explain the absence of a clear
signal of NH ice sheet changes in the speleothem records. Regardless, the presence of abrupt variations in the speleothem record coinciding with Heinrich (H) events does indicate an imprint
of high-latitude climate dynamics on the EASM on sub-orbital timescales2,3,5. Past variation in EASM intensity has also been inferred from many proxy records from Chinese loess sequences,
where alternating layers of loess and paleosols represent periods with a dominating winter (glacials) and summer (interglacials) monsoon, respectively12,13. The loess layers are
characterized by larger grain size (GS) and lower magnetic susceptibility (MagSus), whereas the paleosol layers have smaller GS and higher MagSus. MagSus is traditionally used as a proxy for
the intensity of the EASM which delivers ~80% of the precipitation to the Chinese Loess Plateau (CLP), assuming that MagSus increases during pedogenesis under warmer and wetter conditions
prevailing during the summer monsoon season14,15. Similarly, GS is generally used as a proxy for the strength of the EAWM linked through wind intensity12. Interestingly, MagSus records from
the CLP show a dominant 100 kyr cycle related to the glacial-interglacial variability, which is not recorded by the speleothem δ18O records, whereas both proxies are generally interpreted as
reflecting EASM variation1,2,11. A possible explanation for this discrepancy, known as “the Chinese 100-kyr problem”16, may be that the archives record slightly different aspects of the EAM
climate. Indeed, the exact interpretation of the speleothem δ18O records is still under debate with different explanations posited for the effects of precipitation amount, moisture
composition, moisture source, and pathway17,18,19,20,21,22. In addition, the temperature dependency of calcite/water fractionation of oxygen isotopes can possibly introduce a temperature
overprint on the hydroclimate signal2,23. In this study, we will follow the interpretation of model outputs suggesting that orbital scale variations in the speleothem δ18O records primarily
reflect changes in moisture transport and precipitation amount20, summarized as EASM intensity. Similarly, the MagSus can lose sensitivity to changes in precipitation due to changes in the
loess deposition rate, where high deposition rates may cause a dilution of the MagSus signal, especially during glacial periods with dominating winter monsoon24, and low deposition rates, in
combination with bioturbation, could smoothen out the shorter orbital cycles25,26,27,28. In addition, MagSus only responds to precipitation when the mean annual precipitation is higher than
200 mm/yr and lower than 2200 mm/yr29. Magsus is, next to precipitation, also determined by temperature, as well as soil organic content, carbonate content, type of organic matter and
pH29,30. Multiple studies have attempted to explain the discrepancy in dominant orbital cycles present in speleothem and loess proxy records. For example, a recent study produced a spliced
loess record of MagSus for the interglacials and inversed sand content for the glacials to circumvent the dilution of the MagSus signal during glacials, based on the assumption that
variations in EASM strength are then recorded by sand content, determined by the inverse relation of the EASM with the strength of the winter monsoon that delivers this sand to the CLP27.
Spectral analysis of this record indeed indicated the presence of a dominant 23 kyr cycle, demonstrating that the strong response of EASM to summer insolation is also represented in
loess-paleosol records from the CLP. Notably, another study aimed at solving this same discrepancy found a strong 100 kyr cyclicity in their EASM intensity record that they based on the
carbon isotopic composition of snail shells (δ13Cshell) stored in a loess-paleosol sequence from the central CLP31. They assumed a link between δ13Cshell and that of the δ13C of the
vegetation consumed by the snails, which is controlled by local precipitation and thus mainly the EASM32. Since snail shells are composed of secondary carbonate, they are, therefore,
unaffected by changes in sourcing, pedogenesis, or deposition rate that could alter or smoothen the cyclicities present in the loess record31. The dominance of the 100 kyr cycle in that
record, as also found in those of loess proxies, thus indicates a primary forcing by NH ice volume rather than local summer insolation. However, earlier studies that used the δ13C of
inorganic carbonate (δ13CIC) to reconstruct EASM intensity for two high-resolution loess sequences in the arid northwestern CLP found that these records contain significant 23-, 41-, and 100
kyr cycles, although the latter is most dominant33,34. They linked δ13CIC with vegetation density, which, on the western CLP, is mainly controlled by precipitation, and thus EASM
intensity35, although changes in the mixing ratio of detrital and pedogenic carbonates may also influence δ13CIC33. The same three cycles are also present in the Ca/Ti record from the
western CLP, where this ratio was linked to precipitation-induced leaching intensity associated with summer rainfall36. The distinct cyclicities in each of these proxy records suggests that
they likely reflect different aspects of the EASM, and also record hydrology differently than the δ18O of speleothems, to which they are compared. Thus, the dominant driver of EASM
intensity, as it is recorded in loess-paleosol sequences, remains unclear. We here aim to solve the orbital discrepancy by using hydrogen isotope compositions of plant waxes (δ2Hwax) stored
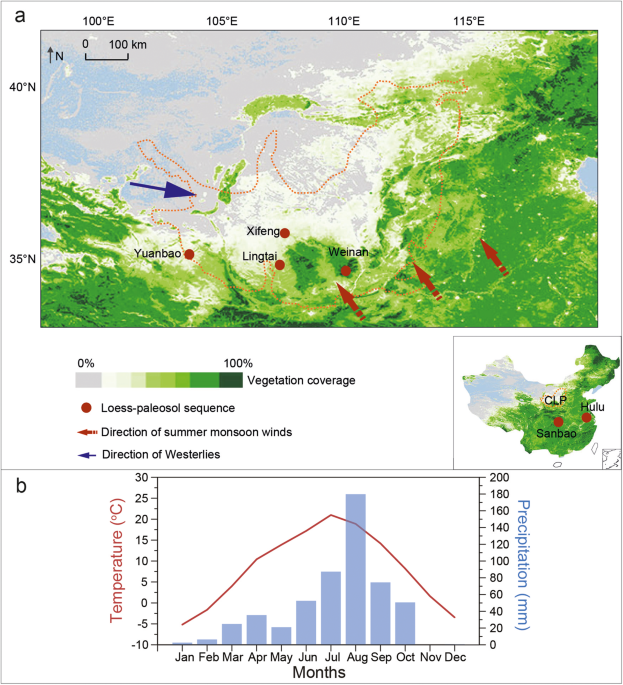
in the Yuanbao section on the western CLP (Fig. 1a) to generate a direct hydrologic record of EASM intensity over the past ~130 kyr. The Yuanbao section is characterized by exceptionally
high deposition rates (5 to 143 cm kyr−1)37 that allows the generation of high resolution records that capture millennial scale events. Since previous studies from the modern CLP have shown
that temperature and evapo-transpiration have a small impact on soil water δ2H in non-desert regions where MAP>400mm38, as is the case in Yuanbao (Fig. 1b) and also shown in the global
monsoonal system39, the δ2Hwax primarily reflects the isotopic composition of meteoric water supplied during plant growth40,41. This allows us to make the comparison of EASM proxy behaviour
between archives, i.e., δ2Hwax vs. speleothem δ18O, as well as between proxies in the same archive, i.e., δ2Hwax vs. MagSus from the same loess section. Subsequent assessment of the orbital
forcings of these proxies should lead to identification of the mechanism(s) resulting in the distinct cyclicities between loess and speleothem-based EASM records. RESULTS AND DISCUSSION THE
YUANBAO Δ2HWAX RECORD The δ2Hwax (compensated for ice-volume induced changes in the global hydrological cycle) ranges from −119‰ to −201‰ (Fig. 2d), where the lowest values occur during
interglacial periods and glacial periods are characterized by less negative δ2Hwax. Since plant waxes are mostly synthesized during the growing season40,41, the δ2Hwax likely represents the
isotopic composition of their main water source during this season, i.e., soil moisture41. On a global scale, the δ2H of plant source water follows that of (amount weighted average) meteoric
water41. Given that ~80% of the precipitation at the CLP falls during summer42, this implies that δ2Hwax at Yuanbao reflects the isotopic composition of EASM associated precipitation, and
should thus vary according to the same processes which control speleothem δ18O. Hence, variations in the plant wax record presumably reflect a combined effect of upstream depletion,
precipitation amount, and atmospheric circulation changes3,20, where lower δ2Hwax values indicate an increased EASM intensity, with more precipitation sourced from the Pacific Ocean, whereas
higher δ2Hwax values indicate less precipitation, derived from more local sources3,20. However, δ2Hwax may also be influenced by vegetation change, as the fractionation of hydrogen isotopes
during leaf wax synthesis differs between vegetation types43. For example, larger fractionation occurs in grasses than in shrubs41, and may thus introduce variations in δ2Hwax independent
of climate. The stable carbon isotopic composition of bulk organic carbon and plant waxes indicates that on part of the CLP, vegetation changed between C3 and C4 plant types over
glacial-interglacial cycles44,45,46,47,48. At Yuanbao, however, the δ13Cwax record only reveals minor scale variation ranging from −30.5‰ to −32.9‰ (Fig. 2e). These values all fall within
the range of C3 plants, likely due to the high elevation of the site (2177 m asl) causing insufficient temperatures for C4 plants to be favoured44,45,49. This indicates that at Yuanbao,
changes in δ2Hwax are primarily caused by changes in precipitation δ2H. The exceptionally high resolution of our record facilitated by the high deposition rate at Yuanbao reveals millennial
scale variations in EASM intensity, in particular during the interval corresponding to Marine Isotope Stage (MIS) 3 (Fig. 2d). The Yuanbao δ2Hwax record clearly shows excursions towards more
positive values at times that match with H events (H2-H6) similarly recognized in the speleothem record (Fig. 2d, f). The imprint of these North Atlantic climate events in the Yuanbao
record suggests that strengthening of the Westerlies as a result of the slowdown of the AMOC reduced the inland penetration of the EASM during these intervals12,50,51, and thus blocked the
delivery of moisture from remote sources and a more negative isotope signal to the CLP. In addition, the glacial conditions reduced sea surface temperatures and the size of the West Pacific
warm pool52, leading to a weakening of the EASM intensity and making way for polar air from high latitudes to reach the CLP. Notably, these millennial scale events are not resolved in other
available δ2Hwax records from the CLP (e.g., Weinan47, Xifeng53,54, Lingtai49; Supplementary Fig. 1), likely due to the lower sedimentation rates on the central and southern CLP, where these
sites are located, introducing a smoothing effect on the record55, or simply by lower sampling resolution. In addition, the trends in the δ2Hwax records from Weinan and Lingtai on the
southern edge of the central CLP are different from those in the Yuanbao record. This can possibly be attributed to contributions of additional moisture sources and/or local recycling that
influenced δ2Hwax at these southern sites47. Indeed, the trends in δ2Hwax recorded at Xifeng that is located further north are more similar to those from Yuanbao, although the resolution of
the latter record remains unprecedented. COMPARISON OF Δ2HWAX WITH SPELEOTHEM Δ18O The δ2Hwax and δ18O speleothem records presumably record the same aspect of hydroclimate, i.e., the
isotopic composition of EASM precipitation driven by changes in moisture transport and precipitation amount5,40,41,56, and are thus expected to show similar behaviour over time. The two
records indeed vary in concert on both precessional and millennial timescales (Figs. 2d, g, 3). The strong similarity between the δ2Hwax and speleothem records thus suggests that the main
driver of their variability is the same. Assuming that δ2Hwax is a growing-season signal, this implies that speleothem δ18O indeed also represents a summer monsoon signal, as previously
suggested based on summer insolation as main driver of the EASM and the fact that the majority of annual precipitation (~80%) falls during summer2,57,58,59. The phase analysis between δ2Hwax
and δ18O shows that both records are in phase during MIS 5, but that δ2Hwax is leading speleothem δ18O during MIS 3 (Supplementary Fig. 2). This could be the result of the low insolation
forcing during that time, giving way to other factors that may influence precipitation isotopes at Yuanbao, such as high-latitude climate variability (shown by the millennial scale H
events), or the distance between the location of the caves and Yuanbao, and possibly the high elevation and the vicinity of Yuanbao to the Tibetan Plateau that can influence the atmospheric
teleconnections bringing EASM precipitation inland. Regardless, in line with the similarities between the records, the main periodicity present in the δ2Hwax record is precession (23 kyr;
Fig. 3). The period from 132-70 ka, corresponding to the last interglacial (MIS 5), also shows half-precessional cycles (Fig. 4), which is something that has so far only been observed in
loess proxy records from the Caotan section, also located on the northwestern part of the CLP60. The presence of half-precession cycles indicates an influence of low-latitude insolation
forcing on the EASM, likely through ocean-atmospheric connections transporting moisture from the West Pacific warm pool to inland China60, where the sea surface temperature of the West
Pacific is highly dependent on both NH and southern hemisphere (SH) summer insolation61. The fact that insolation from spring and autumn equinoxes are out of phase by half a precession cycle
creates this pattern, as there are two insolation maxima in the tropics during one precession cycle62. Half-precessional cycles are also weakly present during 50–20 ka, although they are
below the 95% confidence interval. The expression of these cycles during interglacials can be explained by the amplitude of NH and SH insolation (35° N and 35° S, Fig. 2f), which is higher
during interglacial periods than during glacial periods63. The EASM thus relays low latitude signals from the Pacific to the CLP60,64,65. Furthermore, Sun and Huang (2006) noted that the
speleothem δ18O could record changes in moisture from the Pacific to the Indian Ocean, but that the moisture coming from the Indian Ocean does not reach the CLP due to its position relative
to the Himalayas, which blocks this moisture transport. Instead, changes in δ2Hwax should then show variations in moisture from the South China Sea (related to the Pacific) vs. the West
Pacific warm pool (tropical Pacific), indicating the source of the moisture associated with the half-precessional cycles60. The relative amplitude of glacial-interglacial variability is
minor compared to that in sea level stack and global ice volume records (Fig. 2a). And although the δ2Hwax shows a weak 100 kyr cycle (Fig. 3), this is not significant due to the restricted
length of the record (~130 kyr). This cyclicity could come from an additional sensitivity to NH ice volume that does not directly impact the speleothem record. The changes in the δ2Hwax
record are often abrupt and show a sawtooth pattern that is reversed to that in the global benthic stack, i.e., δ2Hwax can rapidly become more positive during glacial inceptions, whereas the
benthic stack reflects a slow buildup of ice sheets66 (Fig. 2). Similar rapid changes into glacial periods are present in the Yuanbao GS record, suggesting that they could be linked to the
strength of the EAWM, which is closely linked to NH ice volume on orbital timescales67,68. The location and high elevation of Yuanbao relative to that of the caves could explain the higher
sensitivity of δ2Hwax to high-latitude climate forcings compared to that of speleothem δ18O. COMPARISON OF Δ2HWAX RECORD WITH MAGSUS AT YUANBAO The generation of a MagSus record for the
exact same section as used for δ2Hwax analysis allows for a direct comparison of the two records, which are both assumed to reflect EASM intensity. However, the amplitude and trend of the
MagSus record for the Yuanbao section are different from that of the δ2Hwax record, as well as from the δ18O speleothem record (Fig. 2b, d, g). The MagSus record clearly follows the pattern
of a MIS 5e that is higher than 5c which is again higher than 5a, followed by a subsequent maximum during MIS 1 that is typically also seen in sea level (Fig. 2a, b) and thus the structure
of the benthic δ18O stacked record69. This in turn suggests that next to precession, NH ice volume and global climate also exert an influence on the MagSus signal25. Indeed, the MagSus
record contains the expected 23 kyr cycle, however, the 100 kyr cycle is also prominent in this record (Fig. 3). Although this cycle is not significant due to the length of our record,
longer MagSus records from the CLP all contain a prominent 100 kyr signal1,47,67,70. The precession signal may be introduced by the influence of NH summer insolation on EASM intensity that
is recorded by MagSus specifically in the paleosol layers27,33. These layers are presumably well resolved and relatively little impacted by smoothing processes due to the high deposition
rates at Yuanbao37, which facilitates their registration of precession-to-millennial scale EASM intensity signals. Regardless, the MagSus and δ2Hwax records show different trends also within
the paleosol layers representing interglacials (Fig. 2). Given that δ2Hwax mostly records the growing season, any offsets with MagSus are likely introduced during winters, and thus imply
that MagSus represents both summer precipitation and annual temperature signals rather than solely EASM intensity11,16,26. The contribution of an annual temperature signal, and thus the
imprint of the NH ice volume, would then explain the 100 kyr periodicity in the MagSus record. Hence, we suggest that the difference in the MagSus and δ2Hwax records can be explained by the
distinct sensitivity of these two proxies to summer precipitation and annual temperature. CONCLUSIONS Since δ2Hwax is linked to the growing season of the vegetation from which the leaf wax
lipids are derived, the similarities between precession-to-millennial scale variabilities of precipitation isotopes recorded by plant waxes in the Yuanbao section of the CLP and those by
speleothem δ18O indicate that both records reflect a summer signal, i.e., that of EASM intensity. The dominant 23 kyr cyclicity in both records points to NH summer insolation as their main
driver. The additional presence of half-precession cycles in the Yuanbao δ2Hwax record during interglacials indicates that low-latitude insolation forcings reach further north than generally
anticipated. In contrast, MagSus recorded in the same loess section and traditionally also assumed to reflect EASM intensity through precipitation-induced pedogenesis, follows the trends
and amplitude represented in global sea level, implying a strong control of NH ice volume with a prominent 100 kyr cycle. The different amplitude and periodicities in the MagSus record are
thus explained by the contribution of a winter temperature signal, implying that MagSus is recording the effects of both summer precipitation and annual temperature on pedogenesis. The
discrepancy in the main cyclicities between the loess proxies and the water isotopes (δ2Hwax and speleothem δ18O) thus has high potential for distinguishing the orbital and glacial imprints
on EAM variability for further studies. METHODS STUDY SITE Yuanbao is situated on the western part of the CLP at 2177 m above sea level (asl; 35.63°N, 103.17°E, Fig. 1a). The mean annual air
temperature (MAAT) in Linxia, the closest weather station (35.15°N, 103.63°E)37, is 7.3 °C71. This translates into a MAAT of 5.7 °C at the elevation of the sample site (based on a lapse
rate of 0.6 °C 100 m−1) with temperatures of −6.1 °C in winter, and 12.2 °C during the summer growing season (April‒October). The mean annual precipitation (MAP) is 500 mm yr−1 of which 80%
falls between May and September (Fig. 1b)72. The Yuanbao section is characterized by exceptionally high deposition rates (5 to 143 cm kyr−1)37 that enabled the generation of high resolution
records. Samples from the upper 40 m were collected at 5 cm intervals in August 2019 and stored in geochemical sampling bags for transport to the laboratory in Utrecht, where they were
freeze dried and homogenized prior to analysis. MAGNETIC SUSCEPTIBILITY AND GRAIN SIZE ANALYSIS Magnetic susceptibility and grain size were analysed at 5 cm resolution (_n_ = 120) at the
Institute of Earth Environment, Chinese Academy of Sciences37. Low-frequency mass magnetic susceptibility was measured with a Bartington Instruments MS2 meter. After removal of organic
matter (10 ml, 10% H2O2) and carbonate (10 ml, 10% HCl), the grain size distributions were determined using a Malvern 2000 laser diffraction instrument. Measurement uncertainty was <10%
for magnetic susceptibility and <2% for mean grain size. CHRONOLOGY The upper 40 m of the Yuanbao section covers the past ~132 kyr based on the alignment of GS and MagSus to the quartz GS
and MagSus records from the drill core collected at Yuanbao in 201737. The latter GS record was matched with the benthic δ18O record66, selecting tie points to link the loess (L)/paleosol
(S) boundaries to the glacial/interglacial transitions. This method is commonly accepted to establish age-depth models for loess-paleosol sequences from the CLP12,33,37. This age-depth model
was supported by optically stimulated luminescence (OSL) dates from a nearby loess-paleosol sequence73. In short, the S0/L1, L1/S1, S1/L2 boundaries were linked to the transitions of marine
isotope stage (MIS) 1/2 (14 ka), 4/5 (70 ka), 5/6 (132 ka), respectively. Three age control points were additionally chosen to match L1SS1-2 to MIS 3 (27–59 ka). Finally, four additional
tie points were added to link H events in the GS and speleothem δ18O records (Supplementary Fig. 3). This age model was assessed by a phase analysis between Yuanbao GS and speleothem δ18O,
showing that both records are in phase (Supplementary Fig. 4). LIPID BIOMARKER ANALYSIS Long chain _n_-alkanes were extracted (3x) from ~30 g loess (_n_ = 251) with dichloromethane (DCM):
MeOH (9:1, v-v) using a MEX microwave extractor. The total lipid extracts (TLEs) were filtered over a paper filter (Whatman grade 42 Ashless Filter Paper, 55 mm diameter), then dried under
N2. Subsequently, TLEs were split into an apolar and polar fraction over an activated Al2O3 column eluting with hexane:DCM (9:1, v-v) and DCM:MeOH (1:1, v-v), respectively. An internal
standard was added to the apolar fraction, consisting of 64 μL squalane. The apolar fractions, containing the _n_-alkanes, were analysed on a Hewlett Packard gas chromatograph (GC) equipped
with a CP-sil 5CB fused silica column (30 m, 0.32 mm, 0.10 um) coupled to a flame ionization detector (FID). Helium was used as a carrier gas (1 mL/min at constant flow). The GC oven
temperature program was as follows: 70 °C to 130 °C (at 20 °C/min), to 320 °C (at 4 °C/min), at which it was held isothermal for 20 min. The _n_-alkanes were identified and quantified by
using the internal standard, and manual integration of the peak areas using Chemstation software B.04.03. δ2H analyses of _n_-alkanes were conducted on a MAT253 isotope ratio mass
spectrometer (Thermo Fisher Scientific) coupled via a GC IsoLink operated at 1420 °C to a GC (TRACE, Thermo Fisher Scientific) equipped with a PTV injector and a HP-5ms column (30 m, 0.25
mm, 1 μm). Each sample was measured at least in duplicate. δ2H values were calibrated against H2 reference gas of known isotopic composition and are given in ‰ VSMOW (Vienna Standard Mean
Ocean Water). Accuracy and precision were controlled by a lab internal _n_-alkane standard calibrated against the A4-Mix isotope standard (provided by A. Schimmelmann, University of Indiana)
every six measurements and by the daily determination of the H3+ factor. Measurement precision was determined by calculating the difference between the analysed values of each standard
measurement and the long-term mean of standard measurements, which yielded a 1σ error of 3‰. The analytical reproducibility (1-σ standard deviation) of δ2H analyses for the _n_-C29 and
_n_-C31 alkane was 2 and 3‰ VSMOW on average, respectively, with maximum values of 6 (_n_-C29) and 5 (_n_-C31) ‰ VSMOW. H3+ factors varied between 4.9 and 5.2 (mean ± s.d., 5.1 ± 0.1).
Precision (1-σ standard deviation) of the squalane internal standard was 6‰. δ13C analyses of _n_-alkanes were conducted on a MAT252 isotope ratio mass spectrometer (Thermo Fisher
Scientific) coupled via a gas chromatograph-combustion (GC-C) interface with a nickel catalyzer operated at 1000 °C to a GC (Trace, Thermo Fisher Scientific) equipped with a PTV injector and
a HP-5ms column (30 m, 0.25 mm, 0.25 μm). Each sample was measured at least in duplicate if sufficient material was available. δ13C values were calibrated against CO2 reference gas of known
isotopic composition and are given in ‰ VPDB (Vienna Pee Dee Belemnite). Accuracy and precision were determined by measuring _n_-alkane standards calibrated against the A4-Mix isotope
standard every six measurements. The difference between the long-term means and the measured standard values yielded a 1σ error of 0.3‰. The analytical reproducibility (1-σ standard
deviation) of δ13C analyses for the _n_-C29 and _n_-C31 alkane was 0.1‰ VSMOW on average with maximum values of 0.5‰ VSMOW for both compounds. For samples with single analysis, the long-term
precision was assumed as analytical error. Precision (1-σ standard deviation) of the squalane internal standard was 0.2‰. From the detected _n_-alkane distributions and their stable
isotopic composition, records of the hydrogen isotopic composition of meteoric water (δ2Hwax), as well as of vegetation change (δ13Cwax) were generated based on the weighted mean of the
isotopic composition of the most abundant plant waxes (C29 and C31 _n_-alkanes). The δ2Hwax record was corrected for ice volume changes which affect isotopes in the global hydrological cycle
assuming a Last Glacial Maximum change in global δ18O of seawater of 1‰ to scale the benthic δ18O record74,75 and using the following equation: $${\delta
}^{2}{{{{{{\rm{H}}}}}}}_{wax}\,_{ice-corrected}\,=\frac{1000+{\delta }^{2}{{{{{{\rm{H}}}}}}}_{wax}}{8\times 0.001\times {\delta }^{18}{{{{{{\rm{O}}}}}}}_{ice}+1}-1000$$ (1) FREQUENCY
ANALYSIS Frequency analysis was carried out using Acycle 2.3.1 software76, using the periodogram function (default settings; angular frequency of π/4 rad/sample with additive _N_ (0,1) white
noise). The wavelet analysis was also conducted under Acycle 2.3.177 with the following parameters: period range from 1 to 100, pad = 1, discrete scale spacing = 0.1, Mother = Morlet. All
analysed records were standardized and detrended (rLOWESS; Locally Weighted Scatterplot Smoothing). Cross-spectral analyses were performed with the Blackman-Tukey approach using arand-master
software after interpolation to a constant time step of 1 ka. Cross-spectral results are also obtained between precession, ice volume, GHG and East Asian monsoon proxies. The coherency
spectra of East Asian monsoon proxies with ice volume, GHG and precession are compared with the 80% non-zero coherency level, implying different roles of ice volume, summer insolation and
GHG forcing on four proxy records. The following parameters were used to optimize bias/variance properties of spectrum estimates: number of lags = 40 (~1/3 length of record) and samples per
analysis = 120. The phase analysis (wavelet coherence; WTC) was performed in a Monte Carlo framework (_n_ = 1000)78, using the MATLAB code available at
http://grinsted.github.io/wavelet-coherence/. The WTC helps to detect the period in different frequency bands where the two time series co-vary (but does not necessarily have high power).
The black arrows in the figures represent the phase relationship between the two time sequences with rightward, upward and downward arrows indicating in phase, leading phase and lagging
phase, respectively. The color scale indicates the amplitude correlations between the two datasets36. DATA AVAILIBILITY The data set underlying this research is available at
https://doi.pangaea.de/10.1594/PANGAEA.961583. REFERENCES * An, Z. et al. Global monsoon dynamics and climate change. _Annu. Rev. Earth Planet. Sci._ 43, 29–77 (2015). Article CAS Google
Scholar * Wang, Y. J. et al. A high-resolution absolute-dated late pleistocene monsoon record from Hulu Cave, China. _Science_ 294, 2345–2348 (2001). Article CAS Google Scholar * Cheng,
H. et al. The Asian monsoon over the past 640,000 years and ice age terminations. _Nature_ 534, 640–646 (2016). Article CAS Google Scholar * Liu, Z. et al. Chinese cave records and the
East Asia Summer Monsoon. _Quat. Sci. Rev._ 83, 115–128 (2014). Article Google Scholar * Wang, Y. et al. Millennial- and orbital-scale changes in the East Asian monsoon over the past
224,000 years. _Nature_ 451, 1090–1093 (2008). Article CAS Google Scholar * Caley, T., Roche, D. M. & Renssen, H. Orbital Asian summer monsoon dynamics revealed using an
isotope-enabled global climate model. _Nat. Commun._ 5, 5371 (2014). Article CAS Google Scholar * Clemens, S. C., Prell, W. L. & Sun, Y. Orbital-scale timing and mechanisms driving
Late Pleistocene Indo-Asian summer monsoons: Reinterpreting cave speleothem _δ_18O. _Paleoceanography_ 25, PA4207 https://doi.org/10.1029/2010PA001926 (2010). * Baker, A. J., Mattey, D. P.
& Baldini, J. U. L. Reconstructing modern stalagmite growth from cave monitoring, local meteorology, and experimental measurements of dripwater films. _Earth Planet. Sci. Lett._ 392,
239–249 (2014). Article CAS Google Scholar * Kutzbach, J. E. Monsoon climate of the early holocene: climate experiment with the Earth’s orbital parameters for 9000 years ago. _Science_
214, 59–61 (1981). Article CAS Google Scholar * Beck, J. W. et al. A 550,000-year record of East Asian monsoon rainfall from 10Be in loess. _Science_ 360, 877–881 (2018). Article CAS
Google Scholar * Cheng, H. et al. Milankovitch theory and monsoon. _Innovation_ 3, 100338 (2022). Google Scholar * Porter, S. C. & An, Z. Correlation between climate events in the
North Atlantic and China during the last glaciation. _Nature_ 375, 305–308 (1995). Article CAS Google Scholar * An, Z. et al. Asynchronous Holocene optimum of the East Asian monsoon.
_Quat. Sci. Rev._ 19, 743–762 (2000). * An, Z., Kukla, G. J., Porter, S. C. & Xiao, J. Magnetic susceptibility evidence of monsoon variation on the Loess Plateau of central China during
the last 130,000 years. _Quat. Res._ 36, 29–36 (1991). Article Google Scholar * Maher, B. A. & Thompson, R. Mineral magnetic record of the Chinese loess and paleosols. _Geology_ 19,
3–6 (1991). Article Google Scholar * Cheng, H. et al. Orbital-scale Asian summer monsoon variations: paradox and exploration. _Sci. China Earth Sci._ 64, 529–544 (2021). Article Google
Scholar * Maher, B. A. & Thompson, R. Oxygen isotopes from Chinese caves: records not of monsoon rainfall but of circulation regime. _J. Quat. Sci._ 27, 615–624 (2012). Article Google
Scholar * Pausata, F. S. R., Battisti, D. S., Nisancioglu, K. H. & Bitz, C. M. Chinese stalagmite δ18O controlled by changes in the Indian monsoon during a simulated Heinrich event.
_Nat. Geosci._ 4, 474–480 (2011). Article CAS Google Scholar * Gebregiorgis, D. et al. A brief commentary on the interpretation of Chinese Speleothem δ18O records as Summer Monsoon
intensity tracers. _Quaternary_ 3, 7 (2020). Article Google Scholar * Hu, J., Emile‐Geay, J., Tabor, C., Nusbaumer, J. & Partin, J. Deciphering oxygen isotope records from Chinese
Speleothems with an isotope‐enabled climate model. _Paleoceanogr. Paleoclimatology_ 34, 2098–2112 (2019). Article Google Scholar * Zhang et al. The Asian Summer Monsoon: teleconnections
and forcing mechanisms—a review from Chinese Speleothem δ18O records. _Quaternary_ 2, 26 (2019). Article Google Scholar * Zhang, H., Cheng, H., Baker, J. & Kathayat, G. Response to
comments by Daniel Gebregiorgis et al. “A brief commentary on the interpretation of Chinese Speleothem δ18O records as Summer Monsoon intensity tracers”. _Quaternary_ 3, 8 (2020). Article
Google Scholar * Friedman, I. & O’Neil, J. R. Compilation of stable isotope fractionation factors of geochemical interest (Report No. 440KK), Professional Paper.
https://doi.org/10.3133/pp440KK (1977). * Sun, Y. et al. East Asian monsoon variability over the last seven glacial cycles recorded by a loess sequence from the northwestern Chinese Loess
Plateau: East Asian Monsoon Variability. _Geochem. Geophys. Geosyst_. 7, Q12Q02 https://doi.org/10.1029/2006GC001287 (2006). * Lu, H., Zhang, F., Liu, X. & Duce, R. A. Periodicities of
palaeoclimatic variations recorded by loess-paleosol sequences in China. _Quat. Sci. Rev._ 23, 1891–1900 (2004). Article Google Scholar * Nie, J., King, J. W. & Fang, X. Tibetan uplift
intensified the 400 k.y. signal in paleoclimate records at 4 Ma. _Geol. Soc. Am. Bullet._ 120, 1338–1344 (2008). Article Google Scholar * Guo, B. et al. Dominant precessional forcing of
the East Asian summer monsoon since 260 ka. _Geology_. https://doi.org/10.1130/G50206.1 (2022). * Ma, L., Li, Y., Liu, X. & Sun, Y. Registration of precession signal in the last
interglacial paleosol (S1) on the Chinese Loess Plateau. _Geochem. Geophys. Geosyst._ 18, 3964–3975 (2017). Article Google Scholar * Balsam, W. L. et al. Magnetic susceptibility as a proxy
for rainfall: worldwide data from tropical and temperate climate. _Quat. Sci. Rev._ 30, 2732–2744 (2011). Article Google Scholar * Jenny, H. _Factors of Soil Formation_. (McGraw-Hill, New
York, 1941). * Bao, R. et al. 100 k.y. pacing of the East Asian summer monsoon over the past five glacial cycles inferred from land snails. _Geology_ https://doi.org/10.1130/G50243.1
(2023). * Bao, R. et al. Stable carbon and oxygen isotopic composition of modern land snails along a precipitation gradient in the mid-latitude East Asian monsoon region of China.
_Palaeogeogr. Palaeoclimatology Palaeoecol._ 533, 109236 (2019). Article Google Scholar * Sun, Y. et al. Astronomical and glacial forcing of East Asian summer monsoon variability. _Quat.
Sci. Rev._ 115, 132–142 (2015). Article Google Scholar * Sun, Y. et al. Diverse manifestations of the mid-Pleistocene climate transition. _Nat Commun_ 10, 352 (2019). Article CAS Google
Scholar * Liu, W., Yang, H., Sun, Y. & Wang, X. δ13C values of loess total carbonate: a sensitive proxy for Asian summer monsoon in arid northwestern margin of the Chinese loess
plateau. _Chem. Geol._ 284, 317–322 (2011). Article CAS Google Scholar * Guo, F. et al. Greenhouse gases modulate the strength of millennial-scale subtropical rainfall, consistent with
future predictions. _Clim. Past_ 18, 1675–1684 (2022). Article Google Scholar * Guo, F. et al. Monsoon variations inferred from high-resolution geochemical records of the Linxia
loess/paleosol sequence, western Chinese Loess Plateau. _CATENA_ 198, 105019 (2021). Article CAS Google Scholar * Liu, W. et al. Hydrogen isotopic compositions along a precipitation
gradient of Chinese Loess Plateau: critical roles of precipitation/evaporation and vegetation change as controls for leaf wax δD. _Chem. Geol._ 528, 119278 (2019). Article CAS Google
Scholar * Niedermeyer, E. M. et al. The stable hydrogen isotopic composition of sedimentary plant waxes as quantitative proxy for rainfall in the West African Sahel. _Geochim. Cosmochim.
Acta_ 184, 55–70 (2016). Article CAS Google Scholar * Sessions, A. L., Burgoyne, T. W., Schimmelmann, A. & Hayes, J. M. Fractionation of hydrogen isotopes in lipid biosynthesis.
_Organic Geochem._ 30, 1193–1200 (1999). Article CAS Google Scholar * Sachse, D. et al. Molecular paleohydrology: interpreting the hydrogen-isotopic composition of lipid biomarkers from
photosynthesizing organisms. _Annu. Rev. Earth Planet. Sci._ 40, 221–249 (2012). Article CAS Google Scholar * Liu, W. et al. _δ_13C variation of C3 and C4 plants across an Asian monsoon
rainfall gradient in arid northwestern China. _Glob Change Biol._ 11, 1094–1100 (2005). Article Google Scholar * Liu, J. et al. Controls on leaf water hydrogen and oxygen isotopes: a local
investigation across seasons and altitude. _Hydrol. Earth Syst. Sci._ 27, 599–612 (2023). Article CAS Google Scholar * Zhang, Z., Zhao, M., Lu, H. & Faiia, A. M. Lower temperature as
the main cause of C4 plant declines during the glacial periods on the Chinese Loess Plateau. _Earth Planet. Sci. Lett._ 214, 467–481 (2003). Article CAS Google Scholar * Liu, W. et al.
Summer monsoon intensity controls C4/C3 plant abundance during the last 35 ka in the Chinese Loess Plateau: Carbon isotope evidence from bulk organic matter and individual leaf waxes.
_Palaeogeogr. Palaeoclimatology Palaeoecol._ 220, 243–254 (2005). Article Google Scholar * Zhang, Z., Zhao, M., Eglinton, G., Lu, H. & Huang, C. Leaf wax lipids as paleovegetational
and paleoenvironmental proxies for the Chinese Loess Plateau over the last 170kyr. _Quat. Sci. Rev._ 25, 575–594 (2006). Article Google Scholar * Thomas, E. K. et al. Heterodynes dominate
precipitation isotopes in the East Asian monsoon region, reflecting interaction of multiple climate factors. _Earth Planet. Sci. Lett._ 455, 196–206 (2016). Article CAS Google Scholar *
Zhou, B., Wali, G., Peterse, F. & Bird, M. I. Organic carbon isotope and molecular fossil records of vegetation evolution in central Loess Plateau since 450 kyr. _Sci. China Earth Sci._
59, 1206–1215 (2016). Article CAS Google Scholar * Fuchs, L. et al. Multiproxy records of temperature, precipitation and vegetation on the central Chinese Loess Plateau over the past
200,000 years. _Quat. Sci. Rev._ 288, 107579 (2022). Article Google Scholar * An, Z. et al. Interplay between the Westerlies and Asian monsoon recorded in Lake Qinghai sediments since 32
ka. _Sci. Rep._ 2, 619 (2012). Article Google Scholar * Fan, Y., Jia, J., Xia, D., Meadows, M. & Wang, Z. Seasonality of response to millennial‐scale climate events of the last
glacial: evidence from loess records over mid‐latitude Asia. _Geochem. Geophys. Geosyst._ 22, e2021GC009903 https://doi.org/10.1029/2021GC009903 (2021). * Wang, P. Response of Western
Pacific marginal seas to glacial cycles: paleoceanographic and sedimentological features. _Mar. Geol._ 156, 5–39 (1999). Article Google Scholar * Liu, W. & Huang, Y. Compound specific
D/H ratios and molecular distributions of higher plant leaf waxes as novel paleoenvironmental indicators in the Chinese Loess Plateau. _Organic Geochem._ 36, 851–860 (2005). Article CAS
Google Scholar * Wang, Z., Liu, W. & Wang, H. New chronology of the Chinese loess-paleosol sequence by leaf wax δD records during the past 800 k.y. _Geology_ 49, 847–850 (2021). * Sun,
Y., Wang, X., Liu, Q. & Clemens, S. C. Impacts of post-depositional processes on rapid monsoon signals recorded by the last glacial loess deposits of northern China. _Earth Planet. Sci.
Lett._ 289, 171–179 (2010). Article CAS Google Scholar * Cheng, H., Sinha, A., Wang, X., Cruz, F. W. & Edwards, R. L. The Global Paleomonsoon as seen through speleothem records from
Asia and the Americas. _Clim. Dyn._ 39, 1045–1062 (2012). Article Google Scholar * Cheng, H. et al. A penultimate glacial monsoon record from Hulu Cave and two-phase glacial terminations.
_Geology_ 34, 217 (2006). Article CAS Google Scholar * Cheng, H. et al. Ice Age Terminations. _Science_ 326, 248–252 (2009). Article CAS Google Scholar * Chen, J. et al. On the timing
of the East Asian summer monsoon maximum during the Holocene—does the speleothem oxygen isotope record reflect monsoon rainfall variability? _Sci. China Earth Sci._ 59, 2328–2338 (2016).
Article CAS Google Scholar * Sun, J. & Huang, X. Half-precessional cycles recorded in Chinese loess: response to low-latitude insolation forcing during the Last Interglaciation.
_Quat. Sci. Rev._ 25, 1065–1072 (2006). Article Google Scholar * Terada, K. & Hanzawa, M. Climate of the North Pacific Ocean. _Clim. Oceans_ 15, 431–477 (1984). Google Scholar *
Berger, A. & Loutre, M. F. Intertropical latitudes and precessional and half-precessional cycles. _Science_ 278, 1476–1478 (1997). Article CAS Google Scholar * Su, Q., Lyu, A., Wu, Z.
& Yin, Q. Diverse response of global terrestrial vegetation to astronomical forcing and CO2 during the MIS-11 and MIS-13 interglacials. _Clim. Dyn._ 60, 375–392 (2023). Article Google
Scholar * Short, D. A., Mengel, J. G., Crowley, T. J., Hyde, W. T. & North, G. R. Filtering of Milankovitch Cycles by Earth’s Geography. _Quat. Res._ 35, 157–173 (1991). Article Google
Scholar * Crowley, T. J., Kim, K.-Y., Mengel, J. G. & Short, D. A. Modeling 100,000-year climate fluctuations in pre-pleistocene time series. _Science_ 255, 705–707 (1992). Article
CAS Google Scholar * Lisiecki, L. E. & Raymo, M. E. A Pliocene-Pleistocene stack of 57 globally distributed benthic δ18O records: Pliocene-Pleistocene benthic stack. _Paleoceanography_
20, PA1003 https://doi.org/10.1029/2004PA001071 (2005). * Ding, Z. et al. Ice-volume forcing of East Asian Winter Monsoon variations in the past 800,000 years. _Quat. Res._ 44, 149–159
(1995). Article Google Scholar * Sun, Y., Clemens, S. C., An, Z. & Yu, Z. Astronomical timescale and palaeoclimatic implication of stacked 3.6-Myr monsoon records from the Chinese
Loess Plateau. _Quat. Sci. Rev._ 25, 33–48 (2006). Article Google Scholar * Spratt, R. M. & Lisiecki, L. E. A Late Pleistocene sea level stack. _Clim. Past_ 12, 1079–1092 (2016).
Article Google Scholar * Liu, T., Ding, Z. & Rutter, N. Comparison of Milankovitch periods between continental loess and deep sea records over the last 2.5 Ma. _Quat. Sci. Rev._ 18,
1205–1212 (1999). Article Google Scholar * China Meteorological Administration. http://www.cma.gov.cn. * Rao, Z. et al. High-resolution summer precipitation variations in the western
Chinese Loess Plateau during the last glacial. _Sci. Rep._ 3, 2785 (2013). Article Google Scholar * Lai, Z.-P. & Wintle, A. G. Locating the boundary between the Pleistocene and the
Holocene in Chinese loess using luminescence. _Holocene_ 16, 893–899 (2006). Article Google Scholar * Fairbanks, R. G., Charles, C. D. & Wright, J. D. Origin of Global Meltwater
Pulses. in _Radiocarbon After Four Decades_ (eds. Taylor, R. E., Long, A. & Kra, R. S.) 473–500 (Springer New York, 1992). https://doi.org/10.1007/978-1-4757-4249-7_30. * Tierney, J. E.
& deMenocal, P. B. Abrupt shifts in Horn of Africa Hydroclimate since the last glacial maximum. _Science_ 342, 843–846 (2013). Article CAS Google Scholar * Li, M., Hinnov, L. &
Kump, L. Acycle: time-series analysis software for paleoclimate research and education. _Comput. Geosci._ 127, 12–22 (2019). Article CAS Google Scholar * Torrence, C. & Compo, G. P. A
practical guide to wavelet analysis. _Bull. Amer. Meteor. Soc._ 79, 61–78 (1998). Article Google Scholar * Grinsted, A., Moore, J. C. & Jevrejeva, S. Application of the cross wavelet
transform and wavelet coherence to geophysical time series. _Nonlin. Processes Geophys._ 11, 561–566 (2004). Article Google Scholar * Lu, H. et al. 800-kyr land temperature variations
modulated by vegetation changes on Chinese Loess Plateau. _Nat. Commun._ 10, 1–10 (2019). Article Google Scholar * Laskar, J. et al. A long-term numerical solution for the insolation
quantities of the Earth. _A&A_ 428, 261–285 (2004). Article Google Scholar Download references ACKNOWLEDGEMENTS We thank Klaas Nierop and Desmond Eefting (UU) for assistance with lipid
biomarker analysis and Frits Hilgen (UU) for help with spectral analysis. No permissions were required for field sampling. This work was financially supported by grants from NWO-Vidi (no.
192.074) to F.P. and from NSFC (no. 42230514) to Y.S., and carried out under the umbrella of the Netherlands Earth System Science Centre (NESSC). This project also received funding from the
European Union’s Horizon 2020 research and innovation programme under the Marie Skłodowska-Curie, grant agreement No 847504. The isotope analyses were supported by the Cluster of Excellence,
“The Ocean Floor - Earth’s Uncharted Interface” at MARUM - Center for Marine Environmental Sciences. We thank Ralph Kreutz for technical support. Three anonymous reviewers provided valuable
comments that further improved this work. AUTHOR INFORMATION AUTHORS AND AFFILIATIONS * Department of Earth Sciences, Utrecht University, 3584 CS, Utrecht, the Netherlands Louise Fuchs,
Jingjing Guo, Martin Ziegler & Francien Peterse * MARUM-Center for Marine Environmental Sciences, University of Bremen, D-28334, Bremen, Germany Enno Schefuß * State Key Laboratory of
Loess and Quaternary Geology, Institute of Earth Environment, Chinese Academy of Sciences, Xi’an, 710061, China Youbin Sun & Fei Guo Authors * Louise Fuchs View author publications You
can also search for this author inPubMed Google Scholar * Jingjing Guo View author publications You can also search for this author inPubMed Google Scholar * Enno Schefuß View author
publications You can also search for this author inPubMed Google Scholar * Youbin Sun View author publications You can also search for this author inPubMed Google Scholar * Fei Guo View
author publications You can also search for this author inPubMed Google Scholar * Martin Ziegler View author publications You can also search for this author inPubMed Google Scholar *
Francien Peterse View author publications You can also search for this author inPubMed Google Scholar CONTRIBUTIONS F.P. designed the research. F.P., F.G. and Y.S. conducted field work, Y.S.
provided the magnetic susceptibility and grain size data, L.F. and J.G. extracted and analysed the plant waxes, E.S. generated the isotope data. F.G. conducted the phase analysis of the
data. L.F. wrote the manuscript under the supervision of F.P. and M.Z. All co-authors contributed to the discussion of results and the manuscript draft. CORRESPONDING AUTHOR Correspondence
to Louise Fuchs. ETHICS DECLARATIONS COMPETING INTERESTS The authors declare no competing interests. PEER REVIEW PEER REVIEW INFORMATION _Communications Earth & Environment_ thanks the
anonymous reviewers for their contribution to the peer review of this work. Primary Handling Editors: Yama Dixit and Aliénor Lavergne. A peer review file is available. ADDITIONAL INFORMATION
PUBLISHER’S NOTE Springer Nature remains neutral with regard to jurisdictional claims in published maps and institutional affiliations. SUPPLEMENTARY INFORMATION PEER REVIEW FILE
SUPPLEMENTARY INFORMATION RIGHTS AND PERMISSIONS OPEN ACCESS This article is licensed under a Creative Commons Attribution 4.0 International License, which permits use, sharing, adaptation,
distribution and reproduction in any medium or format, as long as you give appropriate credit to the original author(s) and the source, provide a link to the Creative Commons license, and
indicate if changes were made. The images or other third party material in this article are included in the article’s Creative Commons license, unless indicated otherwise in a credit line to
the material. If material is not included in the article’s Creative Commons license and your intended use is not permitted by statutory regulation or exceeds the permitted use, you will
need to obtain permission directly from the copyright holder. To view a copy of this license, visit http://creativecommons.org/licenses/by/4.0/. Reprints and permissions ABOUT THIS ARTICLE
CITE THIS ARTICLE Fuchs, L., Guo, J., Schefuß, E. _et al._ Isotopic and magnetic proxies are good indicators of millennial-scale variability of the East Asian monsoon. _Commun Earth Environ_
4, 425 (2023). https://doi.org/10.1038/s43247-023-01090-z Download citation * Received: 17 April 2023 * Accepted: 08 November 2023 * Published: 20 November 2023 * DOI:
https://doi.org/10.1038/s43247-023-01090-z SHARE THIS ARTICLE Anyone you share the following link with will be able to read this content: Get shareable link Sorry, a shareable link is not
currently available for this article. Copy to clipboard Provided by the Springer Nature SharedIt content-sharing initiative