- Select a language for the TTS:
- UK English Female
- UK English Male
- US English Female
- US English Male
- Australian Female
- Australian Male
- Language selected: (auto detect) - EN
Play all audios:
ABSTRACT The mid-Pleistocene transition 1.25 to 0.6 million years ago marked a major shift in global climate periodicity from 41,000 to around 100,000 years without a concomitant orbital
forcing shift. Here, we investigate Asian climate dynamics associated with two extreme glacial loess coarsening events at the onset and middle of the mid-Pleistocene transition by combining
new and existing grain size and magnetic susceptibility records from the Chinese Loess Plateau spanning the last 1.6 million years with general circulation model simulations. We find that
the two extreme glacial events reflect exceptionally enhanced Asian aridification and winter monsoon activity. They coincided with notable Northern Hemisphere glacial ice sheet expansion at
1.25 and 0.9 million years ago when the 100,000-year periodicity initiated and intensified, respectively. Our results indicate that these anomalously dry and windy Asian glacials were
probably driven by an amplified terrestrial climate response to the coincident Northern Hemisphere ice sheet expansion. SIMILAR CONTENT BEING VIEWED BY OTHERS RAPID STRENGTHENING OF
WESTERLIES ACCOMPANIED INTENSIFICATION OF NORTHERN HEMISPHERE GLACIATION Article Open access 03 July 2023 NEAR-SYNCHRONOUS NORTHERN HEMISPHERE AND PATAGONIAN ICE SHEET VARIATION OVER THE
LAST GLACIAL CYCLE Article 08 May 2024 ORBITAL- AND MILLENNIAL-SCALE ASIAN WINTER MONSOON VARIABILITY ACROSS THE PLIOCENE–PLEISTOCENE GLACIAL INTENSIFICATION Article Open access 19 April
2024 INTRODUCTION Earth’s orbital variations drove periodic Pleistocene climate oscillations between glacial and interglacial conditions1,2,3,4. During cold glacials, continental-scale ice
sheets developed in the mid- to high-latitudes of North America and Eurasia, and the Antarctic Ice Sheet expanded beyond its present-day margins5,6,7. These ice sheets “retreated” to
present-day configurations, or beyond, during warm interglacials5,6. Glacial oscillations notably transitioned from a lower-amplitude 41-thousand years (kyr) cyclicity to a higher-amplitude
mean ~100-kyr cyclicity between ~1.25 and ~0.6 million years ago (Ma)6,8,9,10,11,12,13. This climatic event, known as the mid-Pleistocene transition (MPT), featured substantial Northern
Hemisphere ice sheet expansion during glacials6,8,9,10,11,12,13, and was accompanied by distinct ocean thermohaline circulation weakening at ~0.9 Ma14,15. The MPT was also associated with
prominent inland Asian aridification and desertification, which may have enhanced global cooling through dust emission, iron fertilization of oceans16,17, and an atmospheric CO2
concentration decrease linked to increasing dust-induced oceanic productivity18,19. After more than two decades of research, the drivers of climate change across the MPT remain debated11,12.
The MPT occurred without a concomitant shift in the orbital forcing rhythm, which suggests that the transition may have been caused by nonlinear internal feedback rather than by external
(insolation) forcing11,20. Several prominent hypotheses have been proposed to explain the cause of the MPT, including gradual lowering of atmospheric CO2 concentrations, sustained regolith
removal from North America and Europe, long-term nonlinear feedbacks between ice sheets and global climate, and their combined effects11,20,21,22,23. Furthermore, there is no consensus about
the forcing and/or pacing mechanisms for the mean ~100-kyr glacial cycles from the MPT onward: they are interpreted (i) as short eccentricity (95-kyr and 125-kyr) cycles, (ii) as 2–3
obliquity (41-kyr) cycles, (iii) as 4–6 precession (19-kyr and 23-kyr) cycles, or (iv) as semi-random fluctuations without true periodicity11,24,25,26. In addition, the timing of the MPT
remains debated; an increasing number of studies appear to support a gradual transition between ~1.25 Ma and ~0.6 Ma rather than an abrupt shift at a single point around 0.9–1 Ma11,12,20,27.
Finally, our current understanding of the MPT relies primarily on marine records11,12,20,21,22. However, continuous high-resolution terrestrial records through the MPT are rare, which
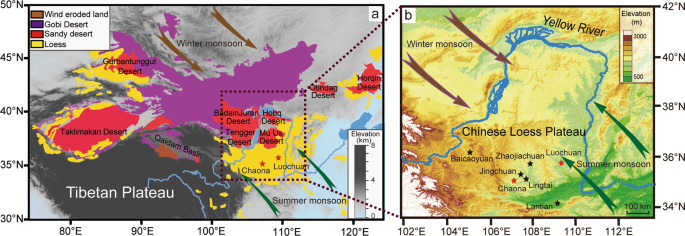
hinders development of a comprehensive understanding of the global nature and drivers of the MPT. The ~640,000 km2 Chinese Loess Plateau (CLP) extends across the northeastern Tibetan Plateau
margin from ~100 to 115°E and from ~34 to 41°N (Fig. 1). The CLP loess-palaeosol deposits yield long-term and near-continuous records of past climate change across the MPT. Dust, which
makes up the CLP loess-palaeosol sequence, was transported from the inland Gobi Desert, other nearby sandy deserts, and poorly-vegetated areas by near-surface northwesterly winter monsoon
winds28 (Fig. 1a). The grain size of the Quaternary CLP loess-palaeosol sequences reflects dust transport by winter monsoon winds and is generally interpreted as a winter monsoon intensity
indicator29,30,31. Stronger winter monsoon winds are associated with coarser dust accumulation on the CLP. Winter monsoon winds are caused by the outflow of cold and dry air from
high-pressure cells over the cool Asian continental interior, which blows toward lower-pressure cells over the warmer western Pacific and Indian oceans. Strong winter monsoons during cold
global glacials resulted in the deposition of thick loess layers; they consist of a mixture of clays, silts, and fine sands, and are largely unaltered by pedogenesis, with a yellow
color32,33. The Asian summer monsoon transports heat and moisture from the western Pacific and Indian oceans toward intense low-pressure (warm) cells over South and East Asia during the
boreal summer, and contributes 60–75% of annual precipitation on the CLP34,35. Enhanced summer monsoon precipitation on the CLP during warm interglacials drove more intense pedogenesis,
formation of abundant iron oxides (e.g., magnetite, maghemite, and hematite), and red soil development within the yellow loess sequence31,34,36. Since the concentration of pedogenically
formed iron oxides can be measured by magnetic susceptibility (χ), CLP loess-palaeosol χ is a much-used proxy for summer monsoon precipitation31,36,37. Stronger pedogenesis during periods of
increased precipitation accelerates fine magnetite/maghemite and hematite formation, which causes higher χ values31,36,37. The shift from yellow to red color is caused dominantly by
increased pigmentary red hematite formation during intense pedogenesis38. Cyclic stratigraphic alternations between yellow loess and red palaeosol layers are comparable across North
China29,31,33,34, and provide a unique, continuous continental archive of orbital- to millennial-scale Asian monsoon and environmental variability. Furthermore, they shed light on both low-
and high-latitude processes (i.e., summer and winter monsoon, respectively), and can be used to understand the relationship between global and regional Asian climate changes across the
MPT27,29,31,32,33,34,35,36,38,39,40,41,42. Here we present new continuous millennial-resolution grain size records for the last 1.6 Myr from two parallel loess-palaeosol sections on the
Central CLP to improve understanding of orbital-scale Asian climate variability and dynamics during the transition to the “~100-kyr world”. We combine them with existing χ records from the
same sections42,43 and with grain size and χ records from other loess-palaeosol sections29,33,44,45,46 to investigate glacial-interglacial changes in the winter monsoon, summer monsoon, dust
and moisture transport, and Asian interior climatic conditions across the MPT, with particular focus on two extreme pulses. We consider these CLP palaeoclimate records within a broader
context of existing terrestrial and global palaeoclimate records. We also perform new Earth System model simulations to assess the influence of Northern Hemisphere ice sheet expansion in
driving the observed continental-scale Asian glacial climate anomalies across the MPT. RESULTS AND DISCUSSION INSIGHTS FROM CLP PALAEOCLIMATE RECORDS To investigate winter monsoon dust
transport evolution over the last 1.6 Myr, 982 and 1115 samples were collected for grain size analysis from the Luochuan (109°24′E, 35°48′N; 98.3-m thick) and Chaona (107°12′E, 35°7′N; 110-m
thick) loess-palaeosol sections on the Central CLP, respectively (Fig. 1b). The 10-cm sampling interval is equivalent to a temporal spacing of ~1–2 kyr. Analogous to the global chronology
for benthic foraminiferal δ18O records from marine sediment cores47, the loess-palaeosol chronology has been established based on different sections/cores across the CLP using orbital
tuning, land-sea correlation, and/or grain-size age models, which result in similar ages and the same cycle-to-cycle correlations of loess and palaeosol layers to glacial and interglacial
periods defined by the marine benthic δ18O record27,29,31,33,43. Our CLP loess-palaeosol chronology was established by correlating both new median grain size and existing χ records42,43 from
the Luochuan and Chaona sections to the marine benthic foraminiferal δ18O record47, with additional support from palaeomagnetic constraints, including boundaries between the Brunhes and
Matuyama polarity chrons and the Jaramillo subchron (see Methods and Supplementary Figs. 1, 2). Other CLP loess-palaeosol sections used for comparison were also synchronized to this
chronology (Figs. 2 and 3). Our new median grain size records from both the Luochuan and Chaona sections have consistent glacial-interglacial variations that also correlate with those
observed in other sections across the CLP (Fig. 2). In addition to median grain size records, we calculated the U-ratio (ratio of 16–44 μm versus 5.5–16 μm particle concentrations)48 and
grain-size index (GSI, the ratio of 26–52 μm versus <16 μm particle concentrations)49 for the Luochuan and Chaona sections to assess Asian winter monsoon dust transport variability (Fig.
2). Median grain size, U-ratio, and GSI records from both Luochuan and Chaona have almost identical variability patterns (Fig. 2a–f). To reduce the effects of local changes, and to better
reveal large-scale glacial-interglacial winter monsoon dust transport across the CLP, we compiled a median grain size stack based on our new records from Chaona and Luochuan and existing
records from the Lingtai33, Jingchuan33, and Baicaoyuan44 sections (Fig. 2; Methods). Our median grain size stack varies consistently with the previous stack of mean grain size of quartz
particles (MGSQ) based on data from the Lingtai and Zhaojiachuan sections29 (Fig. 2j, k). Here we use our new multiple grain size records to offer a new, more global, perspective on the
dynamics of extreme Asian climate events across the MPT, in contrast to previous CLP grain size studies that focused on the general orbital variability and/or land-sea
correlations29,30,31,33,43,44. To assess summer monsoon variability on the CLP coeval to our grain-size-based winter monsoon record, we developed a new loess-palaeosol χ stack by compiling
existing χ records from Luochuan43, Chaona42, Jingchuan45, Zhaojiachuan29, Lantian46, and Lingtai29 (Fig. 3). Both our grain size and χ stacks involve more CLP loess-palaeosol sections than
previous stacks29,33, which further minimizes the impacts of local changes. As is the case for grain size records, temporal χ variability matches well among sections and generally correlates
cycle-by-cycle with glacial-interglacial cycles in the benthic foraminiferal δ18O record (Figs. 2, 3). Nevertheless, the records contain subtle differences in detail, largely because each
represents distinct climate features. In short, χ reflects summer monsoon precipitation, whereas grain size is affected by dust transport, and benthic foraminiferal δ18O is a function of
both deep-sea temperature and global ice volume. Consistent with previous studies27,29,31,33,39, glacial loess layers have overall larger median grain sizes, U-ratios, and GSI values
(stronger winter monsoons), and lower χ values (weaker summer monsoons and lower precipitation) than interglacial palaeosol layers (Figs. 2–4). Loess layers L15 (correlating to MIS 38 at
~1.25 Ma) and L9-1 (correlating to MIS 22 at ~0.9 Ma) have notably lower χ values and exceptionally larger median grain sizes, U-ratios, and GSI values than other loess layers (Figs. 2–4).
The distinct grain size increases in L15 and L9-1 are observed in all loess-palaeosol sequences from both the eastern and western CLP (Fig. 2), which indicates dominant and widespread dust
transport changes during MIS 38 and MIS 22 across the entire CLP. We infer that winter monsoon conditions over Asia during these periods were amplified (i.e., cooler, drier, and windier)
compared to preceding and succeeding glacials. To investigate the main (orbital) periodicities of the Asian summer and winter monsoon, and to compare these with global (i.e., high-latitude)
climatic variations, we present time-evolutive spectral analyses of the χ, grain size, and marine benthic δ18O stacks. Spectral analyses of the median grain size and χ stacks suggest a major
transition from a predominant 41-kyr to a mean ~100-kyr periodicity across the MPT, albeit with subtle differences in the exact expression of the transition (Fig. 5a, b). These differences
likely reflect more nuanced regional responses to MPT climate change. CLP precipitation (indicated by χ) is dominated by moisture transport from the western Pacific and Indian oceans to
inland Asia by the summer monsoon, which is a low-latitude process, whereas transport of cold and dry air from Eurasia toward the tropical oceans by the winter monsoon (indicated by median
grain size) represents a high- to mid-latitude process. Spectral analyses of the benthic δ18O record47 reveal a prominent switch from predominant 41-kyr to mean ~100-kyr cycles across the
MPT, with co-occurring 41-kyr and ~100-kyr cycles between ~1.2 Ma and ~0.6 Ma (Fig. 5c). A weak obliquity (41-kyr) cyclicity until ~0.6 Ma suggests that the shift in MPT periodicity was more
gradual and delayed in the global mean glacial cycle pattern reflected in the benthic foraminiferal δ18O record than in the CLP precipitation (χ) and winter monsoon (median grain size)
records (Fig. 5). The low-frequency spectral power in all three records is not centered exactly on the 100-kyr band before ~0.65 Ma and after ~0.2 Ma (Fig. 5). Spectral power splits broadly
into two branches close to 80-kyr and 120-kyr, respectively, during the MPT in all three records, although the timing and subtle features of the split vary. These two branches converge
toward a band close to 100-kyr by the MPT termination in all three records, which gradually evolves into a ~120-kyr band. The dominance of mean ~100-kyr power after the MPT coincides with a
substantial decline in the 41-kyr band. These observations are broadly consistent with previous findings for the MPT11,25. In addition, we find a 50- to 60-kyr band in the χ stack around 1.3
Ma and the median grain size stack between ~1.3 Ma and ~1.4 Ma, which is not distinct in the benthic δ18O stack (Fig. 5). Overall, an apparent shift from a predominantly 41-kyr to mean
~100-kyr orbital periodicity across the MPT in the CLP χ, median grain size, and marine benthic δ18O stacks suggests that orbital-scale Asian summer and winter monsoon variations are closely
linked to glacial-interglacial pacing of Northern Hemisphere ice sheets. MECHANISMS FOR CLP LOESS COARSENING ACROSS THE MPT Our multiple new grain size records reveal both orbital-scale
variability and extreme pulses across the MPT, in agreement with previous records29,33,39,40. Two prominent loess grain size anomalies at ~1.25 Ma (L15) and ~0.9 Ma (L9-1) have been
explained previously in terms of phased Tibetan Plateau uplift39. However, evidence for major plateau uplift during the MPT is tenuous. The Tibetan Plateau was already close to its
present-day elevation and configuration by at least the late Miocene, with only limited and more regional Quaternary adjustments50,51,52,53,54,55. Thus, plateau uplift cannot explain the
distinct coarsening of L15 and L9-1 across the CLP, nor their astronomical pacing. This leaves the cause(s) of L15 and L9-1, and their palaeoclimatic significance, open to further
investigation33. Fundamentally, these exceptionally coarse loess layers must reflect a combination of (i) widespread wind strength increase, (ii) transport pathway shortening due to enhanced
and expanded Central Asian aridity, (iii) enhanced coarse dust production through increased aridity and sediment availability, and/or (iv) reduced vegetation cover with lower soil stability
and greater soil erosion by wind during glacials MIS 38 and MIS 22. These terrestrial changes probably became prominent at the onset of (~1.25 Ma) and halfway through (~0.9 Ma) the MPT. For
example, new sandy deserts (e.g., Badain Jaran Desert, Tengger Desert) are known to have formed at ~1.2–0.9 Ma to the north of the CLP28,56, while existing sandy deserts (e.g., Mu Us
Desert) expanded southward at ~1.25 Ma32 (Fig. 4i). Sandy desert environments first appeared in the Hobq Desert at ~1.3–1.2 Ma, replacing preceding fluvio-lacustrine environments57. The
Tarim and Qaidam basins (northwestern China) also experienced increased aridity from ~1.25 Ma onward19,58,59 (Fig. 4i). Increasing carbonate δ13C values of the Kazakhstan loess sequence
suggest that Central Asia aridified across the MPT60. Glacial loess deposits in Tarim Basin, which were deposited under the control of mid-latitude Westerlies, became generally coarser
across the MPT18. The loess coarsening and parallel dust flux increases in the Tarim Basin are consistent with the expansion of Central Asian arid regions across the MPT18. Moreover, Tibetan
Plateau cooling across the MPT increased physical weathering intensity, which in turn produced more sand-sized material available for transport to western China through riverine and rain
erosion19. These Asian arid regions, especially the neighbouring Badain Jaran, Tengger, Mu Us, and Hobq deserts (see Fig. 1a), provided coarse dust sources for the CLP28. We propose that
desert expansion to the west and north of the CLP together with winter monsoon wind strengthening and potential dust source changes led to loess coarsening on the CLP. This agrees with
previous results of Sr and Nd isotopic compositions and detrital zircon U-Pb dating of CLP loess-palaeosol sediments, which track dust provenance changes during the MPT, with increased
contributions from the NE Tibetan Plateau and Gobi Altay Mountains61,62,63,64,65. The inferred Asian aridification and winter monsoon strengthening is also supported by the extension of
aeolian loess deposits to the south of the Qinling Mountains and Yangtze River catchment in southeast China across the MPT66. We note that intensification of glacial Asian climate and
environmental conditions coincided with Northern Hemisphere ice sheet expansion at the onset and middle of the MPT, when expression of mean ~100-kyr glacial cyclicity initiated and enhanced,
respectively6,8,9,10,13,67. Both marine and terrestrial data suggest that glacial Northern Hemisphere ice sheets expanded substantially at the beginning of, and halfway through, the MPT.
For example, various sea level reconstructions suggest notable low stands during MIS 38 and MIS 22 relative to preceding glacials, albeit with subtle amplitude differences among
reconstructions that relate to variable uncertainties in different methods6,8,9,10 (Fig. 4c–f). In addition, 26Al-10Be burial dating of tills suggests that the Laurentide Ice Sheet advanced
to its extreme southern limit (~40°N) by ~1.3 Ma67. The ODP Site 887 magnetic susceptibility and Deep Sea Drilling Project (DSDP) Site 607 carbonate concentration records suggest that
Northern Hemisphere ice sheets expanded and shed more ice-rafted debris into the Gulf of Alaska at ~1.3 Ma and Central North Atlantic Ocean at ~0.9 Ma, respectively68,69. Associated with ice
sheet expansion, glacial global average sea surface temperatures decreased markedly after ~1.25 Ma70 (Fig. 4h). We infer that Asian glacial climate intensification at ~1.25 and ~0.9 Ma as
indicated by CLP loess coarsening may be linked to concomitant shifts to greater glacial Northern Hemisphere ice sheet expansion in the context of enhancing global cooling across the MPT. To
assess the effect of Northern Hemisphere ice sheet expansion on Asia’s interior glacial conditions, aridification and desertification, we performed climate model sensitivity experiments. We
used the Community Earth System Model (CESM 1.2) to perform two experiments to examine the Asian (hydro-) climate response to Northern Hemisphere ice sheet expansion (see Methods). One
experiment (Large Ice Sheet (LIS) experiment) was conducted with Northern Hemisphere ice sheet distributions, orography, vegetation, lakes, aerosol conditions, and orbital parameters, set at
Last Glacial Maximum (LGM, ~20 ka) values5,71, and with 220 ppm CO2 and 450 ppb CH4 concentrations that are similar to values during glacial MIS 50 (~1.5 Ma) as reconstructed from Antarctic
ice cores72. The second experiment (Small Ice Sheet (SIS) experiment) was conducted with the same boundary conditions as the LIS experiment, but with a smaller Northern Hemisphere ice sheet
distribution, for which we employ the early Holocene/post-LGM configuration at 13 ka5 (Fig. 6a). Northern Hemisphere glacial ice sheet expansion across the MPT was similar in amplitude to
the change between 13 ka and the LGM (~20 ka) according to sea level and benthic foraminiferal δ18O records6,8,9,10,47, although exact ice sheet configurations were different between the
~20–13 ka and MPT periods67. Hence, our experiments are not representative of the full range of changing MPT boundary conditions, which remain poorly constrained, but are instead sensitivity
experiments that provide insights into the likely climate variations during the intense glacial events, similar to those that coincided with L15 and L9-1. Differences between our SIS and
LIS experiments suggest that Northern Hemisphere glacial ice sheet expansion led to a lowering of Asian mean annual temperature, precipitation, and net surface moisture (precipitation minus
evaporation) (Fig. 6b–d), which facilitated intensification and expansion of Central Asian aridity and increased dust production. Mean annual precipitation in the LIS experiment decreased by
~14% in arid inland regions (60–100°E, 30–60°N) and by ~9% in East Asian monsoon regions (100–120°E, 20–40°N) relative to the SIS experiment. Furthermore, ice sheet expansion strengthened
Asian high-pressure cells and winter monsoon circulation (Fig. 6e, f), which enhanced winter monsoon dust transport capacity toward the CLP. Overall, annual dust fluxes sourced from arid
regions to the north and east of the Tibetan Plateau increased by up to an order of magnitude from the SIS to LIS experiments (Fig. 6g). This is associated with an approximate doubling of
the annual atmospheric dust loading over East Asian down-wind regions (Fig. 6h), which is comparable to the largely doubled median grain sizes of L15 and L9-1 relative to adjacent loess
layers observed across the CLP (Figs. 2, 4b). Dust changes are substantially larger than precipitation changes between the SIS and LIS experiments (Fig. 6), consistent with the markedly
larger grain size changes compared to χ changes at ~1.25 Ma and ~0.9 Ma (Figs. 2, 3). Our adopted CESM 1.2 experiments do not include dynamic vegetation, nor glaciogenic dust responses.
Hence, our dust inferences represent minimum responses because (i) Northern Hemisphere ice sheet expansion was associated with increased glaciogenic dust73 and (ii) accompanying temperature
and precipitation lowering (with arid zone expansion) may have further decreased vegetation cover46,74, which in turn would have reduced soil stability, thereby facilitating erosion and dust
production and availability. Other potential dust-producing processes not included in the model, such as enhanced physical weathering and rock fracturing through intensified frost wedging
and/or glacial grinding, would also produce more dust material that becomes available for transport under colder MPT conditions19. Regardless, our model estimates, together with our land-sea
palaeoclimate correlation, strongly support the hypothesis that intensification and southeastward expansion of Asian aridity increased coarse dust availability, and that strengthening of
winter monsoon winds increased coarse dust transport, leading to an overall loess coarsening across the CLP, in response to phases of Northern Hemisphere ice sheet expansion during the MPT.
The CLP loess grain size records reveal different regional response intensities to boundary condition changes. Notably, loess L15 at ~1.25 Ma is coarser than L9-1 at ~0.9 Ma, which contrasts
with the larger ice volume and cooler climate during the latter period (Fig. 4). This suggests that the CLP grain size response was more pronounced at the MPT onset when the global climate
cooled sufficiently for Northern Hemisphere ice sheets to reach a critical size for the first time, which allowed abundant coarser particles to be transported by stronger winds. For example,
the initial glaciation-induced transition from fluvio-lacustrine to desert environments in the arid Asian interior would offer greater dust material availability for transport to the CLP
than the later, more sustained sandy desert conditions without fluvial-lacustrine processes. Fluvial-lacustrine conditions generally produce abundant dust for aeolian transport once water
bodies desiccate and sediment becomes exposed75,76. We argue that the distinct coarsening of L15 and L9-1 across the CLP was related to a combination of greater winter monsoon intensity,
shorter transport pathways, decreased vegetation cover, and increased availability of freshly eroded and transportable material in source regions. These changes responded to Northern
Hemisphere ice sheet expansion to critical sizes across the MPT. These terrestrial responses were unique to the MPT, when global and Asian climates shifted from a lower-amplitude 41-kyr
cyclicity to a higher-amplitude mean ~100-kyr cyclicity (Figs. 4, 5), which constituted a major global climatic reorganization. Integrating observations, land-sea correlations, and model
simulations, we propose that Northern Hemisphere ice sheet expansion drove large-scale amplification of Asian glacial conditions at the onset of (~1.25 Ma) and halfway through (~0.9 Ma) the
MPT, when expression of mean ~100-kyr glacial cyclicity initiated and enhanced, respectively. These two glacial intensifications were marked by a combination of intensified and expanded
Asian aridity, winter monsoon strengthening, and summer monsoon weakening, with distinct coarsening of loess layers L15 and L9-1 across the CLP. The shift from a predominantly 41-kyr to mean
~100-kyr orbital periodicity across the MPT is also apparent in our winter and summer monsoon records, which, more generally, reflect Northern Hemisphere ice sheet control on orbital-scale
Asian climate variability, not just on extreme glacial Asian climate events at ~1.25 Ma and ~0.9 Ma. Our study supports a close relationship between the Pleistocene Asian-interior and global
climate changes. METHODS Following surface outcrop removal, 1115 and 982 fresh samples, respectively, were collected from the Chaona and Luochuan sections, Central CLP, from Holocene
palaeosol layer S1 (corresponding to MIS 1) to palaeosol layer S22 (corresponding to MIS 55) at 10 cm intervals. These intervals are equivalent to an averaged temporal spacing of ~1–2 kyr
that is of higher sampling resolution than in many previous studies. All samples were used for grain size analyses. In preparation for grain size analyses, about 0.2–0.3 g of bulk sample was
first pretreated with 30% hydrogen peroxide (H2O2) to remove organic matter and subsequently with 10% hydrochloric acid (HCl) to remove carbonates and iron oxides. After dispersing with 10
mL 10% sodium hexametaphosphate ((NaPO3)6) solution in an ultrasonic bath for ~10 min, the grain size distribution was measured using a Malvern 2000 Laser Instrument at the Institute of
Earth Environment, Chinese Academy of Sciences, Xi’an (China). The relative standard deviation of grain size measurement was <3%. CLP loess-palaeosol age models were established using
different approaches, including orbital tuning, land-sea correlation, and grain-size age models, that are all similar and match well with the marine benthic δ18O records27,29,31,33. In
particular, the extremely coarse loess layers L15 and L9-1 are consistently correlated to MIS 38 and MIS 22 in these age models27,29,33. In Luochuan, Chaona, and other CLP sections,
palaeosol layers, which developed during interglacials, have higher χ values and smaller grain sizes than loess layers that accumulated during glacials27,29,31,33. Based on the correlation
of loess (palaeosol) layers to glacial (interglacial) periods27,29,31,33,43, we constructed an age model for the Luochuan and Chaona loess-palaeosol sections by correlating median grain size
and χ to the marine benthic δ18O stack47. We correlated iteratively until visually satisfactory cycle-to-cycle correlations were obtained. Final age models for the Luochuan and Chaona
sections were established using 37 and 38 age correlation points, respectively. These age correlation points are mostly adjacent to loess–palaeosol boundaries (Supplementary Fig. 1), which
facilitated consistent correlation point selection throughout the entire section. The age model is supported by an established magnetostratigraphy for each section77,78, which provides age
tie points for the Brunhes and Matuyama polarity chrons, including the Jaramillo subchron, that are consistent with the geomagnetic polarity time scale (GPTS)47 (Supplementary Fig. 1),
taking into account uncertainties in the post-depositional natural remanent magnetization (NRM) lock-in depth (generally <50 cm) in CLP loess-palaeosol sediments44. The age model results
in a smooth and linear relationship between age and depth for both sections, without abrupt shifts, which provides additional support for our established CLP chronology (Supplementary Fig.
2). Other CLP loess-palaeosol sections, including Lingtai29,33, Jingchuan33,45, Baicaoyuan44, Zhaojiachuan29, and Lantian46, were synchronized to this chronology by cycle-to-cycle
correlation of median grain size or χ data to their counterparts at Luochuan and Chaona. Thus, all sections considered here were placed on the same, newly refined chronology (Figs. 2, 3).
After synchronization, we used the interpolating function in the _Acycle_ software79 to conservatively resample the grain size and χ records at 0.5-kyr intervals to obtain an evenly-spaced
data series. We constructed the CLP median grain size stack by averaging the evenly-spaced median grain size time series of the Chaona, Luochuan, Lingtai, Jingchuan, and Baicaoyuan sections
with equal weight. Similarly, we constructed the CLP χ stack by averaging the evenly-spaced χ time series of Luochuan, Chaona, Jingchuan, Zhaojiachuan, Lantian, and Lingtai sections with
equal weight. The χ, median grain size, and LR04 benthic δ18O stacks47 were subjected to spectral analysis to evaluate the robustness of their potential orbital signature. Evolutionary power
spectra were calculated using the _Acycle_ software79 with a 320-kyr sliding window and 2.6-kyr step. To improve the expression of the orbital transition across the MPT from 41-kyr to
~100-kyr cycles in the χ and median grain size records, their longer trends were removed with a low-band-pass filter; the residual records were used for evolutionary power spectral analysis.
The Community Earth System Model (CESM 1.2) was used to test the sensitivity and underlying Asian climate response dynamics to Northern Hemisphere ice sheet expansion across the MPT. The
CESM consists of coupled dynamic atmosphere, ocean, land, sea-ice, and land-ice components80. We used the Community Atmosphere Model (CAM), Community Land Model (CLM), Parallel Ocean Program
(POP), Community Sea-Ice Component (CICE), and Coupler modules in the CESM. The CAM has a Bulk Aerosol Model (BAM) parameterization of dust emission, transport, and deposition81, which has
been shown to simulate well dust emission flux and loading in Asia82. The atmosphere has 26 vertical layers and ~0.9° (latitude) × 1.25° (longitude) horizontal resolution. The land model has
15 soil layers and the same horizontal resolution as the atmosphere. Ocean and sea-ice components have 60 vertical layers with 0.5° horizontal resolution. To evaluate Asian (hydro-) climate
response to MPT Northern Hemisphere ice sheet expansion, we performed two sensitivity experiments: the SIS and LIS experiments (see main text for boundary condition details). In contrast to
LGM values (185 ppm CO2 and 350 ppb CH4), which are often used in simulations82,83,84,85,86, we used 220 ppm CO2 and 450 ppb CH4 concentrations that are similar to their values during
glacial MIS 50 (~1.5 Ma) as reconstructed from Antarctic ice cores, which may better reflect early Pleistocene glacial greenhouse gas concentrations during the MPT72. In our experiments,
only Northern Hemisphere ice sheet distributions were variable while keeping other boundary conditions fixed. This model design enables an understanding of how Asian (hydro-) climate
responds exactly to Northern Hemisphere ice sheet expansion. The ice volume difference between SIS and LIS experiments is broadly in agreement with the amplitude of change across the MPT
according to sea level and benthic foraminiferal δ18O records6,8,9,10,47. Both experiments were integrated for 150 model years from the equilibrated LGM initial conditions based on the
Palaeoclimate Modeling Intercomparison Project (PMIP3) LGM experiment (http://pmip3.lsce.ipsl.fr). Climatological means of the last 50 model years were used here. Our modeling differs from
previous efforts in the following respects. Previous simulations generally used the full range of LGM boundary conditions82,83,84,85,86. Although our experiments employ LGM orography,
vegetation, lakes, aerosol conditions, and orbital parameters, we adjusted CO2 and CH4 concentrations from LGM to early Pleistocene glacial values to better reflect MPT glacial greenhouse
gas conditions72. Moreover, previous simulations examined Asian climate responses to the combined influences of global ice volume, orbital forcing, and greenhouse gas concentration changes
from the LGM to Holocene, pre-industrial, or present day83,84,86,87,88, yet the response to ice volume change by itself was poorly constrained82,89. In our experiments, only the Northern
Hemisphere ice sheet extent is varied and other parameters (e.g., greenhouse gas and orbital forcing) are kept constant, which helps to improve understanding of how Asian (hydro-) climate
responds exactly to Northern Hemisphere ice sheet expansion across the MPT. Northern Hemisphere ice sheet expansions from the Holocene, pre-industrial, or present day to the LGM used in
previous simulations are useful for understanding the impacts of large-amplitude ice sheet changes between full glacial and interglacial conditions. However, these ice volume changes
overestimate the glacial changes across the MPT. The expansion of Northern Hemisphere ice sheets between our SIS and LIS experiments better represents the ice volume changes across the MPT.
Despite these model differences, both previous82,84,86,89,90,91 and our new simulations indicate that Northern Hemisphere ice sheet expansion was associated with Asian cooling, winter
monsoon strengthening, and aridification. Simulations suggest that large ice sheets can also drive cooling and aridification in North China under the warmer Pliocene boundary conditions92.
However, our models do not simulate the wetter-than-present conditions in Central Asia when ice volume was larger, for example, under the LGM maximum Northern Hemisphere ice volume
conditions that were observed in some previous simulations93; this response may have arisen from a boundary condition other than ice volume in previous simulations. DATA AVAILABILITY All
measured proxy data presented here are attached in Supplementary Dataset 1 and also available in the East Asian Palaeoenvironmental Science Database
(https://doi.org/10.12262/IEECAS.EAPSD2023002). REFERENCES * Berger, A. Milankovitch theory and climate. _Rev. Geophys._ 26, 624–657 (1988). Article Google Scholar * Hays, J. D., Imbrie,
J. & Shackleton, N. J. Variations in the Earth’s orbit: pacemaker of the ice ages. _Science_ 194, 1121–1132 (1976). Article CAS Google Scholar * Imbrie, J. et al. On the structure and
origin of major glaciation cycles 2. The 100,000-year cycle. _Paleoceanography_ 8, 699–735 (1993). Article Google Scholar * Raymo, M. E., Lisiecki, L. E. & Nisancioglu, K. H.
Plio-Pleistocene ice volume, Antarctic climate, and the global δ18O record. _Science_ 313, 492–495 (2006). Article CAS Google Scholar * Peltier, W. R. Global glacial isostasy and the
surface of the ice-age earth: the ice-5G (VM2) model and GRACE. _Ann. Rev. Earth Planet. Sci._ 32, 111–149 (2004). Article CAS Google Scholar * Rohling, E. J. et al. Sea level and
deep-sea temperature reconstructions suggest quasi-stable states and critical transitions over the past 40 million years. _Sci. Adv._ 7, eabf5326 (2021). Article CAS Google Scholar *
Denton, G. H. et al. The last glacial termination. _Science_ 328, 1652–1656 (2010). Article CAS Google Scholar * Rohling, E. J. et al. Sea-level and deep-sea-temperature variability over
the past 5.3 million years. _Nature_ 508, 477–482 (2014). Article CAS Google Scholar * Elderfield, H. et al. Evolution of ocean temperature and ice volume through the Mid-Pleistocene
climate transition. _Science_ 337, 704–709 (2012). Article CAS Google Scholar * Miller, K. G. et al. Cenozoic sea-level and cryospheric evolution from deep-sea geochemical and continental
margin records. _Sci. Adv._ 6, eaaz1346 (2020). Article CAS Google Scholar * Berends, C. J., Köhler, P., Lourens, L. J. & van de Wal, R. S. W. On the cause of the mid-Pleistocene
transition. _Rev. Geophys._ 59, e2020RG000727 (2021). Article Google Scholar * Clark, P. U. et al. The middle Pleistocene transition: characteristics, mechanisms, and implications for
long-term changes in atmospheric _p_CO2. _Quat. Sci. Rev._ 25, 3150–3184 (2006). Article Google Scholar * Ford, H. L. & Raymo, M. E. Regional and global signals in seawater δ18O
records across the mid-Pleistocene transition. _Geology_ 48, 113–117 (2020). Article Google Scholar * Pena, L. D. & Goldstein, S. L. Thermohaline circulation crisis and impacts during
the mid-Pleistocene transition. _Science_ 345, 318–322 (2014). Article CAS Google Scholar * Yehudai, M. et al. Evidence for a Northern Hemispheric trigger of the 100,000-y glacial
cyclicity. _Proc. Natl. Acad. Sci. USA_ 118, e2020260118 (2021). Article CAS Google Scholar * Martínez-Garcia, A. et al. Southern Ocean dust–climate coupling over the past four million
years. _Nature_ 476, 312–315 (2011). Article Google Scholar * Martínez-Garcia, A. et al. Links between iron supply, marine productivity, sea surface temperature, and CO2 over the last 1.1
Ma. _Paleoceanography_ 24, PA1207 (2009). Article Google Scholar * Fang, X. M. et al. The 3.6-Ma aridity and westerlies history over midlatitude Asia linked with global climatic cooling.
_Proc. Natl. Acad. Sci. USA_ 117, 24729–24734 (2020). Article CAS Google Scholar * Liu, W. G. et al. Onset of permanent Taklimakan Desert linked to the mid-Pleistocene transition.
_Geology_ 48, 782–786 (2020). Article CAS Google Scholar * Chalk, T. B. et al. Causes of ice age intensification across the Mid-Pleistocene Transition. _Proc. Natl. Acad. Sci. USA_ 114,
13114–13119 (2017). Article CAS Google Scholar * Willeit, M., Ganopolski, A., Calov, R. & Brovkin, V. Mid-Pleistocene transition in glacial cycles explained by declining CO2 and
regolith removal. _Sci. Adv._ 5, eaav7337 (2019). Article CAS Google Scholar * Clark, P. U. & Pollard, D. Origin of the middle Pleistocene transition by ice sheet erosion of regolith.
_Paleoceanography_ 13, 1–9 (1998). Article Google Scholar * Tabor, C. R. & Poulsen, C. J. Simulating the mid-Pleistocene transition through regolith removal. _Earth Planet. Sci.
Lett._ 434, 231–240 (2016). Article CAS Google Scholar * Shackleton, N. J. The 100,000-year ice-age cycle identified and found to lag temperature, carbon dioxide, and orbital
eccentricity. _Science_ 289, 1897–1902 (2000). Article CAS Google Scholar * Liu, Z. H., Cleaveland, L. C. & Herbert, T. D. Early onset and origin of 100-kyr cycles in Pleistocene
tropical SST records. _Earth Planet. Sci. Lett._ 265, 703–715 (2008). Article CAS Google Scholar * Ruddiman, W. F. Orbital insolation, ice volume, and greenhouse gases. _Quat. Sci. Rev._
22, 1597–1629 (2003). Article Google Scholar * Peng, X. Z., Ao, H., Xiao, G. Q., Qiang, X. K. & Sun, Q. The Early-Middle Pleistocene transition of Asian summer monsoon. _Palaeogeogr.
Palaeoclimatol. Palaeoecol._ 545, 109636 (2020). Article Google Scholar * Sun, Y. B. et al. Source-to-sink fluctuations of Asian eolian deposits since the late Oligocene. _Earth-Sci. Rev._
200, 102963 (2020). Article CAS Google Scholar * Sun, Y. B., Clemens, S. C., An, Z. S. & Yu, Z. W. Astronomical timescale and palaeoclimatic implication of stacked 3.6-Myr monsoon
records from the Chinese Loess Plateau. _Quat. Sci. Rev._ 25, 33–48 (2006). Article Google Scholar * Ding, Z. L. et al. Ice-volume forcing of East Asian winter monsoon variations in the
past 800,000 Years. _Quat. Res._ 44, 149–159 (1995). Article Google Scholar * Hao, Q. Z. et al. Delayed build-up of Arctic ice sheets during 400,000-year minima in insolation variability.
_Nature_ 490, 393–396 (2012). Article CAS Google Scholar * Ding, Z. L., Derbyshire, E., Yang, S. L., Sun, J. M. & Liu, T. S. Stepwise expansion of desert environment across northern
China in the past 3.5 Ma and implications for monsoon evolution. _Earth Planet. Sci. Lett._ 237, 45–55 (2005). Article CAS Google Scholar * Ding, Z. L. et al. Stacked 2.6-Ma grain size
record from the Chinese loess based on five sections and correlation with the deep-sea δ18O record. _Paleoceanography_ 17, PA000725 (2002). Article Google Scholar * Ao, H. et al. Two-stage
mid-Brunhes climate transition and mid-Pleistocene human diversification. _Earth-Sci. Rev._ 210, 103354 (2020). Article CAS Google Scholar * Sun, Y. B. et al. Diverse manifestations of
the mid-Pleistocene climate transition. _Nat. Commun._ 10, 352 (2019). Article CAS Google Scholar * An, Z. S. et al. The long-term paleomonsoon variation recorded by the loess-paleosol
sequence in central China. _Quat. Int._ 718, 91–95 (1990). Google Scholar * Maher, B. A. Palaeoclimatic records of the loess/palaeosol sequences of the Chinese Loess Plateau. _Quat. Sci.
Rev._ 154, 23–84 (2016). Article Google Scholar * Sun, Y. B., He, L., Liang, L. J. & An, Z. S. Changing color of Chinese loess: geochemical constraint and paleoclimatic significance.
_J. Asian Earth Sci._ 40, 1131–1138 (2011). Article Google Scholar * Sun, J. M. & Liu, T. S. Stratigraphic evidence for the uplift of the Tibetan Plateau between ~1.1 and ~0.9 myr ago.
_Quat. Res._ 54, 309–320 (2000). Article Google Scholar * Ding, Z., Yu, Z., Rutter, N. W. & Liu, T. Towards an orbital time scale for Chinese loess deposits. _Quat. Sci. Rev._ 13,
39–70 (1994). Article Google Scholar * Heslop, D., Dekkers, M. J. & Langereis, C. G. Timing and structure of the mid-Pleistocene transition: records from the loess deposits of northern
China. _Palaeogeogr. Palaeoclimatol. Palaeoecol._ 185, 133–143 (2002). Article Google Scholar * Song, Y. G. et al. Magnetic parameter variations in the Chaona loess/paleosol sequences in
the central Chinese Loess Plateau, and their significance for the middle Pleistocene climate transition. _Quat. Res._ 81, 433–444 (2014). Article Google Scholar * Han, Y. M. et al. Asian
inland wildfires driven by glacial-interglacial climate change. _Proc. Natl. Acad. Sci. USA_ 117, 5184–5189 (2020). Article CAS Google Scholar * Jin, C. S. et al. A new correlation
between Chinese loess and deep-sea δ18O records since the middle Pleistocene. _Earth Planet. Sci. Lett._ 506, 441–454 (2019). Article CAS Google Scholar * Ding, Z. L. et al.
Magnetostratigraphy and sedimentology of the Jingchuan red clay section and correlation of the Tertiary eolian red clay sediments of the Chinese Loess Plateau. _J. Geophys. Res._ 106,
6399–6407 (2001). Article Google Scholar * An, Z. S. et al. Multiple expansions of C4 plant biomass in East Asia since 7 Ma coupled with strengthened monsoon circulation. _Geology_ 33,
705–708 (2005). Google Scholar * Lisiecki, L. E. & Raymo, M. E. A Pliocene-Pleistocene stack of 57 globally distributed benthic δ18O records. _Paleoceanography_ 20, PA1003 (2005).
Google Scholar * Vandenberghe, J. Grain size of fine-grained windblown sediment: a powerful proxy for process identification. _Quat. Sci. Rev._ 121, 18–30 (2013). Google Scholar * Antoine,
P. et al. Rapid and cyclic aeolian deposition during the Last Glacial in European loess: a high-resolution record from Nussloch, Germany. _Quat. Sci. Rev._ 28, 2955–2973 (2009). Article
Google Scholar * Wang, C. S. et al. Outward-growth of the Tibetan Plateau during the Cenozoic: a review. _Tectonophysics_ 621, 1–43 (2014). Article Google Scholar * Renner, S. S.
Available data point to a 4-km-high Tibetan Plateau by 40 Ma, but 100 molecular-clock papers have linked supposed recent uplift to young node ages. _J. Biogeogr._ 43, 1479–1487 (2016).
Article Google Scholar * Wang, E. et al. Two-phase growth of high topography in eastern Tibet during the Cenozoic. _Nat. Geosci._ 5, 640–645 (2012). Article Google Scholar * Kapp, P.
& DeCelles, P. G. Mesozoic-Cenozoic geological evolution of the Himalayan-Tibetan orogen and working tectonic hypotheses. _Am. J. Sci._ 319, 159–254 (2019). Article Google Scholar *
Spicer, R. A. et al. Why the ‘Uplift of the Tibetan Plateau’ is a myth. _Natl. Sci. Rev._ 1, 152–170 (2021). Google Scholar * Deng, T. & Ding, L. Paleoaltimetry reconstructions of the
Tibetan Plateau: progress and contradictions. _Natl. Sci. Rev._ 2, 417–437 (2015). Article CAS Google Scholar * Li, Z. J., Wang, F., Wang, X., Li, B. F. & Chen, F. H. A multi-proxy
climatic record from the central Tengger Desert, southern Mongolian Plateau: implications for the aridification of inner Asia since the late Pliocene. _J. Asian Earth Sci._ 160, 27–37
(2018). Article Google Scholar * Li, B. F. et al. Paleomagnetic chronology and paleoenvironmental records from drill cores from the Hetao Basin and their implications for the formation of
the Hobq Desert and the Yellow River. _Quat. Sci. Rev._ 156, 69–89 (2017). Article Google Scholar * Cai, M. T., Fang, X. M., Wu, F. L., Miao, Y. F. & Appel, E. Pliocene–Pleistocene
stepwise drying of Central Asia: evidence from paleomagnetism and sporopollen record of the deep borehole SG-3 in the western Qaidam Basin, NE Tibetan Plateau. _Glob. Planet. Change_ 94–95,
72–81 (2012). Article Google Scholar * Herb, C. et al. Late Plio-Pleistocene humidity fluctuations in the western Qaidam Basin (NE Tibetan Plateau) revealed by an integrated
magnetic-palynological record from lacustrine sediments. _Quat. Res._ 84, 457–466 (2015). Article Google Scholar * Prud’homme, C. et al. Central Asian modulation of Northern Hemisphere
moisture transfer over the Late Cenozoic. _Commun. Earth Environ._ 2, 1–8 (2021). Article Google Scholar * Zhang, H. Z. et al. Expansion of dust provenance and aridification of Asia since
~7.2 Ma revealed by detrital zircon U-Pb dating. _Geophys. Res. Lett._ 45, 13437–13448 (2018). Article Google Scholar * Li, Z. Y., Wang, X. S., Sheng, M., Jiang, K. & Yi, S. Y.
Detrital zircon U-Pb geochronology of the Xining loess in the northeastern Tibetan Plateau. _Quat. Int._ 622, 110–118 (2022). Article Google Scholar * Chen, Z. & Li, G. J. Evolving
sources of eolian detritus on the Chinese Loess Plateau since early Miocene: tectonic and climatic controls. _Earth Planet. Sci. Lett._ 371, 220–225 (2013). Article Google Scholar * Yang,
G. L. et al. Provenance of Quaternary aeolian silts in western China and its spatial difference with source of the Yellow River sediments. _Quat. Sci. Rev._ 296, 107785 (2022). Article
Google Scholar * Zhang, H. Z. et al. Large-number detrital zircon U-Pb ages reveal global cooling caused the formation of the Chinese Loess Plateau during Late Miocene. _Sci. Adv._ 8,
eabq2007 (2022). Article CAS Google Scholar * Lu, H. Y., Wang, X. Y. & Li, L. P. In _Monsoon Evolution and Tectonics–Climate Linkage in Asia_. (eds. Clift, P. D., Tada, R. &
Zheng, H. B.) 29–44 (Geological Society, 2010). * Balco, G. & Rovey, C. W. Absolute chronology for major Pleistocene advances of the Laurentide Ice Sheet. _Geology_ 38, 795–798 (2010).
Article CAS Google Scholar * Raymo, M. E., Ruddiman, W. F., Backman, J., Clement, B. M. & Martinson, D. G. Late Pliocene variation in northern hemisphere ice sheets and North Atlantic
deep water circulation. _Paleoceanography_ 4, 413–446 (1989). Article Google Scholar * Rea, D. K., Basov, I. A. & Krissek, L. A., the Leg 145 Scientific Party. Scientific results of
drilling the North Pacific transect. _Proc. Ocean Drill. Progr._ 145, 577–596 (1995). Google Scholar * Snyder, C. W. Evolution of global temperature over the past two million years.
_Nature_ 538, 226–228 (2016). Article CAS Google Scholar * Laskar, J., Fienga, A., Gastineau, M. & Manche, H. La2010: a new orbital solution for the long-term motion of the Earth.
_Astron. Astrophys._ 532, A89 (2011). Article Google Scholar * Yan, Y. Z. et al. Two-million–year-old snapshots of atmospheric gases from Antarctic ice. _Nature_ 574, 663–666 (2019).
Article CAS Google Scholar * Mahowald, N. M. et al. Change in atmospheric mineral aerosols in response to climate: last glacial period, preindustrial, modern, and doubled carbon dioxide
climates. _J. Geophys. Res_. 111, D10202 (2006). * Yang, S. L. et al. Warming-induced northwestward migration of the East Asian monsoon rain belt from the Last Glacial Maximum to the
mid-Holocene. _Proc. Natl. Acad. Sci. USA_ 112, 13178–13183 (2015). Article CAS Google Scholar * Licht, A., Pullen, A., Kapp, P., Abell, J. & Giesler, N. Eolian cannibalism: reworked
loess and fluvial sediment as the main sources of the Chinese Loess Plateau. _Geol. Soc. Am. Bull._ 128, 944–956 (2016). Article CAS Google Scholar * Nie, J. S. et al. Loess Plateau
storage of Northeastern Tibetan Plateau-derived Yellow River sediment. _Nat. Commun._ 6, 8511 (2015). Article CAS Google Scholar * Liu, W. M., Zhang, L. Y. & Sun, J. M. High
resolution magnetostratigraphy of the Luochuan loess-paleosol sequence in the central Chinese Loess Plateau. _Chin. J. Geophys._ 53, 888–894 (2010). Google Scholar * Lu, L. Q., Fang, X. M.,
Mason, J. A., Li, J. J. & An, Z. S. The evolution of coupling of Asian winter monsoon and high latitude climate of Northern Hemisphere-grain evidence from 8.1 Ma loess-red clay sequence
on the Chinese central Loess Plateau. _Sci. China_ 44, 185–191 (2001). Article Google Scholar * Li, M. S., Hinnov, L. & Kump, L. _Acycle_: time–series analysis software for
paleoclimate research and education. _Comput. Geosci._ 127, 12–22 (2019). Article CAS Google Scholar * Hurrell, J. W. et al. The Community Earth System Model: a framework for
collaborative research. _Bull. Am. Meteorol. Soc._ 94, 1339–1360 (2013). Article Google Scholar * Albani, S. et al. Improved dust representation in the Community Atmosphere Model. _J. Adv.
Model. Earth Syst._ 6, 541–570 (2014). Article Google Scholar * Li, X. Z., Liu, X. D. & Zhou, H. B. Joint influence of surface erosion and high-latitude ice-sheet extent on Asian dust
cycle during the last glacial maximum. _Geol. Mag._ 157, 777–789 (2020). Article Google Scholar * Zhang, Y. X. & Li, Y. Three modes of climate change since the Last Glacial Maximum in
arid and semi-arid regions of the Asian continent. _J. Geogr. Sci._ 32, 195–213 (2022). Article CAS Google Scholar * Ueda, H., Kuroki, H., Ohba, M. & Kamae, Y. Seasonally asymmetric
transition of the Asian monsoon in response to ice age boundary conditions. _Clim. Dyn._ 37, 2167–2179 (2011). Article Google Scholar * Löfverström, M., Caballero, R., Nilsson, J. &
Kleman, J. Evolution of the large-scale atmospheric circulation in response to changing ice sheets over the last glacial cycle. _Clim. Past_ 10, 1453–1471 (2014). Article Google Scholar *
Eagle, R. A. et al. High regional climate sensitivity over continental China constrained by glacial-recent changes in temperature and the hydrological cycle. _Proc. Natl. Acad. Sci. USA_
110, 8813–8818 (2013). Article CAS Google Scholar * Zheng, W. P. & Yu, Y. Q. Paleoclimate simulations of the mid-Holocene and last glacial maximum by FGOALS. _Adv. Atmos. Sci._ 30,
684–698 (2013). Article Google Scholar * Jiang, D. B., Tian, Z. P., Lang, X. M., Kageyama, M. & Ramstein, G. The concept of global monsoon applied to the last glacial maximum: a
multi-model analysis. _Quat. Sci. Rev._ 126, 126–139 (2015). Article Google Scholar * Li, Q. et al. Spatial variation of East Asian winter monsoon evolution between northern and southern
China since the last glacial maximum. _Quat. Res._ 103, 99–112 (2021). Article Google Scholar * Lyu, A. Q., Yin, Q. Z., Crucifix, M. & Sun, Y. B. Diverse regional sensitivity of summer
precipitation in East Asia to ice volume, CO2 and astronomical forcing. _Geophys. Res. Lett._ 48, e2020GL092005 (2021). Article CAS Google Scholar * Xie, X. X., Liu, X. D., Chen, G. S.
& Korty, R. L. A transient modeling study of the latitude dependence of East Asian winter monsoon variations on orbital timescales. _Geophys. Res. Lett._ 46, 7565–7573 (2019). Article
Google Scholar * Dolan, A. M. et al. Modelling the enigmatic Late Pliocene Glacial Event - Marine Isotope Stage M2. _Global Planet Change_ 128, 47–M60 (2015). Article Google Scholar *
Zhang, X. J., Li, J. R., Gao, M. & Jin, L. Y. Simulated precipitation changes in Central Asia since the Last Glacial Maximum. _Quat. Int._ 490, 82–97 (2018). Article Google Scholar
Download references ACKNOWLEDGEMENTS We thank Dr. Constantijn J. Berends and two anonymous reviewers for their constructive comments, and Prof. M. E. Raymo for helpful suggestions on an
earlier version of this manuscript. This study was supported by the Chinese Academy of Science Strategic Priority Research Program (XDB26000000), the Second Tibetan Plateau Scientific
Expedition and Research (STEP) program (2019QZKK0707), the National Natural Science Foundation of China, the Science and Technology Innovation Project of Laoshan Laboratory (LSKJ202203300),
the Shaanxi Provence Youth Talent Support Program, the Opening Foundation of the Key Laboratory of Marine Geology and Metallogeny, MNR (MGM202001), Australian Research Council (ARC)
Australian Laureate Fellowship grant FL120100050 to E.J.R., ARC grant DP120103952 to A.P.R., and Heising-Simons Foundation Grant #2016-05 to C.J.P. AUTHOR INFORMATION AUTHORS AND
AFFILIATIONS * State Key Laboratory of Loess and Quaternary Geology, Institute of Earth Environment, Chinese Academy of Sciences, Xi’an, China Hong Ao, Xinzhou Li, Yougui Song, Yongming Han,
Xiaoke Qiang & Peng Zhang * Laoshan Laboratory, Qingdao, China Hong Ao & Yongming Han * Research School of Earth Sciences, Australian National University, Canberra, Australia Eelco
J. Rohling & Andrew P. Roberts * Ocean and Earth Science, University of Southampton, National Oceanography Centre, Southampton, UK Eelco J. Rohling * Department of Earth and
Environmental Sciences, University of Michigan, Ann Arbor, MI, USA Christopher J. Poulsen * Department of Earth Sciences, University of Oregon, Eugene, OR, USA Christopher J. Poulsen *
School of Geographical and Earth Sciences, University of Glasgow, Glasgow, UK Tara N. Jonell * British Ocean Sediment Core Research Facility, National Oceanography Centre, Southampton, UK
Diederik Liebrand * Department of Earth and Environmental Sciences, The University of Manchester, Manchester, UK Diederik Liebrand * College of Geology and Environment, Xi’an University of
Science and Technology, Xi’an, China Qiang Sun * School of Earth Sciences, China University of Geosciences (Wuhan), Wuhan, China Xinxia Li * Paleomagnetic Laboratory ‘Fort Hoofddijk’,
Department of Earth Sciences, Faculty of Geosciences, Utrecht University, Utrecht, The Netherlands Mark J. Dekkers Authors * Hong Ao View author publications You can also search for this
author inPubMed Google Scholar * Eelco J. Rohling View author publications You can also search for this author inPubMed Google Scholar * Xinzhou Li View author publications You can also
search for this author inPubMed Google Scholar * Yougui Song View author publications You can also search for this author inPubMed Google Scholar * Andrew P. Roberts View author publications
You can also search for this author inPubMed Google Scholar * Yongming Han View author publications You can also search for this author inPubMed Google Scholar * Christopher J. Poulsen View
author publications You can also search for this author inPubMed Google Scholar * Tara N. Jonell View author publications You can also search for this author inPubMed Google Scholar *
Diederik Liebrand View author publications You can also search for this author inPubMed Google Scholar * Qiang Sun View author publications You can also search for this author inPubMed
Google Scholar * Xinxia Li View author publications You can also search for this author inPubMed Google Scholar * Xiaoke Qiang View author publications You can also search for this author
inPubMed Google Scholar * Peng Zhang View author publications You can also search for this author inPubMed Google Scholar * Mark J. Dekkers View author publications You can also search for
this author inPubMed Google Scholar CONTRIBUTIONS H.A. designed the study and compiled the data. Y.S., Y.H., and X.Q. conducted the fieldwork and contributed to grain size measurement in the
laboratory. X.X.L. conducted the simulations. X.X.L. undertook the spectral analysis. H.A. and X.X.L. made the figures. H.A., E.J.R., X.Z.L., Y.S., A.P.R., C.J.P., T.N.J., D.L., Q.S., P.Z.,
and M.J.D. contributed to data interpretation and/or discussion. H.A. wrote the manuscript, with contributions from all other authors. CORRESPONDING AUTHOR Correspondence to Hong Ao. ETHICS
DECLARATIONS COMPETING INTERESTS The authors declare no competing interests. PEER REVIEW PEER REVIEW INFORMATION _Communications Earth & Environment_ thanks C. J. Berends and the other,
anonymous, reviewer(s) for their contribution to the peer review of this work. Primary Handling Editors: Aliénor Lavergne. Peer reviewer reports are available. ADDITIONAL INFORMATION
PUBLISHER’S NOTE Springer Nature remains neutral with regard to jurisdictional claims in published maps and institutional affiliations. SUPPLEMENTARY INFORMATION DESCRIPTION OF ADDITIONAL
SUPPLEMENTARY FILES PEER REVIEW FILE SUPPLEMENTARY INFORMATION SUPPLEMENTARY DATA 1 RIGHTS AND PERMISSIONS OPEN ACCESS This article is licensed under a Creative Commons Attribution 4.0
International License, which permits use, sharing, adaptation, distribution and reproduction in any medium or format, as long as you give appropriate credit to the original author(s) and the
source, provide a link to the Creative Commons license, and indicate if changes were made. The images or other third party material in this article are included in the article’s Creative
Commons license, unless indicated otherwise in a credit line to the material. If material is not included in the article’s Creative Commons license and your intended use is not permitted by
statutory regulation or exceeds the permitted use, you will need to obtain permission directly from the copyright holder. To view a copy of this license, visit
http://creativecommons.org/licenses/by/4.0/. Reprints and permissions ABOUT THIS ARTICLE CITE THIS ARTICLE Ao, H., Rohling, E.J., Li, X. _et al._ Northern hemisphere ice sheet expansion
intensified Asian aridification and the winter monsoon across the mid-Pleistocene transition. _Commun Earth Environ_ 4, 36 (2023). https://doi.org/10.1038/s43247-023-00686-9 Download
citation * Received: 25 July 2022 * Accepted: 18 January 2023 * Published: 15 February 2023 * DOI: https://doi.org/10.1038/s43247-023-00686-9 SHARE THIS ARTICLE Anyone you share the
following link with will be able to read this content: Get shareable link Sorry, a shareable link is not currently available for this article. Copy to clipboard Provided by the Springer
Nature SharedIt content-sharing initiative