- Select a language for the TTS:
- UK English Female
- UK English Male
- US English Female
- US English Male
- Australian Female
- Australian Male
- Language selected: (auto detect) - EN
Play all audios:
ABSTRACT Induced earthquakes pose a substantial challenge to many geo-energy applications, and in particular to Enhanced Geothermal Systems. We demonstrate that the key factor controlling
the seismic hazard is the relative size distribution of earthquakes, the _b_-value, because it is closely coupled to the stress conditions in the underground. By comparing high resolution
observations from an Enhanced Geothermal System project in Basel with a loosely coupled hydro-mechanical-stochastic model, we establish a highly systematic behaviour of the _b_-value and
resulting hazard through the injection cycle. This time evolution is controlled not only by the specific site conditions and the proximity of nearby faults but also by the injection strategy
followed. Our results open up new approaches to assess and mitigate seismic hazard and risk through careful site selection and adequate injection strategy, coupled to real-time monitoring
and modelling during reservoir stimulation. SIMILAR CONTENT BEING VIEWED BY OTHERS STRESS-DRIVEN RECURRENCE AND PRECURSORY MOMENT-RATE SURGE IN CALDERA COLLAPSE EARTHQUAKES Article 05
February 2024 CONSTRAINING MAXIMUM EVENT MAGNITUDE DURING INJECTION-TRIGGERED SEISMICITY Article Open access 09 March 2021 PROPAGATION OF LARGE EARTHQUAKES AS SELF-HEALING PULSES OR MILD
CRACKS Article 10 March 2021 INTRODUCTION The frequency and detection of induced earthquakes has increased dramatically over the past few decades, leading the scientific community and
industry to become more aware of the issue. Most sources of induced seismicity involve the underground injection or withdrawal of fluid1. Earthquakes have been associated with several human
activities ranging from oil and gas extraction2,3,4 to underground wastewater storage5,6, and even artificial lakes for hydro-power7, tunnelling8,9 and nuclear waste disposal10. Among the
various industrial operations, geothermal exploitation constitutes a promising approach for green energy production, but often requires fluid stimulation to increase the reservoir’s
permeability to create Enhanced Geothermal Systems (EGS11,12). Such stimulation activities, however, are often linked to strong seismic events. Numerous cases around the world have led to
much debate in the scientific community and industry as to whether this technology is really beneficial. Renowned examples are: _M_ 2.9 in Soultz-sous-Forêts (2003, France)13, _M__L_ 3.4 in
Basel (2006, Switzerland)14 and _M__w_ 5.5 in Pohang (2017, Republic of Korea)15; but other geothermal exploitation schemes are not exempt from damaging induced earthquakes, as a recent
sequence in Strasbourg culminating in an _M__L__v_ 3.6 shows (2019–2021, France)16. The occurrence of induced earthquakes of potentially large magnitude requires the development of
strategies and tools to mitigate the hazard posed by EGS stimulations17,18. Numerical models constitute the basis for the most advanced tools proposed to understand, forecast, and mitigate
the hazard and risk accompanying geothermal stimulations. Multiple classes of models have been used to investigate fluid induced seismicity19, from the purely statistical20,21,22 to the
fully coupled thermo-hydro-mechanical23,24,25. Hybrid models strive to combine the strength of both approaches, using the velocity of statistical methods, and the complexity of the principal
physical processes26,27,28,29,30,31. A fundamental aspect of induced seismicity mitigation relies on linking modelling results and risk/hazard calculations32,33,34. Numerical models can
also investigate the impact of injection scenarios on the risk posed by induced seismicity31,35,36,37. In this study we use the capabilities of a loosely coupled hydro-mechanical-stochastic
model – TOUGH2-Seed38 – to investigate how seismicity is affected by the presence of a major fault zone and to understand if a different injection strategy may help with predicting the
potential hazard. To assess an injection scenario, we follow a simple metric: the evolution of the Gutenberg–Richter _b_-value39, describing the relative size distribution of earthquakes,
during both injection and post-shut-in phases. This approach allows us to go beyond statistical models that aim to simulate the rate/number of events (_λ_ or the Gutenberg-Richter
_a_-value)32,40,41 by modelling both the _a_-value and _b-_value. The approach is based on the assumption that the _b_-value is a proxy for the state of stress in the subsurface: indeed,
several studies have shown that the _b_-value is sensitive to the state of stress (inverse dependence observed both in laboratory42,43,44 and field45,46 studies). Modelling both the number
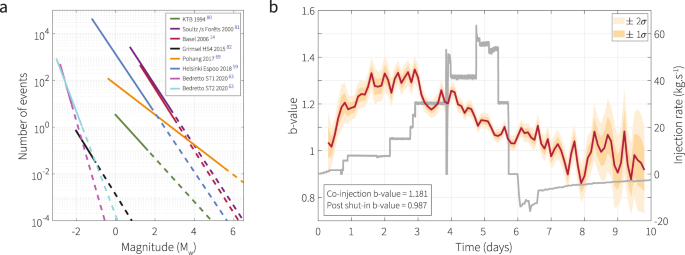
of events and the _b_-value provides an additional proxy for seismic risk47,48. Indeed, the _b_-value is the true driver behind the level of risk/hazard as highlighted in Fig. 1a: for a
comparable _a_-value, Pohang and Basel have vastly different probabilities of a magnitude 6 occurring. Usually, the probability of occurrence of a large event is used with a fixed _b_-value
calculated for a region, as the _b_-value shows variability depending on the tectonic context (Fig. 1a). However, more recent studies with high-resolution catalogues, both in natural
contexts49,50 and in induced seismicity contexts5,51, have shown that the _b_-value changes through time and space within a given region due to additional forcing (e.g. other earthquakes or
fluid injection). These changes in the _b_-value (both spatial and temporal evolution) have been shown to help with the forecasting of larger events: the _b_-value tends to increase after a
main shock and during the aftershock sequence49. However, it has been observed that in the case of doublets, the second event can be preceded by a decrease in the _b_-value (compared with
the background) and a Traffic Light System based on _b_-value variation to understand when the hazard has passed has been suggested50. Thus, the _b_-value can be used as a proxy for average
stress conditions and as a tool for risk mitigation to discriminate between a typical aftershock sequence and a precursory sequence. In the case of induced seismicity in Basel, initial
studies showed how the _b_-value dropped significantly after shut-in21, but with a high-resolution catalogue51, the _b_-value is actually observed to drop days before the shut-in and the two
largest events (_M__L_ 2.9 during injection and _M__L_ 3.4 a few hours after shut-in14). Figure 1-b shows the evolution of the _b_-value in time in Basel using a high-resolution catalogue51
with a fixed time windows of 0.2 days. Supplementary Fig. S1 presents a more complete analysis of evolution of the _b_-value, number of events above completeness and magnitude of
completeness in time for the Basel case. The variability in the _b_-value during the injection and a sharp drop around day 3 have been thought to be linked to pore-pressure perturbations and
a change in the growth behaviour of the seismic cloud. These changes in the _b_-value during and after the active injection phase suggests that the injection activity can somehow influence
the state of stress and the _b_-value as a consequence. In light of this observation, in this study we attempt to model a simplified Basel-like injection (with injection rates increasing in
steps) to understand the physical mechanisms driving the changes in the _b_-value. We then test different injection strategies in an ideal EGS setting, delineating which scenario is more
prone to show a potential hazard in the early stages of injection, in order to provide relevant insights for operators. RESULTS AND DISCUSSION In order to reproduce a typical EGS system and
simulate an earthquake catalogue resulting from stimulation, a TOUGH2-Seed model is defined as a simple 4-km-deep injection placed in a 1.5 × 1.5 km reservoir with 2 km of thickness centred
around the injection. The potential hypocentres (aka seeds) are randomly distributed within this physical volume, a set of stochastic realisations being used each time to account for this
randomness aspect. Details of the model implementation can be found in the Methods section. A base case simulation expands on previous modelling of a Basel-like setting27, with the addition
of pressure-dependent permeability changes and an extension of the geomechanical model with a full 3D stress tensor formulation. We use a linear relationship between _b_-value and
differential stress52, adapted to fit the amplitude of the _b_-value observed in Basel (Fig. 1b51; see the Methods section for more details). Cold water is injected for 5 days with the rate
increasing from 10 kg⋅s−1 to 60 kgs−1. The step-increasing injection pattern is chosen to represent a classical approach to injections for EGS with rates similar to those injected in Basel14
(Fig. 1b). The shut-in occurs after 5 full days of injection, and we model the evolution up to a total of 10 days. On top of this homogeneous base case, we also look into a reservoir
containing a major fault zone close to the injection, similar to the fault observed in Basel, where seismicity started aligning a few days into stimulation53. Indeed, fault zones represent
high-risk features capable of fostering large events and often go undetected by initial assessments of the site. A fault zone is simulated by changing both hydraulic (i.e. permeability) and
geomechanical properties (i.e. density of seeds, _b_-value). More details can be found in the Methods section. HYDRAULIC AND SEISMOLOGICAL RESPONSE TO A STEP-INCREASING STIMULATION Figure 2
presents a summary of the output of the base case model, with the evolution of the pressure and permeability changes at different monitoring points (solid lines in panels a and b
respectively) and a map view of the pressure changes and the density of seismicity averaged over 48 realisations (panels c and d; Supplementary Fig. S2a shows the density of seismicity with
depth). The evolution of the pressure at different monitoring points (Fig. 2a) shows an initial sharp pressurisation close to the injection and further gradual pressurisations happening over
time with the propagation of the pressure front and the surge in pressure associated with increases in the injection rate. The permeability follows a similar pattern with an initial
enhancement followed by successive increases after the injection rate increases, with each monitoring point further from the injection seeing a similar pattern, albeit with a delay (Fig.
2b). In terms of the spatio-temporal distribution of the seismicity, a time-distance from injection plot presented in Supplementary Fig. S3a allows us to see previously observed and modelled
characteristics, with a clustering of higher _b_-value events close to injection indicative of events occurring in previously reactivated/stimulated areas27, and the classical triggering
and back fronts of seismicity40 indicative of pore pressure propagation in the system. Furthermore, Fig. 2d gives a stacked and normalised view of the distribution of the seismicity in a 2D
horizontal slice centred on the injection. The central region shows a dense seismic cloud, which gradually fades further away from the injection. The comparison of the pressure perturbation
extent (Fig. 2c) and the average seismicity cloud (Fig. 2d) show that the seismicity is limited to the confines of the relatively highly pressurised zones. The dashed lines in panels a and b
of Fig. 2 present the evolution of the pressure and permeability changes for the fault case, while panels e and f show a map of the pressure changes and of the density of seismicity
averaged over all realisations, respectively. The evolution of the pressure over time remains identical except for the monitoring point located 100 m from injection, as this monitoring point
is located at the fault. The hydraulic fault accommodates more pressure and changes the distribution of pressure (Fig. 2e). The distribution of the seismic cloud follows the distribution of
the pressure perturbation and shows that both the areas close to the injection and the central part of the faults exhibit high densities of seismicity. The time-distance plot in
Supplementary Fig. S3b shows a dual behaviour of the seismicity and highlights the different hydraulic diffusivity of the fault with clearly distinct triggering and back-fronts of
seismicity. The evolution of the permeability over time is mostly unaffected by the presence of the fault with the exception of the region in its immediate vicinity (Fig. 2b dashed lines).
The average number of events for this fault case is similar to the previous case (referred to as the homogeneous case; see Table 1). Figure 3 presents the evolution of the _b_-value and the
hourly _a_-value (as described in the Methods section) in the top two panels for the homogeneous and fault cases. Both variables see an increase following each change in the injection rate:
a systematic pulse-like variation for the _b_-value and an increase followed by a stable plateau for the _a_-value. The variation in the _a_-value is simply due to the change in the
pressurisation rate in the system: the higher the flow rate, the higher the pressure, and so the stronger the pressure changes at the propagating front, resulting in a larger number of seeds
reactivated. The variation in the _b_-value is associated with the intrinsic relationship between the _b_-value and the differential stress: as a seed is reactivated, the differential
stress decreases (due to stress drop) and as a consequence the _b_-value increases. The peaks of the _b_-value are then associated with previously reactivated seeds (i.e. events occurring in
already stimulated regions). Such repeating events are simply caused by the change in flow rate and pressure, causing the already activated seeds to reactivate again at a new, higher
pressure. Figure 3c shows the temporal evolution of the average distance from the injection of the reactivated seeds (labelled ’average distance’), clearly showing a dip after each change in
the injection rate, thus showing that seeds closer to the injection get reactivated and drive the _b_-value up following a change in the injection. The vertical distance (labelled ’average
depth’) does not change substantially, hence confirming that changes in the _b_-value are associated with dynamic changes in the system rather than its initial conditions (i.e. initial
stress distribution). For the homogeneous case, the overarching trend in the evolution of the _b_-value (and the _a_-value) shows a fast increase from the start of the injection followed by
a plateau (if we disregard the pulses driven by repeating events). The shut-in or arrest of injection is followed by a decay of the _b_-value, which decreases to the natural state of the
system. Figure 3d illustrates this natural state (dark) and the higher co-injection _b_-value distribution (light), driven up by repeating events. Using a T-test to evaluate the
distributions of _b_-values co-injection and post-shut-in, we confirm the statistically significant difference of the _b_-value during and after the injection phase with a p-value of
1.95e-4. A case without allowing for previously stimulated regions to be reactivated, or with no stress changes, would result in a similar statistic as the natural post-shut-in (dashed lines
in Fig. 3d). Figure 3e presents the frequency-magnitude distribution of two subsets of 200 events at 4 days (co-injection) and 8 days (post-shut-in), illustrating the influence of a
changing _b_-value on the frequency-magnitude distribution. Compared with the observed _b_-value in Basel51 seen in Fig. 1b, the homogeneous case in Fig. 3a does show a higher _b_-value
during the injection with a decay following the shut-in, but in the observed data for Basel, the decrease in the _b_-value occurs two to three days before the shut-in happens. Such a
decrease in the general _b_-value_b_-value trend is observed in the fault case (Fig. 3a), suggesting that the observed behaviour in Basel is linked to the presence of the a-posteriori mapped
fault53. This drop in _b_-value in Basel from day 3 has been correlated to a shift from a three-dimensional spread of the seismic cloud to a two-dimensional growth aligned with the main
fault51. This fault case displays a lower natural state of the system in the post-shut-in phase, due to the assumption that a fault zone has the potential for larger earthquakes (hence a
lower _b_-value). The fault case shows the dip in the _b_-value once the fault starts being reactivated (at _t_ = 1.3 days). This seems to tie in with the previous speculation made for Basel
that the _b_-value trend changes once events align on the fault. It is worth mentioning that the synthetic fault simulated here does not get reactivated at a similar time to the one in
Basel, as it is located closer to the injection point. The extremely similar behaviour of the _a_-value (Fig. 3b) between the homogeneous and fault cases strongly suggests that the _b_-value
is the main driver of risk/hazard, since the number of occurring events does not diverge in time between the cases. INFLUENCE OF THE SITE The observed _b_-value varies widely between
regions, thus has an impact on the risk (Fig. 1a). In Fig. 4, the same injection scenario is tested on different site conditions characterised by a local stress change from a more critically
stressed site (corresponding to a lower intrinsic _b_-value here (lighter)) and a less stressed target site (with a higher intrinsic _b_-value (darker)). Figure 4a shows the evolution of
the _b_-value for the base case and the two different state of stress cases, and Fig. 4b depicts the derived cumulative probability of a magnitude _M_ ≥ 3.5 (as described in the Methods
section). These cases show the importance of the initial state of stress of the target site in terms of risk. It is evident already that the regional _b_-value drives the hazard (and risk)
and must be considered as the first-order element. However, the regional _b_-value is not easy to identify, especially in regions with low seismicity rates. Hence the importance of
second-order variations, i.e. where the _b_-value changes with the injection, which could play an important role in identifying potential hazardous sites in the early stages of an injection.
INJECTION STRATEGIES While the risk is in general driven by local factors (i.e. low regional _b_-value and/or the presence of a fault), second-order effects on induced seismicity are
clearly linked to the operational parameters (cumulative injected volume, injection rate, duration of injection)31,35,54,55. We devise three more injection strategies with the same total
injected volume as the base case and test them using the same framework, both with and without a fault. Figure 5 presents the new injection strategies (linearly increasing, constant-rate and
cyclical injections) alongside the base-case step-like injection. The onset of the fault reactivation (i.e. the average occurrence time of the first event occurring on the fault patch) is
marked by a vertical dashed line, and the intrinsic _b_-value (i.e. the natural state of the system stabilised post-injection) as a horizontal dashed line for each injection strategy. We
calibrate each model to reproduce a similar number of events to make the results comparable. Table 1 summarises the average number of events and the delta of the _b_-value between the
co-injection and the natural state of the system for each injection strategy (thereby providing a quantitative overview of what Fig. 3d shows graphically for the homogeneous base case). The
constant injection scenario presents the lowest increase in the _b_-value during the injection, while strategies with a temporal increase in the injection rate (step- and linearly increasing
scenarios) show much higher differences between the co-injection and post-shut-in _b_-values. Figure 5b, c show that the constant and linearly increasing strategies have the biggest
differences between the homogeneous and fault cases. Figure 5d shows that the cyclical injection makes it possible to get a preview of the natural state of the system post-shut-in early on
in between the injection phases, similar to a test injection. This style of injection pattern would enable an early decision to be made on whether the risk associated with the project was
worthwhile. In Fig. 6, the cumulative probability of occurrence of a magnitude of at least 3.5 is presented for all injection strategies, for both without (solid lines) and with a fault
(dashed lines). With the probability of occurrence _P__o__c__c_ we quantify the hazard posed by the strategies, and show that the fault cases are, as expected, riskier than the homogeneous
cases due to their lower intrinsic _b_-value. We also see that the constant and cyclical injections are riskier than the increasing rates. The cyclical injection is distinguished from the
others by clearly displaying three plateaus corresponding to the relaxation after the three injection phases. We did not consider the fatigue effect, which could substantially reduce the
number of induced events (_a_-value) and hence result in a lower hazard. OPERATIONAL INJECTION SCENARIOS’ INFLUENCE ON SEISMICITY Previously conducted sensitivity tests of different
injection strategies and site-specific parameters on the seismicity and in particular on the simulated catalogue’s _b_-value concluded that the injection strategy does not have much of an
impact on the overall _b_-value of the induced seismicity37. We find that the _b_-value averages over the whole simulation are indeed similar for all tested injection strategies, but that
the _b_-value is dynamic and its evolution over time during the injection is largely influenced by the injection pattern (Fig. 5). Site-specific parameters (permeability, hydraulic
properties of the host rock, density of fracture and stress conditions) have also been identified as having a wide-ranging effect on the simulated seismicity37. We show in the current study
that the presence of a fault, which concentrates all of these site specificities, has a major impact on the behaviour of the seismicity and the _b_-value. Cyclical stimulation treatments
have been shown in hydro-fracturing cases to provoke mechanical and hydraulic fatigue of the rock mass by allowing for stress relaxation in between cycles56. So-called soft stimulation
(repeated cyclical injections) tested in hydro-fracking settings yield better hydraulic performances despite their lower seismic efficiency by submitting the rock mass to fatigue due to
repeated loading cycles, eventually resulting in fewer post-shut-in seismic events56,57,58. When tested in an EGS setting, such soft stimulations have had mixed results, with great successes
in Helsinki59 but less desirable consequences when combined with other stimulation techniques in Pohang15,60. Linking operational parameters like the injection rate and hazard/risk is a
necessary step to go beyond comparative analysis of injection-induced seismicity. We propose using transient _b_-values as a diagnostic tool able to provide a robust risk assessment early on
in prospective projects. In line with our conclusions, systematic injection tests (“Seismogenic Fault Injection Test”) have been proposed recently to assess the seismogenic index40, the
_b_-value, and the decay rate of the post-shut-in seismicity34. Theses systematic injection tests are suggested to be conducted using a cyclical injection pattern to get repeated
measurements of these target parameters. In the same context of linking the injection rate and hazard/risk, a recent study31 looked into the Basel case14 and tested alternative scenarios
with a hybrid model to compare not only the direct output of the model but also the calculated risk posed by the alternative scenarios. With our study, we show that, although secondary to
site conditions, the chosen injection scenario does make a difference to the overall risk/hazard posed. However, such a risk/hazard must also be compared with the benefit of a stimulation.
The estimation of the stimulated volume (i.e. the volume of the reservoir seeing a large permeability enhancement) is for now left to future endeavours, as our current model set-up only
accounts for reversible pressure-dependent permeability changes. The TOUGH2-Seed framework does allow for the consideration of irreversible permeability changes (driven by slip38), and this
aspect could be potentially explored in future work. Other important effects could be related to temperature as well as potential chemical effects. USING THE _B_-VALUE FOR NEAR-REAL-TIME
HAZARD ASSESSMENT AND FORECASTING Managing the risk posed by induced seismicity requires setting and enforcing regulatory measures to limit nuisance to the general public and potential
damage. Traffic Light Systems have been widely adopted as risk mitigation method that is easy to implement and follow, with advantages and limitations discussed in recent years18. In
general, three levels are set out in the protocol: green (where the operator is allowed to proceed unrestricted), yellow/orange/amber (where mitigation measures are required in response),
and red (suspending all operations and potentially prompting bleed-offs and capping measures). The set limits for the thresholds have been based on recorded magnitudes, PGV or PGA (peak
ground velocity or acceleration) depending on the project, and are usually calculated based on a preliminary risk assessment of the project. This simple regulatory control does not require
there to be updates during the lifetime of the project/phase and remains limited in its efficiency. Monitoring the evolution of parameters important to the risk assessment (e.g. the
_a_-value and the _b_-value) in near real time would make it possible to update the risk assessment and thresholds. Moreover, the use of numerical modelling in decision modules when
determining thresholds and regulatory measures has the power to introduce game-changing technologies. New approaches are being developed, where seismic data are fed into multiple models -
from purely statistical to fully physical - which are then weighted and evaluated to provide robust ensemble forecasting of induced seismicity that can then be computed into hazard and
operational control29,33,34,61,62. Such a chain from seismic data acquisition and geomechanical modelling to risk analysis and operational decision is integrated within an Adaptive Traffic
Light System18,26. The concept of Adaptive Traffic Light System has been tested both retrospectively on data from Basel61, and in real time during a well stimulation in Geldinganes
(Iceland)32 and is currently being tested as part of the Bedretto lab63 and Forge Utah projects64. Multiple studies have assumed different scenarios of early injection arrest with
statistical and simple hybrid models to produce pseudo-forecasts of the seismicity31,55,61,65. Such approaches did not look into changes in the _b_-value, despite recorded observations21,27.
Although physical models can outperform statistical ones in probabilistic earthquake forecasting exercises66, the amount of computational time and power they require makes them unsuitable
for near-real-time applications. Similarly, Epidemic Type Aftershock Sequences (ETAS) type models with dozens of parameters to invert at each time step are better suited to replays and
pseudo-forecasting endeavours. For near-real-time applications, simplified models are preferred, and although they individually have their own shortcomings, ensemble modelling and weighting
can provide a robust forecast32. Such models include variations of the Seismogenic Index type model40,41, modified approaches to account for spatial variability introduced by the geology67,
or analytical solutions for simplified hybrid models31. Our proposal to monitor the _b_-value’s evolution over time could be used as a simple metric that provides fast-paced information with
implications for risk. Large numbers of events within highly complete catalogues extracted through template matching methods can increase the predictive power by tracking fine-scale changes
in the spatial distribution and stress field66. In a similar way, we suggest that using the _b_-value evolution in near-real-time could allow us to detect deviations and changes in the
stress conditions or even detect seismicity aligning on a fault before lineaments can be seen in the cloud of seismicity. This monitoring of the _b_-value, however, requires robustly
generated magnitudes and generous catalogues recorded and generated in near-real-time to provide trustworthy signals from the underground68. MAXIMUM SIZE OF INDUCED SEISMICITY In order to
move towards safer industrial underground operation, one needs to understand what governs the size of induced earthquakes. For a given regional tectonic context, the injected volume seems a
logical first-order control on induced seismicity, and observations tend to agree in wastewater disposal5 and hydro-fracturing67 cases. Some models based on a direct control of the volume on
the number of events have been proposed41 and used in near-real-time32 or to introduce risk informed thresholds29. The injected volume can play a tremendous role on the size of the
seismicity (Supplementary Fig. S7). In this study, we chose to look beyond this first-order control with constant injection rates for all the cases presented in this study. Indeed, the
example of Pohang (2017, South Korea) demonstrates that there is more than just the volume at play, with only a fraction of the expected needed volume injected for an earthquake of magnitude
_M__w_ 5.515,69. So far, attempts at binding the maximum magnitude of operations have gone in two directions: on the one hand focusing only on the volumes or rates of fluid70,71, and on the
other hand looking into the seismicity catalogue statistics72. Both approaches give broad estimates for the range of the maximum magnitude and could provide valuable near-real-time insights
by taking into account temporal changes of the _b_-value and injection volumes during operations. Other models are being developed to take into account the physics of an arresting
rupture73, frictional behaviours, and the evolution of the injection rate74. In terms of quantifying the size of an induced seismicity sequence, statistical laws give us some clues as to how
and when a sequence stops. Both Omori and Båth’s laws for aftershock decays have been adapted to induced seismicity, as well as other statistical decay rates34,75. A recent study found that
a modified Båth’s law accounting for injected volume can estimate the statistical decay of induced sequences34. The shut-in phase allowing for estimation of decay times and investigating
diverse shut-in patterns would constitute an important next step. The influence of the stress conditions (and thus the _b_-value) on the nucleation and decay times has also been
highlighted76, suggesting once again the paramount importance of monitoring the _b_-value evolution for a careful risk assessment. RELATIONSHIP BETWEEN _B_-VALUE AND STRESS As shown in
laboratory experiments42,43,44, the Gutenberg-Richter _b_-value seems to be correlated with the stress conditions in the medium. Observations of a relationship between _b_-value and pore
pressure in induced seismicity sequences show a direct proportionality in the Denver earthquake sequence77, and this is supported by a _b_-value for high-pressure injections in geothermal
reservoirs that is higher than the regional average28. The correlation between the stress regime and the _b_-value suggests a control of the faulting regime by the differential stress (and
thus by the confining pressure)45,46. The _b_-value has been interpreted as a stress-metre in the Earth’s crust, and heterogeneities in the mapping and evolution of the _b_-value must be
taken into account when performing hazard or aftershock analysis50. The inverse relationship between the _b_-value and differential stress has been observed at all scales, from laboratory
samples to mega-ruptures, and holds true across stress regimes, regions and depth ranges46. This scale invariance and permanency in the relationship between the _b_-value and stress suggests
that transient _b_-values can only be explained by long-term changes in the stress state of the medium, as observed after a major earthquake49. Transient changes in the stress field
constitute a second-order effect, and, while important to consider, they do not fully control the hazard. As we have shown in Fig. 4, the site-specific stress conditions play a major role in
the intrinsic risk. Recently, a unified solution has been proposed to explain both the depth and stress regime dependencies, going as far as to propose a global analytical relationship
between differential stress and the _b_-value46,52. We approach the modelling of the _b_-value from this global context, adapting the analytical solution to fit observations made in Basel51.
The ability of our model with fault to reproduce both the initial increase and then the decrease in the _b_-value_b_-value days before shut-in suggest that the observations made in Basel
can be explained by the injection strategy and the presence of a fault. Furthermore, the agreement between the observations from Basel and our model reinforces the importance of accounting
for a relationship between the _b_-value and stress in general for a better understanding of the physics behind induced seismicity sequences. This direct relationship between stress and the
_b_-value highlights the importance of monitoring the _b_-value before, during, and after stimulation operations to use it as a risk-metre. However, no direct observation has yet provided
conclusive evidence, as stress measurements in real-time remain out of reach. CONCLUSION In this study we use a hybrid modelling approach - TOUGH2-Seed - to simulate stimulation injections
into tight rock in an effort to approximate an EGS, and provide a hypothesis explaining the observed transient _b_-value in Basel51. We use the Gutenberg-Richter power-law parameters as a
transient proxy for risk. In this we go beyond traditionally used statistical models in providing simulation results with both the number of events but also their power-law distribution. We
show that the choice of injection strategies impacts the transient _b_-value and thus risk during the injection phase. Furthermore, we show in a quantitative and objective way that the
presence of a hydraulic and seismogenic fault plays a major role in the hazard/risk associated with injection operations. In parallel to event localisation, monitoring the evolution of the
_b_-value over time may enable detection of such a fault prior to major events and could lead to operational techniques noticing a deviation from an expected _b_-value pattern. Finally, the
Gutenberg-Richter _b_-value could provide an image of permeability changes in the subsurface, given that more permeability changes accommodate and allow more pressure build-up, as seen when
comparing our homogeneous and fault cases. The presence of a more permeable feature such as a fault can indeed be detected early on with a decrease in the general _b_-value trend or a
deviation from the expected _b_-value trend. Real-time monitoring of the _b_-value, coupled with rapid seismic relocation techniques, could help to detect changes in the hydraulic response
of the system (i.e. permeability changes leading to pathway creation mapped through seismicity lineaments and cloud geometry changes detectable in decreasing _b_-values). METHODS TOUGH2-SEED
TOUGH2 is a commercial software providing full 3D, multi-phase and multi-component flow simulation78. We couple TOUGH2 to a 3D geomechanical-stochastic seed model28,55. The approach
accounts for 3D stress fields and allows us to distribute potential hypocentres (with strike, dip, and rake) in the medium. Once coupled, the hybrid TOUGH2-Seed model38 allows for reversible
permeability changes dependent on pore pressure variations. TOUGH2-Seed relies on a Mohr-Coulomb failure criterion evaluating seed reactivation at each time step: The effective normal
stress (\({\sigma }_{n}^{eff}\)) on the seeds is changed by the pore pressure, if this this change of \({\sigma }_{n}^{eff}\) is enough to exceed the critical shear stress (referred to as
shear strength), the seed is reactivated. Additional physical phenomena (e.g. irreversible shear-based permeability enhancement and earthquake-earthquake interaction through Coulomb static
stress transfer) are available in TOUGH2-Seed but not used in this study. More details about the various physical mechanisms available can be found in Rinaldi & Nespoli, 201738.
TOUGH2-Seed38,79 has shown promising capabilities for different geothermal settings from hydrothermal field scale (Hengill, Iceland79) to complex hydrothermal systems involving a gas phase
(Sankt Gallen, Switzerland30), and EGS (Basel, Switzerland38). Our hybrid model is made up of a deterministic TOUGH2 part which is run beforehand on a single core machine to get a pressure
and temperature solution; and of a stochastic Seed part coded in MATLAB. We run the model uncoupled from the pressure solution as a static input to the Seed model. This code is run on an LFS
(Load Sharing Facility) cluster for 48 realisations on 48 cores and takes roughly 30 min of parallel computation time for a 10-days simulation with ~500 time steps and 210.000 seeds. We
used 48 realisations given that a larger number of simulations will result in a similar statistical variation in the _b_-value (see Supplementary Fig. S9). ASSIGNMENT OF THE _B_-VALUE TO
SEEDS The geomechanical Seed model contains a full 3D formulation of the stress tensor, and each seed is thus assigned an initial stress condition. Both lab and field evidence shows a linear
relationship between differential stress and the _b_-value. We use a linear relationship similar to the one proposed by Scholz52, adapted to fit the amplitude of the _b_-value observed in
Basel (Fig. 1b51): $$b=2.8-0.02{\sigma }_{diff}$$ (1) Equation (1) was calibrated using the maximum amplitude of the _b_-value observed in Basel and fitted to the range of differential
stress in the modelled reservoir. Supplementary Figs. S4 and S5 show the spatial distribution of the change in _b_-value for the base and fault cases respectively. STRESS DROP AND
DIFFERENTIAL STRESS MODELLING The stress conditions on any given seed can be modified by pore pressure and reactivation. Upon reactivation of a seed, a stress drop is applied and the stress
tensor on the seed recalculated, allowing the _b_-value of this seed to change. The applied stress drop is calculated to be a fraction of the normal stress on the seed (see the stress-drop
factor in Table 2). The stress drop is also distributed in the calculated rupture area of the initially reactivated seed, allowing neighbouring seeds to also see their stress conditions, and
thus their _b_-value change. These changes in stress drive the changes in the _b_-value, in particular when a seed gets reactivated and subjected to a stress drop more than once, leading to
its differential stress decreasing and its intrinsic _b_-value increasing. The assumption of a stress drop distributed over the rupture area or punctual only on the seed does not affect the
overall earthquake statistic (see Supplementary Fig. S10). In Supplementary Fig. S10, we test two approaches to model the stress drop: one local applied only to the reactivated seed, and a
distributed stress drop that affects neighbouring seeds. This second approach aims at simulating a rupture area for each event. The extent of the rupture area is based on the average
expected magnitude from the power law distribution with the _b_-value of the given seed. Both approaches give very similar results for comparable cases (with/without a hydraulic fault). The
distributed approach is more realistic and allows us to release the stress in a region around the given event. In the distributed case, the stress drop occurs within a radius defined by the
magnitude of the reactivated seed. Equation (2) details the calculation of the rupture area according to Brune’s model, with _M_0 the seismic moment calculated from the picked magnitude (Eq.
(3)), and Δ_τ_ is the stress drop applied to the reactivated seed. $${R}_{eq}=\sqrt{\frac{7}{16}\frac{{M}_{0}}{\Delta \tau }}$$ (2) $${M}_{0}=1{0}^{\frac{3}{2}M+9.1}$$ (3) SETUP AND
PARAMETERS OF THE MODEL - BASE CASE The model comprises a 4-km-deep injection placed in a 1.5 × 1.5 km reservoir with 2 km of thickness centred around the injection point. The injector is
placed in the centre of the volume. The mesh consists of Cartesian blocks of 100 m by 100 m by 100 m and is refined in the centre to 25 m × 25 m horizontally and 50 m in depth. The stress
and fluid conditions are selected to be as generic as possible, making use of the average crust model for stress conditions27; a summary of the principal simulation parameters can be found
in Table 2. Cold water is injected for 5 days, with varying rates for the different injection strategies (inlets in Fig. 5). SETUP AND PARAMETERS OF THE MODEL - FAULT CASE To the base model
a vertical-dipping hydraulic fault striking 155∘N is added (to match the observed fault reactivated in Basel). The total number of seeds in the domain is kept identical (at 210,000 seeds)
with a subset of 20,000 seeds now distributed on the permeable fault. The fault case comprises multiple layers of complexity, with a hydraulic expression in the TOUGH2 model, a specific
population of seeds having a characteristically lower _b_-value. The hydraulically conductive fault zone is added to the homogeneous case by setting a higher permeability (1.0 ⋅ 10−15_m_2)
to specified cells in the TOUGH2 mesh. These cells fall within a 1 km by 1 km vertical plane, with 25 m of thickness located at a distance (100 m) from the injection. The pressure
distribution in the system is changed by this high permeability feature (see Fig. 2c, e for comparison). All the steps in the fault build-up are documented in Supplementary Fig. S11.1, with
the number of events are _b_-value drop reported in Supplementary Table S2. The influence of the fault permeability on the transient _b_-value is shown in Supplementary Fig. S11.2. The fault
zone is assigned a population of seeds with a higher density than the rest of the domain (20,000 seeds on the fault, 190,000 in the homogeneous domain). Seed strike orientation and fault
orientation/stress rotation so that seeds on the fault are optimally oriented for reactivation in a Mohr-Coulomb style failure domain. Faults tend to have different rupture behaviours from
the host rock. This is mostly seen as faults having a different stress state from the surrounding intact rock. The stress tensor on the fault cannot be changed directly as this would
introduce a discontinuity in the stress field into our model. To simulate this fault-specific state of stress, we use the _b_-value (direct proxy for differential stress) and coefficient of
friction of the seeds contained in the fault zone. Thus, the fault zone is made more seismogenic than the rest of the domain in two steps. First, the initial _b_-value of the seeds on the
fault is lowered by 20% compared with the host-rock seeds (increasing the likelihood of larger events). This lowering of the _b_-value for highly clustered seeds naturally decreases the
overall _b_-value. Second, the coefficient of friction of the fault’s seeds is lowered by 20% to weaken the fault (making the seeds on the fault easier to reactivate and allowing seeds
further from failure to get reactivated). This last step has the twin effect of not only reactivating newer or more intact seeds but also resulting in more repeater seeds, hence the relative
increase in the _b_-value compared with the previous step. Supplementary Fig. S11.3 also presents the case of a fault located further from injection (at 200 m). For the fault case, we chose
the hydraulic fault with lowered _b_-value located 100 m from the injection. CALCULATION OF A- AND _B_-VALUE EVOLUTION IN TIME For each realisation, the _b_-value is averaged in bins of 0.2
days (moving window with a 0.1-day increment). Each realisation’s time series can be seen with each thin line in Supplementary Fig. S6-a. The time series of _b_-values are then averaged
over the 48 realisations to compute the preferred _b_-value (see the thick line in Supplementary Fig. S6a, and analysis of the computation of the uncertainty margin in Supplementary Fig.
S12). The _a_-value is calculated in the same time intervals and normalised to obtain the hourly _a_-value (see Fig. S6b). CALCULATION OF PROBABILITY OF OCCURRENCE For each realisation, the
_b_-value is averaged in bins of 0.2 days, without any overlap, and the _a_-value corresponding to that time window is normalised to an hourly _a_-value. The time of recurrence (_T__r_) and
the probability of occurrence (_P__o__c__c_) for an event of magnitude _M_ or above, is then calculated using the normalised _a_-value and the time series of the _b_-value with Equation (4)
and Equation (5)48. The final probability of occurrence is then averaged over the 48 realisations (see the thick line in Supplementary Fig. S6c) and summed up to get the cumulative
probability of occurrence (Supplementary Fig. S6d). $${T}_{r}(M)=\frac{1}{1{0}^{a-bM}}$$ (4) $${P}_{occ}(M)=1-{e}^{\frac{-1}{{T}_{r}(M)}}$$ (5) Supplementary Fig. S8 presents the extension
of Fig. 6 to higher magnitudes. DATA AVAILABILITY The template-matched catalogue for Basel is available as a supplementary with Herrmann et al., 2019 https://doi.org/10.1029/2019JB017468.
The output data of the TOUGH2 models are available in the ETH Reseach Collection: https://doi.org/10.3929/ethz-b-000567594. CODE AVAILABILITY The Seed model code needed to reproduce the
results presented here is available in the ETH Reseach Collection: https://doi.org/10.3929/ethz-b-000567594. REFERENCES * Ellsworth, W. L. Injection-induced earthquakes. _Science_ 341,
1225942–1225942 (2013). Article Google Scholar * Zbinden, D., Rinaldi, A. P., Urpi, L. & Wiemer, S. On the physics-based processes behind production-induced seismicity in natural gas
fields. _J. Geophys. Res.: Solid Earth_ 122, 3792–3812 (2017). Article Google Scholar * Bourne, S. J., Oates, S. J. & van Elk, J. The exponential rise of induced seismicity with
increasing stress levels in the Groningen gas field and its implications for controlling seismic risk. _Geophys. J. Int._ 213, 1693–1700 (2018). Article Google Scholar * Hough, S. E. &
Page, M. Potentially induced earthquakes during the early twentieth century in the Los Angeles Basin. _Bull. Seismol. Soc. Am._ 106, 2419–2435 (2016). Article Google Scholar *
Langenbruch, C. & Zoback, M. D. How will induced seismicity in Oklahoma respond to decreased saltwater injection rates? _Sci. Adv._ 2, e1601542 (2016). Article Google Scholar *
Weingarten, M., Ge, S., Godt, J. W., Bekins, B. A. & Rubinstein, J. L. High-rate injection is associated with the increase in US mid-continent seismicity. _Science_ 348, 1336–1340
(2015). Article CAS Google Scholar * Rinaldi, A. P. et al. Combined approach of poroelastic and earthquake nucleation applied to the reservoir-induced seismic activity in the Val d’Agri
area, Italy. _J. Rock Mech. Geotech. Eng._ 12, 802–810 (2020). Article Google Scholar * Husen, S., Kissling, E. & von Deschwanden, A. Induced seismicity during the construction of the
Gotthard Base Tunnel, Switzerland: hypocenter locations and source dimensions. _J. Seismol._ 17, 63–81 (2013). Article Google Scholar * Rinaldi, A. P. & Urpi, L. Fault reactivation
induced by tunneling activity in clay material: Hints from numerical modeling. _Tunn. Undergr. Space Technol._ 102, 103453 (2020). Article Google Scholar * Urpi, L., Rinaldi, A. P.,
Rutqvist, J. & Wiemer, S. Fault stability perturbation by thermal pressurization and stress transfer around a deep geological repository in a clay formation. _J. Geophys. Res.: Solid
Earth_ 124, 8506–8518 (2019). Article Google Scholar * Majer, E. L. et al. Induced seismicity associated with Enhanced Geothermal Systems. _Geothermics_ 36, 185–222 (2007). Article Google
Scholar * Olasolo, P., Juárez, M. C., Morales, M. P., Damico, S. & Liarte, I. A. Enhanced geothermal systems (EGS): a review. _Renew. Sustain. Energy Rev._ 56, 133–144 (2016). Article
Google Scholar * Horálek, J., Jechumtálová, Z., Dorbath, L. & Šílený, J. Source mechanisms of micro-earthquakes induced in a fluid injection experiment at the HDR site
Soultz-sous-Forêts (Alsace) in 2003 and their temporal and spatial variations. _Geophys. J. Int._ 181, 1547–1565 (2010). Google Scholar * Häring, M. O., Schanz, U., Ladner, F. & Dyer,
B. C. Characterisation of the Basel 1 enhanced geothermal system. _Geothermics_ 37, 469–495 (2008). Article Google Scholar * Grigoli, F. et al. The November 2017 M w 5.5 Pohang earthquake:
a possible case of induced seismicity in South Korea. _Science_ 5, 1003–1006 (2018). Article Google Scholar * Schmittbuhl, J. et al. Induced and triggered seismicity below the city of
Strasbourg, France from November 2019 to January 2021. _Académie de France - Comptes Rendus Géoscience - Sciences de la Planète 0-24_ (2021). * Trutnevyte, E. & Wiemer, S. Tailor-made
risk governance for induced seismicity of geothermal energy projects: an application to Switzerland. _Geothermics_ 65, 295–312 (2017). Article Google Scholar * Grigoli, F. et al. Current
challenges in monitoring, discrimination, and management of induced seismicity related to underground industrial activities: a European perspective. _Reviews of Geophysics_ 55, 310–340
(2017). Article Google Scholar * Gaucher, E. et al. Induced seismicity in geothermal reservoirs: a review of forecasting approaches. _Renew. Sustain. Energy Rev._ 52, 1473–1490 (2015).
Article Google Scholar * Shapiro, S. A., Dinske, C., Langenbruch, C. & Wenzel, F. Seismogenic index and magnitude probability of earthquakes induced during reservoir fluid
stimulations. _Lead. Edge_ 29, 304–309 (2010). Article Google Scholar * Bachmann, C. E., Wiemer, S., Woessner, J. & Hainzl, S. Statistical analysis of the induced Basel 2006 earthquake
sequence: introducing a probability-based monitoring approach for Enhanced Geothermal Systems. _Geophys. J. Int._ 186, 793–807 (2011). Article Google Scholar * Broccardo, M., Mignan, A.,
Wiemer, S., Stojadinovic, B. & Giardini, D. Hierarchical bayesian modeling of fluid-induced seismicity. _Geophys. Res. Lett._ 44, 357–11 (2017). Article Google Scholar * Norbeck, J. H.
& Horne, R. N. Maximum magnitude of injection-induced earthquakes: a criterion to assess the influence of pressure migration along faults. _Tectonophysics_ 733, 108–118 (2018). Article
Google Scholar * Rinaldi, A. P., Rutqvist, J., Sonnenthal, E. L. & Cladouhos, T. T. Coupled THM modeling of hydroshearing stimulation in tight fractured volcanic rock. _Transport
Porous Media_ 108, 131–150 (2015). Article Google Scholar * Rinaldi, A. P. & Rutqvist, J. Joint opening or hydroshearing? Analyzing a fracture zone stimulation at Fenton Hill.
_Geothermics_ 77, 83–98 (2019). Article Google Scholar * Király, E., Gischig, V., Karvounis, D. & Wiemer, S. Validating models to forecasting induced seismicity related to deep
geothermal energy projects. In _Proc. Thirty-Ninth Workshop on Geothermal Reservoir Engineering_ (Standford University, Stanford, 2014). * Goertz-Allmann, B. P. & Wiemer, S.
Geomechanical modeling of induced seismicity source parameters and implications for seismic hazard assessment. _Geophysics_ 78, KS25–KS39 (2013). Article Google Scholar * Bachmann, C. E.,
Wiemer, S., Goertz-Allmann, B. P. & Woessner, J. Influence of pore-pressure on the event-size distribution of induced earthquakes. _Geophys. Res. Lett._ 39, 1–7 (2012). Article Google
Scholar * Langenbruch, C., Ellsworth, W. L., Woo, J. U. & Wald, D. J. Value at induced risk: injection-induced seismic risk from low-probability, high-impact events. _Geophys. Res.
Lett._ 47, 2014 (2020). Article Google Scholar * Zbinden, D., Rinaldi, A. P., Diehl, T. & Wiemer, S. Hydromechanical modeling of fault reactivation in the St. gallen deep geothermal
project (switzerland): poroelasticity or hydraulic connection? _Geophys. Res. Lett._ 47, 1–10 (2020). Article Google Scholar * Karvounis, D. & Wiemer, S. A discrete fracture hybrid
model for forecasting diffusion-induced seismicity and power generation in enhanced geothermal systems. _Geophys. J. Int._ 230, 84–113 (2022). * Broccardo, M. et al. Induced seismicity risk
analysis of the hydraulic stimulation of a geothermal well on Geldinganes, Iceland. _Natural Hazards and Earth System Sciences_ Discussions 1-39 (2019). * Schultz, R., Beroza, G. C. &
Ellsworth, W. L. A risk-based approach for managing hydraulic fracturing-induced seismicity. _Science_ 372, 504–507 (2021). Article CAS Google Scholar * Schultz, R., Ellsworth, W. L.
& Beroza, G. C. Statistical bounds on how induced seismicity stops. _Sci. Rep._ https://doi.org/10.1038/s41598-022-05216-9 (2022). * Zhu, C., Fan, Z. & Eichhubl, P. The effect of
variable fluid injection rate on the stability of seismogenic faults. In 51st US Rock Mechanics/Geomechanics Symposium (2017). * Hossein Hakimhashemi, A., Schoenball, M., Heidbach, O., Zang,
A. & Grünthal, G. Forward modelling of seismicity rate changes in georeservoirs with a hybrid geomechanical-statistical prototype model. _Geothermics_ 52, 185–194 (2014). Article
Google Scholar * Gischig, V., Wiemer, S. & Alcolea, A. Balancing reservoir creation and seismic hazard in enhanced geothermal systems. _Geophys. J. Int._ 198, 1585–1598 (2014). Article
Google Scholar * Rinaldi, A. P. & Nespoli, M. TOUGH2-seed: a coupled fluid flow and mechanical-stochastic approach to model injection-induced seismicity. _Comput. Geosci._ 108, 86–97
(2017). * Gutenberg, B. & Richter, C. F. Frequency of earthquakes in California. _Bull. Seismol. Soc. Am._ 34, 185–188 (1944). Article Google Scholar * Shapiro, S. A. _Fluid-induced
Seismicity_ (Cambridge University Press, 2015). * Mignan, A., Broccardo, M., Wiemer, S. & Giardini, D. Induced seismicity closed-form traffic light system for actuarial decision-making
during deep fluid injections. _Sci. Rep._ 7, 13607 (2017). * Goebel, T. H., Schorlemmer, D., Becker, T. W., Dresen, G. & Sammis, C. G. Acoustic emissions document stress changes over
many seismic cycles in stick-slip experiments. _Geophys. Res. Lett_. 40, 2049–2054 (2013). * Amitrano, D. Brittle-ductile transition and associated seismicity: Experimental and numerical
studies and relationship with the b value. _J. Geophys. Res.: Solid Earth_ (2003). * Scholz, C. H. _The Frequency-magnitude Relation Of Microfracturing In Rock And Its Relation To
Earthquakes_ (Bulletin of the Seismological Society of America, 1968). * Schorlemmer, D., Wiemer, S. & Wyss, M. Variations in earthquake-size distribution across different stress
regimes. _Nature_ 437, 539 (2005). Article CAS Google Scholar * Petruccelli, A. et al. The influence of faulting style on the size-distribution of global earthquakes. _Earth Planet. Sci.
Lett._ 527, 115791 (2019). Article CAS Google Scholar * Wiemer, S. Introducing probabilistic aftershock hazard mapping. _Geophys. Res. Lett._ 27, 3405–3408 (2000). Article Google Scholar
* Tormann, T., Wiemer, S. & Mignan, A. Systematic survey of high-resolution b value imaging along Californian faults: inference on asperities. _JGR Solid Earth_ 119, 2029–2054 (2014).
* Gulia, L. et al. The effect of a mainshock on the size distribution of the aftershocks. _Geophys. Res. Lett._ 45, 277–13 (2018). Article Google Scholar * Gulia, L. & Wiemer, S.
Real-time discrimination of earthquake foreshocks and aftershocks. _Nature_ 574, 193–199 (2019). Article CAS Google Scholar * Herrmann, M., Kraft, T., Tormann, T., Scarabello, L. &
Wiemer, S. A consistent high-resolution catalog of induced seismicity in basel based on matched filter detection and tailored post-processing. _J. Geophys. Res.: Solid Earth_ 124, 8449–8477
(2019). Article Google Scholar * Scholz, C. H. On the stress dependence of the earthquake b value. _Geophys. Res. Lett._ 42, 1399–1402 (2015). Article Google Scholar * Deichmann, N.,
Kraft, T. & Evans, K. F. Identification of faults activated during the stimulation of the Basel geothermal project from cluster analysis and focal mechanisms of the larger magnitude
events. _Geothermics_ 52, 84–97 (2014). Article Google Scholar * Passelègue, F. X., Brantut, N. & Mitchell, T. M. Fault reactivation by fluid injection: controls from stress state and
injection rate. _Geophys. Res. Lett._ 45, 837–12 (2018). Article Google Scholar * Gischig, V. S. & Wiemer, S. A stochastic model for induced seismicity based on non-linear pressure
diffusion and irreversible permeability enhancement. _Geophys. J. Int._ 194, 1229–1249 (2013). Article Google Scholar * Zang, A. et al. How to reduce fluid-injection-induced seismicity.
_Rock Mech. Rock Eng._ 52, 475–493 (2019). Article Google Scholar * Zang, A., Yoon, J. S., Stephansson, O. & Heidbach, O. Fatigue hydraulic fracturing by cyclic reservoir treatment
enhances permeability and reduces induced seismicity. _Geophys. J. Int._ 195, 1282–1287 (2013). Article Google Scholar * Yoon, J. S., Zang, A. & Stephansson, O. Numerical investigation
on optimized stimulation of intact and naturally fractured deep geothermal reservoirs using hydro-mechanical coupled discrete particles joints model. _Geothermics_ 52, 165–184 (2014).
Article Google Scholar * Kwiatek, G. et al. Controlling fluid-induced seismicity during a 6.1-km-deep geothermal stimulation in Finland. _Sci. Adv._ 5, 1–12 (2019). Article Google Scholar
* Hofmann, H. et al. First field application of cyclic soft stimulation at the Pohang Enhanced Geothermal System site in Korea. _Geophys. J. Int._ 217, 926–949 (2019). Article Google
Scholar * Király-Proag, E., Gischig, V., Zechar, J. D. & Wiemer, S. Multicomponent ensemble models to forecast induced seismicity. _Geophys. J. Int._ 212, 476–490 (2018). Article
Google Scholar * Langenbruch, C., Weingarten, M. & Zoback, M. D. Physics-based forecasting of man-made earthquake hazards in Oklahoma and Kansas. _Nat. Commun._ 9, 1–10 (2018). Article
CAS Google Scholar * Hertrich, M. et al. Characterization, hydraulic stimulation, and fluid circulation experiments in the Bedretto Underground Laboratory for Geosciences and
Geoenergies. _55th U.S. Rock Mechanics / Geomechanics Symposium 2021_ 4 (2021). * Lanza, F. & Wiemer, S. The DEEP Project : Innovation for De-Risking Enhanced Geothermal Energy Projects.
_In 19th Swiss Geoscience Meeting_ (2021). * Mena, B., Wiemer, S. & Bachmann, C. Building robust models to forecast the induced seismicity related to geothermal reservoir enhancement.
_Bull. Seismol. Soc. Am._ 103, 383–393 (2013). Article Google Scholar * Beroza, G. C., Segou, M. & Mostafa Mousavi, S. Machine learning and earthquake forecasting-next steps. _Nat.
Commun._ 12, 10–12 (2021). Article Google Scholar * Schultz, R., Atkinson, G., Eaton, D. W., Gu, Y. J. & Kao, H. Hydraulic fracturing volume is associated with induced earthquake
productivity in the duvernay play. _Science_ 359, 304–308 (2018). Article CAS Google Scholar * Marzocchi, W., Spassiani, I., Stallone, A. & Taroni, M. How to be fooled searching for
significant variations of the b -value. _Geophys. J. Int._ 220, 1845–1856 (2020). * Woo, J. U. et al. An in-depth seismological analysis revealing a causal link between the 2017 MW 5.5
pohang earthquake and EGS project. _J. Geophys. Res.: Solid Earth_ 124, 13060–13078 (2019). Article Google Scholar * McGarr, A. Maximum magnitude earthquakes induced by fluid injection.
_J. Geophys. Res.: Solid Earth_ 119, 1008–1019 (2014). Article Google Scholar * Li, Z. et al. Constraining maximum event magnitude during injection-triggered seismicity. _Nat. Commun._ 12,
1–9 (2021). Google Scholar * van der Elst, N., Page, M., Weiser, D., Goebel, T. & Hosseini, S. Induced earthquake magnitudes are as large as (statistically) expected. _J. Geophys.
Res.: Solid Earth_ 121, 4575–4590 (2016). Article Google Scholar * Galis, M., Ampuero, J. P., Mai, P. M. & Cappa, F. Induced seismicity provides insight into why earthquake ruptures
stop. _Sci. Adv._ 3,eaap7528 (2017). * Ciardo, F. & Rinaldi, A. P. Impact of injection rate ramp-up on nucleation and arrest of dynamic fault slip. _Geomech. Geophys. Geo-Energy and
Geo-Resour._ https://doi.org/10.1007/s40948-021-00336-4 (2022). * Langenbruch, C. & Shapiro, S. A. Decay rate of fluid-induced seismicity after termination of reservoir stimulations.
_Geophysics_ 75, MA53-MA62 (2010). * Narteau, C., Byrdina, S., Shebalin, P. & Schorlemmer, D. Common dependence on stress for the two fundamental laws of statistical seismology. _Nature_
462, 642–645 (2009). Article CAS Google Scholar * Wiemer, S. & Wyss, M. Mapping the frequency-magnitude distribution in asperities: an improved technique to calculate recurrence
times? _J. Geophys. Res.: Solid Earth_ 102, 15115–15128 (1997). Article Google Scholar * Pruess, K., Oldenburg, C. & Moridis, G. TOUGH2 User’s Guide. Tech. Rep. November (1999). *
Ritz, V. A. et al. Modelling induced seismicity with a hydraulic-mechanical -stochastic simulator: Review of case studies. 54th U.S. Rock Mechanics/Geomechanics Symposium 2019 (2020). *
Dinske, C. & Shapiro, S. A. Seismotectonic state of reservoirs inferred from magnitude distributions of fluid-induced seismicity. _J. Seismol._ 17, 13–25 (2013). Article Google Scholar
* Cuenot, N., Dorbath, C. & Dorbath, L. Analysis of the microseismicity induced by fluid injections at the EGS site of Soultz-sous-Forêts (Alsace, France): implications for the
characterization of the geothermal reservoir properties. _Pure Appl. Geophys._ 165, 797–828 (2008). Article Google Scholar * Villiger, L. et al. Influence of reservoir geology on seismic
response during decameter-scale hydraulic stimulations in crystalline rock. _Solid Earth_ 11, 627–655 (2020). Article Google Scholar Download references ACKNOWLEDGEMENTS This work has been
funded by the European Commission Horizon 2020 research and innovation programme under grant agreement no. 691728 (DESTRESS), and through the COSEISMIQ project from the European Commission
and the SFOE under contract number SI/501721. This work has also been funded by the De-Risking Enhanced Geothermal Energy project (Innovation for DEEPs). DEEP and COSEISMIQ are subsidised
through the Cofund GEOTHERMICA, which is supported by the European Union’s HORIZON 2020 programme for research, technological development, and demonstration under Grant Agreement Number
731117. Additional funds were provided by the real-time earthquake risk reduction for a Resilient Europe (RISE) project, which has received funding from the European Union’s Horizon 2020
research and innovation programme under Grant Agreement Number 821115. The authors would like to thank Luigi Passarelli and Toni Kraft for their thoughtful comments which improved the
manuscript. AUTHOR INFORMATION AUTHORS AND AFFILIATIONS * Swiss Seismological Service, ETH Zürich, Zurich, Switzerland Vanille A. Ritz, Antonio P. Rinaldi & Stefan Wiemer Authors *
Vanille A. Ritz View author publications You can also search for this author inPubMed Google Scholar * Antonio P. Rinaldi View author publications You can also search for this author
inPubMed Google Scholar * Stefan Wiemer View author publications You can also search for this author inPubMed Google Scholar CONTRIBUTIONS V.A.R.: conceptualisation, methodology, software,
investigation, and visualisation. A.P.R.: conceptualisation, methodology, software, and investigation. S.W.: investigation and supervision. All authors contributed to the writing and review
of the manuscript. CORRESPONDING AUTHOR Correspondence to Vanille A. Ritz. ETHICS DECLARATIONS COMPETING INTERESTS The authors declare no competing interests. PEER REVIEW PEER REVIEW
INFORMATION _Communications Earth & Environment_ thanks Annemarie Muntendam-Bos and the other, anonymous, reviewer(s) for their contribution to the peer review of this work. Primary
Handling Editors: Teng Wang, Joe Aslin, Clare Davis. Peer reviewer reports are available. ADDITIONAL INFORMATION PUBLISHER’S NOTE Springer Nature remains neutral with regard to
jurisdictional claims in published maps and institutional affiliations. SUPPLEMENTARY INFORMATION SUPPLEMENTARY INFORMATION PEER REVIEW FILE RIGHTS AND PERMISSIONS OPEN ACCESS This article
is licensed under a Creative Commons Attribution 4.0 International License, which permits use, sharing, adaptation, distribution and reproduction in any medium or format, as long as you give
appropriate credit to the original author(s) and the source, provide a link to the Creative Commons license, and indicate if changes were made. The images or other third party material in
this article are included in the article’s Creative Commons license, unless indicated otherwise in a credit line to the material. If material is not included in the article’s Creative
Commons license and your intended use is not permitted by statutory regulation or exceeds the permitted use, you will need to obtain permission directly from the copyright holder. To view a
copy of this license, visit http://creativecommons.org/licenses/by/4.0/. Reprints and permissions ABOUT THIS ARTICLE CITE THIS ARTICLE Ritz, V.A., Rinaldi, A.P. & Wiemer, S. Transient
evolution of the relative size distribution of earthquakes as a risk indicator for induced seismicity. _Commun Earth Environ_ 3, 249 (2022). https://doi.org/10.1038/s43247-022-00581-9
Download citation * Received: 03 May 2022 * Accepted: 11 October 2022 * Published: 25 October 2022 * DOI: https://doi.org/10.1038/s43247-022-00581-9 SHARE THIS ARTICLE Anyone you share the
following link with will be able to read this content: Get shareable link Sorry, a shareable link is not currently available for this article. Copy to clipboard Provided by the Springer
Nature SharedIt content-sharing initiative