- Select a language for the TTS:
- UK English Female
- UK English Male
- US English Female
- US English Male
- Australian Female
- Australian Male
- Language selected: (auto detect) - EN
Play all audios:
ABSTRACT The kinematics of hydrogen diffusion in nontransparent metallic materials is crucial to the hydrogen-sensing and -storage technology and remains a challenge. Alongside the
conventional optical investigations, the hydrogen absorption-induced reversible changes of magnetic properties in ferromagnetic thin films provides a new method for visualization of hydrogen
in solids. Here we monitor real-time hydrogen diffusion in a cobalt-palladium alloy (Co25Pd75) film using a magneto-optical Kerr microscope. The spatially resolved magneto-optical
contrasted images provide a noninvasive method of monitoring hydrogen movement. Hydrogen diffusion follows Fick’s diffusion law, and a diffusion coefficient of 3 ± 2 × 10⁻¹² m2/s is
obtained. The diffusion velocity of the 2–4% hydrogen concentration fronts reaches 30 ± 15 nm/s in the uniform film area and increases to 50 ± 20 nm/s near a defect site. These results can
be applied in detecting hydrogen diffusion in other spintronic materials, such as magnetic palladium-alloy thin films. SIMILAR CONTENT BEING VIEWED BY OTHERS QUANTUM MICROSCOPY WITH VAN DER
WAALS HETEROSTRUCTURES Article 07 November 2022 QUANTITATIVE MAGNETOOPTICAL ANALYSIS USING INDICATOR FILMS FOR THE DETECTION OF MAGNETIC FIELD DISTRIBUTIONS, TEMPERATURE, AND ELECTRICAL
CURRENTS Article Open access 26 October 2024 IN-PLANE OXYGEN DIFFUSION MEASUREMENTS IN POLYMER FILMS USING TIME-RESOLVED IMAGING OF PROGRAMMABLE LUMINESCENT TAGS Article Open access 09 March
2024 INTRODUCTION Because of limited fossil fuel resources and increasing energy demands, hydrogen will be a crucial element in future renewable energy1. Numerous studies have been
undertaken to identify functional materials for sensing, storage, and catalyzed dissociation of hydrogen, yet these remain a challenge1,2. In addition to the conventional gas phase, hydrogen
can be stored in the interstitial sites of a solid crystalline lattice after dissociation from bi-atomic molecules to single atoms2. Because the volumetric density of hydrogen can be
greatly increased in solid state storage, various metal-hydride systems have been investigated for their hydrogen storage potential. Moreover, after hydrogen absorption, the crystalline
structure, electronic properties, and magnetism of the materials usually change; therefore, materials sensitive to hydrogen absorption have been proposed for use in hydrogen-sensing devices.
Most studies have focused on reversible optical and electrical property changes induced by hydrogenation3,4. Hydrogen-induced reduction of resistivity can feasibly be applied to hydrogen
sensing, but it cannot provide spatial resolution of hydrogen content in the materials. Hydrogen-induced changes of optical properties, especially transmission, provide a noninvasive method
of detecting hydrogen diffusion in materials. Huiberts et al.3 first reported the switchable optical properties of yttrium and lanthanum hydride films3. Upon hydrogen loading, yttrium
hydride changes from a shiny mirror to a transparent window. Den Broeder et al.5 pioneered the visualization of hydrogen migration in solids using YHx switchable mirror thin films. They
observed the electromigration of hydrogen, which diffused toward the anode when a current flowed through the film. This indicated that hydrogen in YH3−_δ_ behaved as a negative ion.
Kerssemakers et al.6 observed the homogeneous and essentially independent optical switching of individual domains in Pd/YHx/CaF2(111) epitaxial switchable mirrors during hydrogen absorption.
Remhof et al.7 demonstrated that YHx switchable mirror material could be used both as an indicator for monitoring and an agent for controlling hydrogen diffusion in a VHx underlayer.
Hjörvarsson and colleagues8 combined light and electron scattering to explore hydrogen diffusion in Pd/V/MgO(001) single crystalline thin metallic films. Most studies have used reflectivity
and transmission changes in YHx and VHx, respectively, to visualize hydrogen diffusion3,5,6,7,8. However, investigating the kinetics of hydrogen diffusion in other nontransparent metallic
materials remains a challenge. Alongside the reported optical investigations, the reversible changes of magnetic properties in ferromagnetic thin films induced by hydrogen absorption and
desorption should also be considered9,10,11,12,13. This method can be applied to various hydrogen-sensitive magnetic Pd-alloys, in which the detection of hydrogen-induced magnetism changes
is feasible even though hydrogen-induced change in reflectivity is limited. Our other studies showed that in an annealed Pd/Co/Pd trilayer and a [Co/Pd]12 multilayer, hydrogenation-induced
modulation of magnetism could be observed because of the Pd-alloyed interface effect13,14,15,16,17. This was because Pd is a highly efficient catalyst for hydrogen molecule dissociation and
Pd-hydride formation is energy favorable2. Based on these findings, we also observed appreciable magnetic modulation in Pd-rich magnetic alloy thin films, indicating that such materials
would be useful in fabricating gas sensors and especially suitable for spatially resolved hydrogen diffusion12,18,19,20,21,22,23. Moreover magneto-optical Kerr effect (MOKE), originating
from the optical property and magnetism of materials, has long been widely applied in magnetic measurement of nano-scale samples because of the extremely high sensitivity and
feasibility24,25,26. In addition to the magneto-optical Kerr rotation and intensity, the intrinsic characteristics of magnetism such as the magnetic cercivity Hc and the squareness M_r_/M_s_
can be measured through this method14,16,18,23,27,28. Here we demonstrate hydrogen diffusion monitoring in a Co25Pd75/SiO2/Si(100) magnetic film using a magneto-optical Kerr microscope in
the longitudinal geometry. The spatial distribution of hydrogen content is recorded with variations in absorption and desorption time, respectively. The detailed kinetics of hydrogen
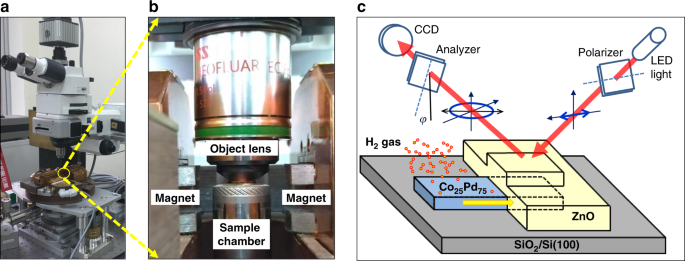
diffusion are also discussed in this paper. RESULTS SAMPLE DESIGN AND MEASUREMENT OF MAGNETO-OPTICAL KERR EFFECT Figure 1 illustrates a sample structure with the measurement geometry. The
right side of a 50-nm-thick Co25Pd75 alloy stripe was fully covered by a 100-nm-thick ZnO film. ZnO is transparent so that we can easily perform the Kerr measurement through the thick ZnO
cover layer. Besides, the ZnO/CoPd interface is stable at room temperature; capping the CoPd film by ZnO does not cause considerable change in magnetic property (Supplementary Fig. 1). The
atomic structure of ZnO is quite compact so that the H2 molecules cannot penetrate through it. Thus the ZnO cover layer can prohibit the direct contact and absorption of hydrogen from the
covered surface of the CoPd film. As illustrated in Fig. 1c, the right side of the CoPd film was fully covered by the 100-nm-thick ZnO cover layer and the left side was bare. In this sample
design, we can be sure about that during the exposure to H2 gas, the hydrogen absorption only occurs on the bare CoPd surface, and therefore the H-content in the CoPd film diffuses from the
bare part (left) to the ZnO-coverd part (right). Inversely, when the chamber is evacuated, the hydrogen desorption only occurs on the bare CoPd surface and therefore the H-content diffuses
from the ZnO-coverd part (right) to the bare part (left). To monitor hydrogen diffusion, the Kerr microscope focused on the boundary area with a 500 × 500-μm2 field of vision. Sequential
Kerr images were recorded using a suitable magnetic field. By integrating the intensities of selected areas in the Kerr images, we could obtain local magnetic hysteresis loops for each area.
Spatially resolved magnetic behavior in the Co25Pd75 film could thus be real-time monitored during hydrogen exposure or desorption. Figure 2 illustrates an example of using longitudinal
MOKE to achieve a spatially resolved hydrogenation effect. An optical microscope (OM) image is shown in Fig. 2a, with seven selected areas indicated by the green rectangles. The arrow
indicates the direction of hydrogen diffusion, and the sample geometry is shown at the bottom. Hysteresis loops integrated from specific areas are shown in Fig. 2b, where the evolution of
the hysteresis loop shape can clearly be seen. From left (No. 1) to right (No. 7), the hysteresis loop changes from a square-like shape to a tilted narrow shape. Our studies on Pd-rich
magnetic alloy thin films have shown that the hydrogenation effect can reversibly change magnetic behavior from a low remanence (_M_r) to saturation (_M_s) ratio to _M_r/_M_s = 100%18,20,21.
This is because the hydrogen content in a Pd-rich magnetic film induces a spin-polarized charge transfer between Co and Pd, thus mediating the long-range magnetic coupling, that is, the
100% _M_r/_M_s ratio18. Because of the hydrogen-induced enhancement of magnetic exchange interaction, the Curie temperature increases and the power law dependence of M_r_ with temperature is
elevated toward the higher temperature. Thus the room temperature-measured _M_r increases with the introduction of H. Accordingly, the _M_r/_M_s ratio in a magnetic hysteresis loop provides
a strong indicator of hydrogen content in the Pd-rich magnetic alloy film. The results shown in Fig. 2b reveal that the hydrogen diffusion front should be positioned between No. 4 and No.
5. The OM image in Fig. 2a exhibits no observable contrast around the hydrogen diffusion front. Although the Kerr rotation signal is much weaker than the background in the OM image, the Kerr
effect is highly sensitive to hydrogen content and can serve as an indicator. The Co25Pd75 alloy film under a vacuum presented no observable domain structure; the gray scale in the Kerr
images gradually and continuously became darker/brighter with the negative/positive increase in the magnetic field. The absence of the magnetic domain structure is because the magnetization
reversal was dominated by small nucleations which are randomly distributed on the thin film, and their size was of a submicrometer scale below the resolution of the Kerr microscope27. In
contrast to the absence of magnetic domain structure under a vacuum, the H-content induced visible magnetic reversal nucleations and also advanced the DW motion, leading to the expansion of
reversal nucleations and subsequently the large magnetic domains27. Besides, the magneto-optical Kerr signal (rotation) could easily change with the film thickness and protective covering
layer, because the absolute value of Kerr hysteresis loop is a complex of magnetic and optical properties. The Kerr intensity _I_Kerr is usually approximated as being proportional to the
magnetization _M_, i.e. _I_Kerr ∝ _M_. The linear coefficient in _I_Kerr ∝ _M_ depends on the optical properties of the cover layer, magnetic thin film and the substrate. However through
dividing _M_r by _M_s, this linear coefficient can be eliminated. The _M_r_/M_s ratio deduced from the Kerr hysteresis loop originates from only the intrinsic magnetism of the CoPd film.
_M_r/_M_s is mostly determined by the exchange coupling and magnetic anisotropy, which are microscopic-scale properties. Thus in this study, we measure the spatial distribution of the
_M_r/_M_s ratio for the indication of H-concentration. This indication by H-enhanced _M_r/_M_s is directly correlated to the intrinsic magnetism of CoPd film and will not be affected by the
covering layer or underneath substrate. This is also the advantage of adopting the _M_r/_M_s ratio, especially for those non-transparent films with a covering layer. CALIBRATION OF HYDROGEN
CONCENTRATION In a pressure-composition-isotherms (PCI) study by Zlotea et al.29, under an H2 pressure of 105 Pa the hydrogen solubility of Co25Pd75 nanoalloys increased with decreasing
particle sizes, yielding atomic hydrogen to metal ratios (_H_/_M_) of 5, 8, and 23% for average particle sizes of 12.5, 5.3, and 2.1 nm, respectively. In the case of pure Pd particles,
nanosize effects are clear for particle sizes <10 nm. Therefore, it is reasonable to compare the hydrogen storage capacity of Co25Pd75 nanoalloys >10 nm to the 50-nm-thick Co25Pd75
film in our experiment. The left axis of Fig. 3 shows the PCI results of Zlotea et al.29 for a 12.5-nm Co25Pd75 nanoalloy. The red dots depict the monotonic increasing curve of hydrogen
concentration with H2 gas pressure \(\left( {{\mathrm{P}}_{{\mathrm{H}}_2}} \right)\); the _H_/_M_ ratio has reached nearly 5% with 105 Pa of \({\mathrm{P}}_{{\mathrm{H}}_2}\). On the right
axis of Fig. 3, the _M_r/_M_s ratio of the Co25Pd75 film is plotted as a function of \({\mathrm{P}}_{{\mathrm{H}}_2}\) according to our study of the hydrogenation effect on CoPd alloys. The
blue squares depict the increasing trend of the M_r_/M_s_ ratio from 20 to 100% with the increase of \({\mathrm{P}}_{{\mathrm{H}}_2}\) from 10−1 Pa to 105 Pa. By fitting the curves from the
\({{H}}/{{M}} - {\mathrm{P}}_{{\mathrm{H}}_2}\) and \({{M}}_{\mathrm{r}}/{{M}}_{\mathrm{s}} - {\mathrm{P}}_{{\mathrm{H}}_2}\) experimental data, a correlation between hydrogen concentration
(_H_/_M_) and magnetic property (_M_r/_M_s) was deduced, as shown in the inset of Fig. 3. According to the correlation curve, the spatial distribution of hydrogen content could be obtained
from the experimentally measured _M_r/_M_s values. Note that all the experimental data of \({{H}}/{{M}} - {\mathrm{P}}_{{\mathrm{H}}_2}\) and \({{M}}_r/{{M}}_s -
{\mathrm{P}}_{{\mathrm{H}}_2}\) were measured at room temperature (RT) and the error bars in Fig. 3 are determined from the statistical deviation of the magnetic coercivity in the repeating
MOKE measurements. Considering the M_r_/M_s_ ratio and the equilibrium _H_/_M_ are sensitive to the temperature, the deduced correlation between _M_r/_M_s and _H_/_M_ is only suitable for
RT-environment. VISUALIZING HYDROGEN DIFFUSION After subtracting the negative from the positive remanence state (i.e., the differential image of (_M_r+ − _M_r−)), the Kerr images shown in
Fig. 4a clearly exhibit a time-dependent evolution of the hydrogenation effect and hydrogen content (Supplementary Fig. 2). For example, in the Kerr image for time = 600 s after H2 exposure,
the bright area on the left indicates a 100% _M_r/_M_s ratio because of saturated hydrogenation, whereas the dark area on the right indicates a low _M_r/_M_s ratio (~20%) in the pristine
Co25Pd75. In the Kerr images between 600 and 2400 s, the black/white boundary is observed to shift toward the right. After 2400 s, no obvious shift of the black/white boundary was evident;
instead, the dark area gradually became gray and the contrast decreased over time. Figure 4b shows the _M_r/_M_s ratio recorded at various X positions relative to the edge of the ZnO capping
layer. The _M_r/_M_s distribution was sequentially recorded at different times after hydrogen exposure. The _M_r/_M_s distribution curves provided information on the hydrogenation effect on
Co25Pd75 film magnetism. The hydrogen concentration distribution could be obtained through the correlation curve shown in Fig. 3. The hydrogen concentration (H/M) distribution curves
deduced from the _M_r/_M_s ratio are displayed in Fig. 5a. The position of the _H_/_M_ = 2, 3, and 4% hydrogen diffusion fronts is plotted as a function of time in Fig. 5c. Figure 5d shows
the diffusion velocity of the _H_/_M_ = 2, 3, and 4% fronts by differentiation from the positions in Fig. 5c. Combining the information from Figs. 4b and 5, hydrogen diffusion behavior can
be classified into three regions. In the first region at 0–150 μm (0–2400 s), both the Kerr image (Fig. 4b) and the _H_/_M_ distribution curves (Fig. 5a) exhibit a clear hydrogen diffusion
front movement. The diffusion velocity deduced from differentiation of the _H_/_M_ = 2, 3, and 4% front positions in Fig. 5c is ~120 ± 20 nm/s. The deviation of the diffusion speed
originates from the errors or uncertainties in the determination of hydrogen concentration _H_/_M_. According to the _M_r/_M_s-_H_/_M_ correlation curve shown in Fig. 3, the spatial
distribution of hydrogen content can be obtained from the experimentally measured _M_r/_M_s values at each location. About the spatial-resolved distribution of H-content in the Co25Pd75 film
studied in this experiment, we need to consider both the spatial resolution and the resolution of H-concentration measurement. The spatial resolution is determined by the precision of our
Kerr microscope, including the optical setup and the CCD-imaging system. In our experiment, the measurement results always repeated within few μm. Concerning the resolution of the
H-concentration, the precision is determined by the signal to noise ratio of Kerr effect. The precision of _M_r/_M_s ratio is within ±0.05, corresponding to the precision of _H_/_M_ ratio
within ±2.5%. However the accuracy of hydrogen concentration is significantly affected by the calibration of the H-content and the _M_r/_M_s ratio. This calibration also counts on the
previous results of Zlotea et al.29: the H-content in CoPd alloy corresponding to the variable hydrogen pressure. Thus the accuracy in the calibration of H-content and the _M_r/_M_s ratio is
supposed to dominate the resolution of the H-concentration. When combining the spatial-resolved H-distribution for the fitting of diffusion coefficient, as shown in Fig. 5, the accuracy of
the calibration: H-content vs. the _M_r/_M_s ratio determines the uncertainty. In the second region at 150–350 μm (2400–4200 s), no clear shift of contrast in the Kerr image (Fig. 4b) or
_H_/_M_ distribution curves (Fig. 5a) is observed. The hydrogen concentration increased gradually. The diffusion velocity deduced from differentiation of the _H_/_M_ = 2, 3, and 4% front
positions in Fig. 5c is ~30 ± 15 nm/s. In this region, hydrogen diffusion is relatively low and follows Fick’s diffusion laws8. Considering the low concentration of _H_/_M_ (≤5%) and the
fact that measurement was performed at 300 K, hydrogen behaved as a noninteracting particle and accordingly followed Fick’s second diffusion law, which can be expressed as follows:
$$\frac{{\partial {\mathrm{C}}(x,t)}}{{\partial t}} = D\frac{{\partial ^2{\mathrm{C}}(x,t)}}{{\partial ^2x}}$$ (1) where C(_x_, _t_) is the time (_t_)- and position (_x_)-dependent function
of the hydrogen concentration _H_/_M_, and _D_ is the diffusion coefficient, which can be determined by fitting the model to the data8. Actually we followed the simulation method as reported
by Pálsson et al.8. Given the boundary and initial conditions for the sample geometry in this experiment, the solution of Eq. (1) is expressed as a series of complementary error functions
(erfcs)8. The erfc series converges quickly, and only a few terms must be considered when fitting the data8. The _H_/_M_ distribution curves in the second region were fitted by solving Eq.
(1) with a single free parameter, namely the diffusion coefficient _D_8. By fitting the experimental data with the model, a diffusion coefficient _D_ was obtained. Figure 5b shows examples
of the fitting curves and the inset summarizes the fitted values of _D_ at the various times. From the fitted _D_ values, we obtained an average _D_ = 3 ± 2 × 10⁻¹² m2/s. In other studies of
Y, V, and Y/V bilayer thin films, _D_ varies at room temperature by four orders of magnitude between the extreme values of H in Y (typically 10−13 m2/s) and H in V (typically 10−9 m2/s)7.
For Mg-dihydride thin films, Teichmann et al. reported an average effective hydrogen diffusion coefficient of ~3 × 10⁻¹² m2/s at room temperature30. The D value of 3 ± 2 × 10⁻¹² m2/s for
hydrogen diffusion in Co25Pd75 alloy thin film is within the _D_ range observed in other studies and close to the _D_ values in YH_x_ and MgH_x_ systems. Based on this MOKE method, detection
of _D_ values can be performed in other magnetic transition-metal hydrides. In the third region at 350–500 μm (4200–6500 s), the diffusion velocity deduced from differentiation of the
_H_/_M_ = 2, 3, and 4% front positions in Fig. 5c is ~50 ± 20 nm/s, which is much faster than in the second region. When examining the optical image, a defect site on the hydrogen diffusion
passage was found to dominate enhancement of the hydrogen diffusion velocity. To confirm the mechanism, more detailed analysis of the difference between the hydrogen diffusion velocity in a
uniform area and that across a defect site was performed. Figure 6a shows the contrasted Kerr image (_M_r+ − _M_r−) near a defect site for different hydrogen diffusion times. When the
hydrogen front approached the defect site at ~1200 s, a protruding domain was produced across the defect. In Fig. 6b, c, the spatial distribution of the _M_r/_M_s ratio is illustrated
sequentially for different times on line profiles A and B, which pass through a normal film area and a defect area, respectively, as indicated in Fig. 6a. In the left axis of Fig. 6d, the
position of the 2% _H_/_M_ front diffusing along line A (beside the defect) and line B (across the defect) is plotted as a function of time. In the right axis, the difference between the 2%
_H_/_M_ front position along lines A and B (ΔX) is plotted, indicating the relatively rapid hydrogen diffusion rate across the defect area at ~1200 s. After passing through the defect area,
diffusion of the 2% hydrogen front along lines A and B gradually merged at ~4800 s. This remerging of the hydrogen diffusion front after passing through the defect area seems reasonable,
because transverse hydrogen diffusion could gradually eliminate the hydrogen concentration gradient between lines A and B. Along with hydrogen absorption and diffusion, hydrogen desorption
from the Co25Pd75 alloy film was also real-time monitored, as shown in Fig. 7. After loading the hydrogen concentration to nearly 5% of _H_/_M_ by exposure to 105 Pa hydrogen gas, the
hydrogen gas was pumped out to create a vacuum of 5 × 10⁻¹ Pa for investigation of hydrogen desorption. Because the bared area of Co25Pd75 was exposed to a vacuum, the hydrogen desorption
rate became much higher than the adsorption rate at the bared surface, leading to net hydrogen desorption. A one-dimensional hydrogen concentration gradient thus formed, leading to
unidirectional hydrogen diffusion from the ZnO-covered region to the bared Co25Pd75 region. As illustrated in Fig. 7a, at the start of hydrogen desorption (600 s) the bared Co25Pd75 area
(left) became dark (i.e., low M_r_/M_s_ ratio and hydrogen concentration), whereas the ZnO-covered area (right) remained bright (i.e., high _M_r/_M_s ratio and hydrogen concentration). With
increasing desorption time, the dark/bright boundary moved rightward to the ZnO/Co25Pd75 area, which also gradually became darker. Figure 7b shows the time-dependent _M_r/_M_s curves plotted
as a function of position X, and Fig. 7c the time-dependent position of the 2, 2.5, and 3% _H_/_M_ fronts across the defect-free area. The quantitative results of hydrogen desorption (Fig.
7b, c) are similar to the hydrogen absorption behavior in Fig. 5a, b. During the first 1000 s, the diffusion rate reached approximately 50 ± 20 nm/s, followed by a relatively low speed of
~30 ± 15 nm/s. The similarity of hydrogen absorption and desorption behaviors indicates that the same diffusion mechanism—namely, Fick’s diffusion law—prevailed. The main idea of this report
is that H-content promoted magnetic exchange interaction and caused the increase of _M_r. This is because the H-content enhanced the magnetic exchange interaction. In our Kerr measurement,
the sample of ZnO-covered Co25Pd75 alloy thin film was stored in a chamber at RT while the hydrogen pressure in the chamber was stably sustained at 1 bar. The experimental results
demonstrated that the material of Co25Pd75 alloy and the method of spatial-resolved magneto-optical Kerr effect could be used for the hydrogen gas sensing and the indicator of H-content
distribution in solids at the constant temperature of RT. However one should note that when the hydrogen content in a material reaches an equilibrium condition, an equal amount of hydrogen
is entering and leaving the sample. This equilibrium counts on the equality between the absorption and desorption rate of hydrogen. If some external conditions change, such as the
temperature or hydrogen pressure, the absorption rate and desorption rate may considerably be changed and thus a new equilibrium state with different hydrogen concentration will be achieved.
Therefore our method cannot be directly applied at variable temperature or under a \({\mathrm{P}}_{{\mathrm{H}}_2}\) other than 1 bar, unless the H-induced change in M_r_ is calibrated in
the various conditions. DISCUSSION In this study, hydrogen diffusion in an Co25Pd75 alloy film was real-time monitored using a magneto-optical Kerr microscope. Through hydrogenation-induced
enhancement of magnetic remanence, the _H_/_M_ atomic ratio could be calibrated using spatially resolved magneto-optical contrasted images. This method provided a noninvasive method of
monitoring hydrogen movement in magnetic thin film. In our analysis, hydrogen absorption and diffusion followed Fick’s diffusion law, and a diffusion coefficient of 3 ± 2 × 10⁻¹² m2/s was
obtained by fitting the experimental data to the model. The diffusion velocity of the 2, 3, and 4% hydrogen concentration fronts reached 30 ± 15 nm/s in the uniform film area and increased
to 50 ± 20 nm/s near a defect site. Hydrogen desorption exhibited a hydrogen diffusion speed similar to that of hydrogen absorption. These results demonstrated that hydrogen diffusion in
nontransparent Pd-rich magnetic alloy thin films could be monitored, with possible applications in hydrogen-sensing and -storage technology. Along with monitoring hydrogen diffusion behavior
in magnetic metal thin films, we also demonstrated that the hydrogen-induced magnetic boundary was within 100 μm, which is even smaller than the general size of in-plane magnetic domains.
This indicated that the hydrogen concentration gradient in magnetic CoPd film could induce a critical difference in interatomic magnetic coupling and lead to a discontinuity in magnetic
domain structure. Even in a continuous Co25Pd75 alloy film, the expected large-scale long-range magnetic coupling did not mantle the hydrogen-induced contrast in Kerr images. The drastic
hydrogen-induced change in local magnetic behavior, namely the enhanced _M_r/_M_s ratio, was sufficiently strong to overcome the pristine magnetic coupling. These observations suggest the
future applicability of magnetic patterning using hydrogen implantation or diffusion. METHODS SAMPLE PREPARATION The ZnO/Co25Pd75 sample structure was fabricated on a SiO2/Si(001) substrate,
as shown in Fig. 1. A 50-nm-thick Co25Pd75 alloy thin film, masked in the form of a 1 × 3-mm2 stripe, was codeposited by e-beam-heated evaporators in an ultra-high vacuum chamber with a
base pressure of 3 × 10⁻⁷ Pa. The film thickness and alloy composition were calibrated through Auger electron spectroscopy, transmission electron microscopy coupled with energy dispersive
spectroscopy, and atomic force microscopy18,20. A 100-nm-thick ZnO film was subsequently deposited on part of the Co25Pd75 film, leaving one end of Co25Pd75 stripe bared. The ZnO film was
prepared at room temperature in an oxygen ambient pressure of 8.0 Pa through pulsed-laser deposition31. A Nd:YAG Q-switch laser provided a laser wavelength of 266 nm with an energy density
of approximately 2.7 J/cm231,32. MAGNETIC MEASUREMENT The magnetic hysteresis loops of the Co25Pd75 film were measured at room temperature using a magneto-optical Kerr microscope (Evico
Magnetics GmbH) in the longitudinal geometry, focused on the boundary area between ZnO/Co25Pd75 and bared Co25Pd75. Magneto-optical Kerr effect (MOKE) measurements were conducted in a small
vacuum chamber equipped with a window27. During measurement, the MOKE chamber was either pumped to a vacuum of 5 × 10⁻¹ Pa or filled with H2 gas at various pressures to investigate the
hydrogen effect on the magnetic properties of the Co25Pd75 alloy films. DATA AVAILABILITY The authors declare that the raw data supporting the findings of this study (Figs. 2–7) are
available from the corresponding author on reasonable request. REFERENCES * Delmelle, R. & Proost, J. An in situ study of the hydriding kinetics of Pd thin films. _Phys. Chem. Chem.
Phys._ 13, 11412 (2011). CAS PubMed Google Scholar * Bartczak, W. M. & Stawowska, J. Interaction of dihydrogen with transition metal (Pd, Ni, Ag, Cu) clusters. _Struct. Chem._ 15, 447
(2004). CAS Google Scholar * Huiberts, J. N. et al. Yttrium and lanthanum hydride films with switchable optical properties. _Nature_ 380, 231–234 (1996). CAS Google Scholar * Lederman,
D. et al. Magnetooptic properties of Fe/Pd andCo/Pd bilayers under hydrogen absorption. _Appl. Phys. Lett._ 85, 615 (2004). CAS Google Scholar * den Broeder, F. J. A. et al. Visualization
of hydrogen migration in solids using switchable mirrors. _Nature_ 394, 656–658 (1998). Google Scholar * Kerssemakers, J. W. J., van der Molen, S. J., Koeman, N. J., Günther, R. &
Griessen, R. Pixel switching of epitaxialPd/Y H_x_/CaF2 switchable mirrors. _Nature_ 406, 489–491 (2000). CAS PubMed Google Scholar * Remhof, A. et al. Switchable mirrors for
visualization and control of hydrogen diffusion in transition metals. _Phys. Rev. B_ 66, 020101(R) (2002). Google Scholar * Pálsson, G. K., Bliersbach, A., Wolff, M., Zamani, A. &
Hjörvarsson, B. Using light transmission to watch hydrogen diffuse. _Nat. Commun._ 3, 892 (2012). PubMed PubMed Central Google Scholar * Klose, F., Rehm, C., Nagengast, D., Maletta, H.
& Weidinger, A. Continuous and reversible change of the magnetic coupling in an Fe/Nb multilayer induced by hydrogen charging. _Phys. Rev. Lett._ 78, 1150 (1997). CAS Google Scholar *
Hjörvarsson, B. et al. Reversible tuning of the magnetic exchange coupling in Fe/V(001) superlattices using hydrogen. _Phys. Rev. Lett._ 79, 901 (1997). Google Scholar * Zhang, W., Luo, S.
& Flanagan, T. B. Hydrogen solution in homogeneousPd–Fe alloys. _J. Alloy. Compd_ 1–6, 293–295 (1999). Google Scholar * Wang, D., Lee, K.-Y., Luo, S. & Flanagan, T. B. The
thermodynamics of hydrogen absorption/desorption by Pd–Co alloys. _J. Alloy. Compd_ 252, 209–218 (1997). CAS Google Scholar * Lueng, C., Lupo, P., Metaxas, P. J., Kostylev, M. &
Adeyeye, A. O. Nanopatterning-enhanced sensitivity and response time of dynamic Palladium/Cobalt/Palladium hydrogen gas sensors. _Adv. Mater. Technol._ 1, 1600097 (2016). Google Scholar *
Lin, W. C., Tsai, C. J., Wang, B. Y., Kao, C. H. & Pong, W. F. Hydrogenation induced reversible modulation of perpendicular magnetic coercivity in Pd/Co/Pd films. _Appl. Phys. Lett._
102, 252404 (2013). Google Scholar * Munbodh, K. et al. Effects of hydrogen/deuterium absorption on the magnetic properties of Co/Pd multilayers. _Phys. Rev. B_ 83, 094432 (2011). Google
Scholar * Lin, W. C., Tsai, C. J., Liu, X. M. & Adeyeye, A. O. Critical hydrogenation effect on magnetic coercivity of perpendicularly magnetized Co/Pd multilayer nanostructures. _J.
Appl. Phys._ 116, 073904 (2014). Google Scholar * Munbodh, K., Perez, F. A. & Lederman, D. Changes in magnetic properties of Co/Pd multilayers induced by hydrogen absorption. _J. Appl.
Phys._ 111, 123919 (2012). Google Scholar * Lin, W. C. et al. Hydrogen-mediated long-range magnetic ordering inPd-rich alloy film. _Appl. Phys. Lett._ 106, 12404 (2015). Google Scholar *
Gerber, A., Kopnov, G. & Karpovski, M. Hall effect spintronics for gas detection. _Appl. Phys. Lett._ 111, 143505 (2017). Google Scholar * Lin, W. C., Wang, B. Y., Huang, H. Y., Tsai,
C. J. & Mudinepalli, V. R. Hydrogen absorption-induced reversible change in magnetic properties of Co-Pd alloy films. _J. Alloy. Compd_ 661, 20–26 (2016). CAS Google Scholar * Liang,
J. Y. et al. Using magnetic structure ofCo40Pd60/Cu for the sensing of hydrogen. _Appl. Phys. Lett._ 111, 023503 (2017). Google Scholar * Chang, C. S., Kostylev, M. & Ivanov, E.
Metallic spintronic thin film as a hydrogen sensor. _Appl. Phys. Lett._ 102, 142405 (2013). Google Scholar * Chang, P. C., Chen, Y. C., Hsu, C. C., Chiu, H. C. & Lin, W. C.
Hydrogenation-induced reversible spin reorientation transition in Co50Pd50 alloy thin films. _J. Alloy. Compd_ 710, 37–46 (2017). CAS Google Scholar * Zhang, W., Liu, Z., Belotelov, V. I.,
Wang, Q. & Song, Y. The magnetic properties of CoFeB and CoFeB/Ag nanodot arrays fabricated by a template transfer imprinting method. _Thin Solid Films_ 660, 301–305 (2018). CAS Google
Scholar * Zhang, W. et al. Tunable magneto-optical Kerr effects of nanoporous thin films. _Sci. Rep._ 7, 2888 (2017). PubMed PubMed Central Google Scholar * Bossini, D., Belotelov, V.
I., Zvezdin, A. K., Kalish, A. N. & Kimel, A. V. Magnetoplasmonics and femtosecond optomagnetism at the nanoscale. _ACS Photon._ 3, 1385–1400 (2016). CAS Google Scholar * Chang, P.-C.,
Liu, C.-M., Hsu, C.-C. & Lin, W.-C. Hydrogen-mediated magnetic domain formation and domain wall motion in Co30P_d_ 70 alloy films. _Sci. Rep._ 8, 6656 (2018). PubMed PubMed Central
Google Scholar * Lin, W. C. et al. Hydrogenation-induced change of magneto optical kerr effect in Pd/Fe bilayers. _J. Appl. Phys._ 112, 63914 (2012). Google Scholar * Zlotea, C. et al.
Hydrogen sorption properties of Pd–Co nanoalloys embedded into mesoporous carbons. _Nanoscale_ 7, 15469–15476 (2015). CAS PubMed Google Scholar * Teichmann, N., Hamm, M. & Pundt, A.
Fast lateral hydrogen diffusion in magnesium-hydride films on sapphire substrates studied by electrochemical hydrogenography. _Int. J. Hydrog. Energy_ 43, 1634–1642 (2018). CAS Google
Scholar * Lin, W. C., Chang, P.-C., Tsai, C.-J., Shieh, T.-C. & Lo, F.-Y. Voltage-induced reversible changes in the magnetic coercivity of Fe/ZnO heterostructures. _Appl. Phys. Lett._
104, 062411 (2014). Google Scholar * Lo, F. Y. et al. Paramagnetic dysprosium-doped zinc oxide thin films grown by pulsed-laser deposition. _J. Appl. Phys._ 117, 213911 (2015). Google
Scholar Download references ACKNOWLEDGEMENTS This study was financially supported by the Ministry of Science and Technology of Taiwan under grants nos. MOST 105-2628-M-003-001-MY3 and MOST
105-2633-M-003-001. AUTHOR INFORMATION AUTHORS AND AFFILIATIONS * Department of Physics, National Taiwan Normal University, 11677, Taipei, Taiwan Po-Chun Chang, Yun-Ying Chang, Wei-Hsiang
Wang, Fang-Yuh Lo & Wen-Chin Lin Authors * Po-Chun Chang View author publications You can also search for this author inPubMed Google Scholar * Yun-Ying Chang View author publications
You can also search for this author inPubMed Google Scholar * Wei-Hsiang Wang View author publications You can also search for this author inPubMed Google Scholar * Fang-Yuh Lo View author
publications You can also search for this author inPubMed Google Scholar * Wen-Chin Lin View author publications You can also search for this author inPubMed Google Scholar CONTRIBUTIONS
W.C.L. and F.Y.L. conceived the experiments. P.C.C. and Y.Y.C. conducted the experiments. W.C.L., P.C.C., and W.H.W. analyzed the results. CORRESPONDING AUTHOR Correspondence to Wen-Chin
Lin. ETHICS DECLARATIONS COMPETING INTERESTS The authors declare no competing interests. ADDITIONAL INFORMATION PUBLISHER’S NOTE: Springer Nature remains neutral with regard to
jurisdictional claims in published maps and institutional affiliations. SUPPLEMENTARY INFORMATION SUPPLEMENTARY INFORMATION RIGHTS AND PERMISSIONS OPEN ACCESS This article is licensed under
a Creative Commons Attribution 4.0 International License, which permits use, sharing, adaptation, distribution and reproduction in any medium or format, as long as you give appropriate
credit to the original author(s) and the source, provide a link to the Creative Commons license, and indicate if changes were made. The images or other third party material in this article
are included in the article’s Creative Commons license, unless indicated otherwise in a credit line to the material. If material is not included in the article’s Creative Commons license and
your intended use is not permitted by statutory regulation or exceeds the permitted use, you will need to obtain permission directly from the copyright holder. To view a copy of this
license, visit http://creativecommons.org/licenses/by/4.0/. Reprints and permissions ABOUT THIS ARTICLE CITE THIS ARTICLE Chang, PC., Chang, YY., Wang, WH. _et al._ Visualizing hydrogen
diffusion in magnetic film through magneto-optical Kerr effect. _Commun Chem_ 2, 89 (2019). https://doi.org/10.1038/s42004-019-0189-1 Download citation * Received: 18 October 2018 *
Accepted: 21 June 2019 * Published: 30 July 2019 * DOI: https://doi.org/10.1038/s42004-019-0189-1 SHARE THIS ARTICLE Anyone you share the following link with will be able to read this
content: Get shareable link Sorry, a shareable link is not currently available for this article. Copy to clipboard Provided by the Springer Nature SharedIt content-sharing initiative