- Select a language for the TTS:
- UK English Female
- UK English Male
- US English Female
- US English Male
- Australian Female
- Australian Male
- Language selected: (auto detect) - EN
Play all audios:
ABSTRACT Tree successional diversity is evident even to casual observers and has a well-understood physiological basis. Various life history trade-offs, driven by interspecific variation in
a single trait, help maintain this diversity. Conspecific negative density dependence (CNDD) is also well-documented and reduces tree vital rates independently of succession strategies. The
CNDD hypothesis is frequently justified by specialist natural enemies at a separate trophic level. We integrate these processes into an analytical demographic model, spanning short-term
plant physiological responses to the dynamics of a large forest mosaic connected to a metacommunity. Surprisingly, multiple trade-offs do not necessarily increase diversity, as suboptimal
trait combinations lead to strategies that cannot compete for successional niches, explaining the weak correlation between functional traits and succession position. Succession alone can
sustain half of the species in the metacommunity, with diversity increasing linearly with CNDD strength. The steeper increase with larger metacommunities suggests CNDD plays a greater role
in tropical forests. However, if each successional type contains multiple equivalent species, CNDD maintains diversity but becomes less effective in promoting successional diversity,
consistent with some tropical forests being less successional diverse. Additionally, CNDD enhances the likelihood of successful speciation and shifts life-history trait frequency by
affecting more late-successional species. SIMILAR CONTENT BEING VIEWED BY OTHERS CONTRIBUTION OF CONSPECIFIC NEGATIVE DENSITY DEPENDENCE TO SPECIES DIVERSITY IS INCREASING TOWARDS LOW
ENVIRONMENTAL LIMITATION IN JAPANESE FORESTS Article Open access 21 September 2021 FREQUENCY-DEPENDENT ASSEMBLY PROCESSES DETERMINE THE COEXISTENCE AND RELATIVE ABUNDANCE OF TROPICAL PLANT
SPECIES Article 23 December 2024 LATITUDINAL PATTERNS IN STABILIZING DENSITY DEPENDENCE OF FOREST COMMUNITIES Article Open access 28 February 2024 INTRODUCTION While the mechanisms that
generate large-scale diversity patterns are still under investigation, successional dynamics and conspecific negative density dependence (CNDD) are often considered key processes for species
assembly at local scales1,2,3, though other factors, such as resource specialization and immigration are not less important. Succession is the sequential change in forest composition and
structure following disturbances4. It can operate on a wide range of spatial and temporal scales, from gap-phase dynamics generated by windthrow or other locally confined mortality events to
large-scale calamities such as fires, hurricanes, floods, and logging5,6,7,8. Roughly two-thirds of the global forested area is classified as secondary forest9, making the succession study
particularly relevant to conservation problems. This study focuses on sequential changes that occur within a time frame of the intervals between disturbances and in the same order of
magnitude as the life span of the longest-lived plants in the successional sequence4. Sequential implies that once a species is excluded from the canopy, it will not have access again unless
a new disturbance occurs. The diversity of strategies in the successional sequence, referred to as successional diversity, is often linked to life-history tradeoffs, such as the tradeoff
between tree high-light growth and low-light mortality or between growth and reproduction10,11. Recent modeling studies demonstrate how these tradeoffs can maintain many species similar to
the competition-colonization tradeoff12,13,14. Conspecific negative density dependence (CNDD) could affect any life stage of a tree, but most examples, including this study, refer to
early-life biotically-mediated feedbacks that reduce the establishment of offspring near conspecific adults, including their mother2,15. Empirical evidence of CNDD operating in forest
ecosystems is extensive, and although this mechanism was initially proposed to explain the local diversity of tropical forests, it has also been observed to operate at higher
latitudes16,17,18,19,20,21,22,23,24. There is a pressing need for mathematical frameworks integrating multiple coexistence mechanisms, as the majority consider only a single mechanism,
potentially hindering progress for decades. Such frameworks are necessary to weigh the relative importance of these mechanisms and assess their interactions, which only integrative
approaches can achieve. For example, CNDD is a mechanism that stabilizes and promotes coexistence by increasing intraspecific competition25,26. However, theoretical models that have
investigated the importance of CNDD in maintaining diversity reached discordant conclusions27,28,29. One of the problems in doing that is that the application of this principle to predict
forest diversity has been limited by the difficulty of finding a way to realistically propagate a local process that operates at early life stages across the lives of long-lived organisms
that vary in size by orders of magnitude and that compete strongly for limited resources30,31. Introducing CNDD in neutral communities provides a simplified context for understanding the
potential role of density-dependent mechanisms32,33. However, this simplified scenario may not fully capture the complexity of real-world ecosystems where competitive interactions play a
significant role28,34. In more realistic cases where communities undergo competitive exclusions, the importance of CNDD may vary depending on various factors such as species traits,
environmental conditions, and the intensity of competition. Competitive exclusions can result in the dominance of certain species, potentially influencing the effectiveness of CNDD in
promoting diversity. A comprehensive forest diversity theory should also be framed from an evolutionary perspective to explain how plant traits are selected from a broader species pool and
assembled in local communities, how species interactions drive trait distribution, and how these dynamics generate feedback on larger scales. A practical approach is to connect local forests
to a metacommunity, where species traits evolve over extended evolutionary timescales. This study proposes incorporating conspecific negative density dependence (CNDD) into a vegetation
dynamic model (VDM) linked to a metacommunity. Such a process-based model can be developed using environmentally dependent physiological functions, including photosynthesis, respiration, and
plant carbon economy, thereby linking life history strategies with plant traits. By doing so, we can integrate CNDD into forest demography, offering valuable insights into its interactions
with other key forest processes, such as competition for light, speciation, and community structuring through successional dynamics. The investigation of the maintenance of functional
diversity in current VDMs is an important emerging field of research35,36,37,38. Previous studies using forest simulators have shown that including CNDD facilitates coexistence in these
models39,40, thus, the questions are how much and how much. Detto et al.12 proposed the first analytically tractable model that predicts successional diversity and yet is consistent with
individual-based forest stand simulators and the ecosystem components of some Earth System Models41,42. That study identified four possible life-history tradeoffs, each created by
interspecific variation in a single plant trait and each able to maintain high successional diversity, including maximum leaf photosynthetic capacity (growing fast in high light vs.
surviving in low light), fraction of carbon allocated to reproduction (growth vs. reproduction), an allometric parameter relating crown size to stem biomass (growing up vs. growing out), and
age at first reproduction (shifting carbon from growth to reproduction later vs. earlier in life). In this study, we ask how all these tradeoffs interact to maintain functional diversity,
i.e., the number of species with a unique combination of traits. If \(N\) species can be maintained with one tradeoff, are \(2N\) maintained with 2 tradeoffs, or even \({N}^{2}\)? Moreover,
how does the addition of CNDD increase diversity? Does increased diversity, if any, entail greater or lesser successional diversity? Does CNDD alter the rate at which species are assembled
on evolutionary scales? To answer these questions, we extend the model in Detto et al.12 to include CNDD and interspecific variation in multiple parameters and, thus, multiple successional
tradeoffs. The goal is to derive a mathematical and graphical theory that can explain coexistence and predict richness and related macro-ecological functions for a given pool of species and
as a function of the strength of CNDD. METHODS SUCCESSIONAL FOREST MODEL Successional dynamics are usually studied with forest patch models, which have a well-understood theoretical and
empirical basis43,44, but often require stochastic simulations or numerical integrations4,7. The model in Detto et al.12 is based on a set of integro-partial differential equations governing
the age- and size-structured dynamics of a multi-species community of trees in an infinite successional mosaic of patches in a steady state. However, this model can be accurately defined
and analyzed with simple methods that are primarily verbal and graphical. Trees are assumed to interact only with neighbors within the same successional patch by overtopping and shading one
another, and patches are dynamically coupled through seed dispersal. Both reproduction and growth of plants in the understory are assumed to be negligible. Patches are subjected to random
disturbances, which kill all the trees but leave a fraction of the seeds or seedlings, resetting succession. Recruits close the canopy early in succession, so post-disturbance regeneration
is governed by individuals present in the site as seeds or seedlings when the disturbance occurs. This implies that, in each patch, all canopy individuals of a given species at any one time
have identical sizes (but not individuals that fall into the understory and effectively stop growing). Moreover, all canopy individuals started growing simultaneously – when the most recent
disturbance removed the canopy that was shading them. Crucial to the model are the patch dynamics between disturbances. These dynamics are marked by sequential exclusions from the canopy as
taller plants overtop smaller plants and send them into the understory45,46. As succession progresses, growth leaves room for fewer and fewer individuals in the canopy. REPRODUCTION AND
DENSITY DEPENDENCE EFFECTS Reproduction of canopy individuals is continuous, size-dependent, and species-specific, and dispersing seeds have an equal probability of landing in any patch
where they accumulate. Plants allocate a fixed fraction of net primary productivity, \({{\rm{\varphi }}}\), to seeds. Seeds may germinate immediately, after which seedlings suffer understory
rates of mortality and growth until the next disturbance, or they may suffer seed mortality and germinate at the start of the next disturbance. Disturbances kill all the trees but leave a
fraction of the seeds or seedlings, resetting succession. The seeds and seedlings are subjected to conspecific density-dependence (CNDD), such as those associated with specialized natural
enemies. CNDD can operate at seed production or at the seedling stage. In either case, as the number of adult trees increases, fecundity or seedling survival in the understory decreases. We
express the mean density of recruits of species-\(i\) in the understory \({R}_{i}\), as: $${R}_{i}=\frac{{f}_{i}}{{m}_{i}}\frac{{p}_{i}}{1+{{\rm{\beta }}}{p}_{i}}$$ (1) where \({p}_{i}\) is
the probability of species-\(i\) to have access to the canopy space in the forest mosaic, \({f}_{i}\) and \({m}_{i}\) are the fecundity rate per unit of crown area and the seedling mortality
in the understory with no CNDD, and \({{\rm{\beta }}}\) is the Berverton-Holt CNDD parameter, which ranges as the strength of CNDD increases from zero to infinity47. \({f}_{i}\) and
\({m}_{i}\) can be species-specific depending on the trade-off type. For example, under the growth-fecundity trade-off, species vary in the number of seeds produced per unit of crown area.
However, trade-offs like growth ‘up’ vs. growth ‘out’ or fast growth in light vs. low survival in shade remain constant across species. Thus, the model permits density-dependent mortality
caused by shading or CNDD. It also permits density-independent mortality in the understory for all stages, including seeds, seedlings and adults, and density-independent disturbance that
kills all individuals except for a fraction of seeds or seedlings. However, the model ignores _all other density-independent mortality of canopy trees_, which is probably smaller than any of
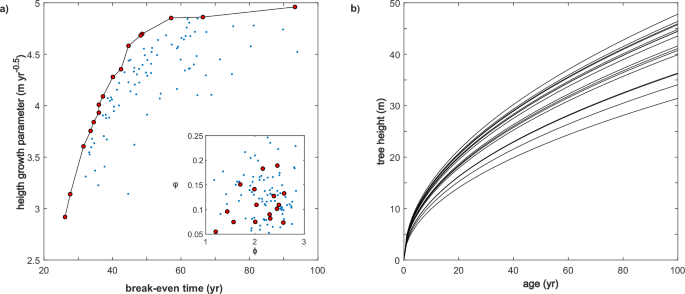
the sources of mortality that are included. PLANT LIGHT INTERACTIONS Exclusions from canopy access can occur in two ways. In the first, early successional dominants have the fastest initial
height growth rate but eventually either slow their height growth or die and cede the canopy to slow-growing shade-tolerant species. In the second, growth trajectories never cross (Fig.
1b). Early successional specialists accumulate lifetime reproductive success faster than late successional dominants but have slower height growth throughout their lives. This kind of
tradeoff can be created in many different ways. For example, because carbon allocated to stem tissue does not go to seeds or flowers, interspecific variation in height allometry causes a
tradeoff between the accumulation rate of lifetime reproductive success and the height growth rate. Interspecific variation in reproductive allocation does the same thing. A less obvious
example causes succession from shade-tolerant species to giant, long-lived shade-intolerant species. Although less familiar, this type of successional dynamics can be quite common and leads
to canopy dominance by long-lived or giant pioneers48,49, including large, majestic, exceptionally old trees50. Succession from shade-tolerant species to long-lived shade intolerants can be
caused simply by variation in the full sun photosynthetic rate and associated leaf respiration. In this paper, to maintain mathematical tractability, we focus only on cases in which height
growth trajectories do not cross and thus do not consider the familiar examples of fast-growing short-lived pioneers that dominate the canopy early but then give way to slower-growing
species. THE “PERFECT” TRADEOFF Species differ in their height growth rates (\(g\)) and break-even time (\(r\)), which is the age at which an individual growing in full sun achieves a
lifetime reproductive success (\({LRS}\)) of one, assuming no CNDD51. An individual reaches \({LRS}=1\) when at least one of its offsprings survive a disturbance event and begins growing in
full sun. Typically, allocation tradeoffs constrain tall species that grow fast in height by taking longer to reach \({LRS}=1\)52,53,54,55. A variation in a single trait or a combination of
traits can achieve this tradeoff. To illustrate this concept, we consider a pool of species that varies in two independent traits: the fraction of net plant productivity allocated to
reproduction, \({{\rm{\varphi }}}\), and an allometric parameter \({{\rm{\phi }}}\) that regulates the crown size (\(a\)) relative to structural biomass (\(b\)), i.e., \(b={{\rm{\phi
}}}{a}^{\frac{c}{c+1}}\), where \(c\) is an allometric exponent. Random variation in these two traits generates a tradeoff between \(g\) and \(r\) but with some variability (Fig. 1a). For a
given break-even time, there is an optimal trait combination that confers fast growth (red cycles). In a competitive environment, these species will overtop the suboptimal species (points
below the envelope) before they can reach \({LRS}=1\), making it impossible for them to compete. To see that, imagine a two-species system with \({g}_{1} > {g}_{2}\). At equilibrium, the
highest species-1 closes the canopy before reaching \({LRS}=1\) (i.e., at time less than \({r}_{1}\)). A necessary condition for the coexistence of species-2 is to reach \({LRS}=1\) before
species-1 closes the canopy, i.e., \({r}_{2} < {r}_{1}\). In practice, this implies that a species that grows slower than its competitor must reach \({LRS}=1\) faster: it cannot be
defective in both aspects. Consequently, for the successional model to maintain coexistence, species must satisfy the following necessary (but not sufficient) conditions: $${r}_{1} \, >
\, {r}_{2}\, > \, \ldots \, > \, {r}_{n}\,,\,{g}_{1} \, > \, {g}_{2}\, > \, \ldots \, > \, {g}_{n}$$ (2) Inequalities (1) represent a “perfect” tradeoff and reduce a
multidimensional life-history trait space to a single axis, even if there is no physiological or structural tradeoff between \(g\) and \(r\), with early successional species having small
\(r\) and late successional big \(r\). The condition for coexistence is more stringent and must be determined by the exact sequential times the canopy closes (see below). This is why the
condition is necessary but not sufficient. POPULATION EQUILIBRIUM AND COEXISTENCE CONDITION At equilibrium, the population of species \(i\) is governed by the following equations
(Supplementary Appendix A): $${p}_{i}={t}_{i-1}-{t}_{i}$$ (3) where \({t}_{i}\) is the time when species-\(i\) individuals start to be overtopped and \({t}_{i-1}\) is the time when the last
individual enters the understory (Fig. 2). At equilibrium, \({t}_{i} < {r}_{i} < {t}_{i-1}\), because otherwise, all individuals of species-\(i\) would have \({LRS} > 1\) or \({LRS}
< 1\), so the system would not be at equilibrium (Fig. 2). \({t}_{i}\) are computed from the condition that the canopy is closed, i.e. the sum of the crown area of all individuals in the
canopy equals patch size. To derive (3), time is transformed so the patch-age distribution becomes uniform between zero and one. The interval \({{{\rm{\xi }}}}_{i}={t}_{i-1}-{r}_{i}\)
defines the _safety distance_ of species-\(i\) from the canopy exclusion time set by taller competitors (\({t}_{i-1}\), Fig. 2). The further a species’s \(r\) from this line, the more
patches will be occupied by individuals with \({LRS} > 1\), leading to a higher population density. Conversely, the closer a species’s \(r\) is to \({t}_{i-1}\), the lower the population
density is, the greater the risk of extinction (in a stochastic system). The interval \({{{{\rm{\varepsilon }}}}_{i}=r}_{i}-{t}_{i}\) represents the non-invasibility interval, or _niche
shadow_14, of species_-_\(i\). No species with a break-even time \(r\) within this interval can successfully invade a community of taller species at equilibrium. Because competition is
asymmetric, the condition for stable coexistence given by the mutual invasion criterion56 of species-\(i\) in a community of taller competitors reduces to: $${r}_{i}\, < \, {t}_{i-1}$$
(4) THE METACOMMUNITY AND EVOLUTIONARY ADAPTATION The species that can coexist in the forest mosaic are selected from a pool of \({J}_{M}\) species that satisfy the inequalities given in Eq.
(1). The number and composition of species in the metacommunity vary on evolutionary time scales, so they can be considered ‘frozen’ regarding the dynamics in the forest mosaic57. Most of
our results are obtained assuming a uniform distribution of break-even times among the species in the metacommunity. This distribution is bounded between \({r}_{\min }\) and \({t}_{0}=1\),
representing the minimum and maximum age that is biologically feasible given the disturbance regime (i.e. an individual growing exclusively in full sun will have expected \({LRS} > 1\)).
These assumptions allow us to derive species richness, species abundance distribution, and the distribution of break-even time analytically (Supplementary Appendix B). In the final analyses
of the paper, we introduce an evolutionary model with genetic drift and trait selection that can generate an evolutionarily stable distribution of break-even times to study how fast richness
is generated, how species composition changes over evolutionary time, and how CNDD affects these dynamics. We will also explore the differences between mutations in a single trait and two
traits to generate diversity using allocation to reproduction and the allometric parameter regulating crown size to biomass as physiological traits. In this model, species evolve from a
common ancestor. A speciation event marks the origin of a species with a new \(r\) and \(g\). Physiological traits evolve as a Gaussian jump process on a continuous trait axis58. Selection
is based on competition outcomes in the local community as new species may successfully establish and cause resident species to be excluded. Species that fail to invade successfully or are
excluded from the local community risk extinction in the metacommunity, creating a feedback loop between local and metacommunity dynamics. STATISTICS AND REPRODUCIBILITY As a case study, we
used the forest inventory data of the 50-ha plot of Barro Colorado Island to fit the species abundance distribution model. The inventories contain all trees with a diameter at breast height
(DBH) greater or equal 1 cm, mapped with coordinates relative to the plot, with species identified and DBH measured59. Since our model does not track individuals in the understory, we
selected trees based on their canopy access by calculating the fraction of each tree’s crown area with direct light exposure. We assumed the crowns to be perfect circles centered at the stem
location, with crown radius and height estimated from site-specific allometric equations42,60. This approach allowed us to determine the extent to which each tree’s crown area is not
overlapped by a taller neighboring tree. We selected only trees with at least 25% exposure and DBH\(\ge \)10 cm, resulting in an average of 7163 individuals and 203 species per census across
eight censuses conducted in 1982, 1985, 1990, 1995, 2000, 2005, 2010, and 2015. The frequency histogram was computed by the modified Preston’s binning method given by the following
formula61: $${F}_{0}=\frac{1}{2}{s}_{1}$$ $${F}_{1}=\frac{1}{2}{s}_{1}+\frac{1}{2}{s}_{2}$$ $${F}_{2}=\frac{1}{2}{s}_{2}+{s}_{3}+\frac{1}{2}{s}_{4}$$ $$\ldots $$
$${F}_{i}=\frac{1}{2}{s}_{{2}^{i-1}}+{s}_{{2}^{i-1}+1}+\ldots +{s}_{{2}^{i}-1}+\frac{1}{2}{s}_{{2}^{i}}$$ where \({s}_{i}\) is the number of species with \(i\) individuals. The frequency
histogram was calculated for each of the eight available censuses and then averaged. We fit the simple model without CNDD. We compute the number of species with \(i\) individuals by
discretizing Eq. (15) in Supplementary Appendix B as: $${s}_{i}=\frac{{{\rm{\lambda }}}}{2\sqrt{1-2i\Delta z}}{e}^{-{{\rm{\lambda }}}{r}_{-}\left(i\Delta z\right)}\Delta
z+\frac{{{{\rm{\lambda }}}}^{2}}{4}\left[{Ei}\left({{\rm{\lambda }}}{r}_{-}\left(i\Delta z\right)\right)-{Ei}\left({{\rm{\lambda }}}{r}_{+}\left(i\Delta z\right)\right)\right]\Delta z$$
where \({E}_{i}\left(\cdot \right)\) is the integral exponential function and \({r}_{\pm }(z)\) are the solution of \({2r}^{2}-2r+z\). This model has only two free parameters:
\({{\rm{\lambda }}}\) and the scaling factor \(\Delta z\). We fit these parameters by minimizing the sum of square errors between observations and model: $${\min }_{{{\rm{\lambda }}},\Delta
z}{\Sigma }_{i}{\left({F}_{i}^{{obs}}-{F}_{i}^{{\mathrm{mod}}}\right)}^{2}$$ using the function fmincon in Matlab (R2019a). REPORTING SUMMARY Further information on research design is
available in the Nature Portfolio Reporting Summary linked to this article. RESULTS A GRAPHICAL METHOD The model belongs to a family of tractable competition models of ecological assembly
whose stable equilibrium is independent of changes in invasions’ order, size, and timing62. Figure 3a shows a dynamic simulation of six species quickly reaching an equilibrium where two
species go extinct (gray lines). The determination of species that coexist in the forest mosaic from the metacommunity can be illustrated with a graphical method. The graph in Fig. 3b
represents the \({LRS}\) of plants with full access to light as a function of the patch age (time since last disturbance), where each line corresponds to each of the six species in the
metacommunity. The break-even times (dots) are the age when \({LRS}=1\) (horizontal dashed line). As mentioned above, the age axis is transformed so the maximum patch age is \({t}_{0}=1\).
Because of the tradeoff between break-even time and height growth, species on the graph are ranked from shortest to tallest—the method proceeds from right to left. Only species with \(r\)
smaller than \({t}_{0}=1\) can be established, so all species with \(r\) greater than \({t}_{0}\) are rejected a priori (e.g., the last species on the right of Fig. 3b). The first species to
establish, ranked 1, which is also the tallest species in the mosaic, is the species with the greatest \(r\) less \({t}_{0}\) (\({r}_{1}\) in Fig. 3b). At equilibrium, species-1 will close
the canopy at time \({t}_{1}\)(vertical red line), setting a new boundary for the next species in the successional sequence. The next species that will persist is the species with the
greatest \({r < t}_{1}\) (\({r}_{2}\) in Fig. 3b). At equilibrium, the first two species will close the canopy at time \({t}_{2}\), which is the new boundary for the third species in the
sequence and so on. This simple recursive algorithm can be repeated until no more species in the metacommunity are left. Note that, in the graphical example \({t}_{2}\) precludes one species
from establishing (the species depicted by a gray curve between the curves for species-2 and species-3). SPECIES RICHNESS AND THE ROLE OF CNDD The _safety distance_ \({{{{\rm{\xi
}}}}_{i}=t}_{i-1}-{r}_{i}\) is a random variable that depends solely on the distribution of \(r\) in the metacommunity. For example, if the distribution is uniform, \({{\rm{\xi }}}\) is
exponentially distributed with rate \(\frac{{J}_{M}}{1-{r}_{\min }}\). The _niche shadow_ \({{{{\rm{\varepsilon }}}}_{i}=r}_{i}-{t}_{i}\) is also a random variable and can be derived from
the population Eq. (3). Interestingly, the _niche shadow_ and the _safety distance_ are approximatively linearly proportional (b and Supplementary Appendix A): $${{{\rm{\varepsilon
}}}}_{i}\cong \frac{c+1-2{{\rm{\beta }}}{r}_{i}}{c+1+2{{\rm{\beta }}}{r}_{i}}{{{\rm{\xi }}}}_{i}$$ (5) This relation allows us to compute several macroecological properties using the renewal
process analogy (Supplementary Appendix B). For example, in the case without CNDD (\({{\rm{\beta }}}=0\)), the intervals between break-even times in the mosaic are twice those in the
metacommunity because \({{{\rm{\varepsilon }}}}_{i}\cong {{{\rm{\xi }}}}_{i}\) (Fig. 5b). Consequently, the number of species that coexist in the mosaic is roughly half the number in the
metacommunity \({J}_{M}\). For sufficiently large \({J}_{M}\), the general formula for successional diversity subjected to CNDD can be approximated by a linear function (Supplementary
Appendix B): $$s\cong 1+\left(1+{{\rm{\beta }}}\frac{{r}_{\min }+1}{c+1}\right)\frac{{J}_{M}}{2}$$ (6) Equation (6) and Fig. 4a show that \({{\rm{\beta }}}\) interacts with \({J}_{M}\) in
promoting diversity: the larger the species pool, the larger the increase in diversity with CNDD. Another consequence of Eq. (5) is that CNDD reduces recruits more for late-successional
species (Fig. 4b), thus influencing species distribution along succession, as we will see later. The graphical method offers an intuitive explanation of how CNDD operates in this system. In
Fig. 5a, species-_i_ (black line) closes the canopy at time \({t}_{i}\), which, in the absence of CNDD, can be found by taking \({{{\rm{\varepsilon }}}}_{i}\) roughly equal to \({{{\rm{\xi
}}}}_{i}\). This boundary prevents the earlier successional species (gray line) from establishing because its break-even time (gray dot) is greater than \({t}_{i}\). However, in the presence
of CNDD, \({{{\rm{\varepsilon }}}}_{i}^{{\prime} }\) is smaller than \({{{\rm{\xi }}}}_{i}\), Eq. (5), shifting \({t}_{i}\) to \({t}_{i}^{{\prime} }\) and allowing the earlier successional
species to coexist. SPECIES BREAK-EVEN TIME AND ABUNDANCE DISTRIBUTIONS Given the properties of \({{\rm{\xi }}}\) and \({{\rm{\varepsilon }}}\), we can now compute the probability
distribution of break-even times and species abundance using the renewal process analogy (Supplementary Appendix B): The distributions for different values of \({{\rm{\beta }}}\) are shown
in Fig. 6. Without CNDD, the break-even time distribution is flat and increases sharply near \(r=1\). With CNDD, the peak at \(r=1\) is reduced, and the probability increases linearly with
\(r\) (Fig. 6a). The species abundance distributions (Fig. 6b) show a clear peak that shifts on the left with increasing CNDD (the x-axis is logged so that a small shift might represent a
relatively large difference in abundance). This is consistent with the increase in richness; their abundance decreases as more species are fitted into the community. Note also that the shape
of the distribution is minimally affected by CNDD, for example, the skewness increases by 7% passing from \({{\rm{\beta }}}=0\) to \({{\rm{\beta }}}=0.75\). As an example, we fitted the SAD
model without CNDD to tree species abundance data from the Barro Colorado Island plot (Fig. 6c). Because our model tracks only individuals with access to the canopy, we include only trees
with at least 25% canopy access using a crown overlapping algorithm based on relative position and site-specific allometry (see Supplementary Appendix B for details). ADAPTIVE EVOLUTION So
far, we have connected the local community with a static metacommunity. To explore how traits evolve over time and how they interact with the local community dynamics, we run several
simulations using an evolutionary model. Each simulation starts with a single species at \(r={r}_{\min }\). No suboptimal strategies exist for the single trait mutation (allocation to
reproduction), so each new species can potentially compete for a successional niche. However, in the first stage, a newly speciated species can establish itself only if \(r\) is larger than
the resident, in which case, the new species will replace the resident. This continues, causing \(r\) to “walk” to the right until it is sufficiently close to one (i.e., \(r > {r}_{\min
}+{{\rm{\varepsilon }}}\)), making coexistence between the resident and a higher-\(r\) species possible. From this point, new species begin to invade to the right, left, or between the
resident species with smaller \(r\) than either resident. Species packing continues indefinitely until the simulation is stopped, with denser packing on the late-successional. Two factors
generate these dynamics. First, speciation to the right of the tallest species is always successful. Second, as the species get closer to one, their limiting similarity decreases,
approaching asymptotically zero as the number of species becomes infinite12. Equation (3) shows this, because \({{{\rm{\varepsilon }}}}_{i}\) is proportional to \({{{\rm{\xi }}}}_{i}\). As
more and more random species are drawn from the metacommunity, the \({{\rm{\xi }}}\)’s approach zero and so the \({{\rm{\varepsilon }}}\)’s also approach zero, which means the spacing
between coexist species also goes to zero. Figure 7a shows the increasing number of species as function of evolutionary time for different CNDD parameters \({{\rm{\beta }}}\). Because CNDD
reduces limiting similarities and increases the probability of successful speciation, species packing is faster in the presence of CNDD. For a given evolutionary time, species richness
increases linearly with the CNDD parameter (Fig. 7b). In the final analysis, we compare simulations for single-trait mutations with a multi-trait. Surprisingly, the multi-trait case does not
sustain more diversity than the single trait for a given metacommunity size but is slightly lower (Fig. 7c). The reason is that the multi-trait case generates suboptimal strategies that
cannot compete for a successional niche (Fig. 1a). DISCUSSION Our study integrates competition for limited resources, specialized natural enemies, and evolutionary dynamics, broadly
appreciated as among the most important processes governing plant community composition, structure, and function, into a unified theoretical framework. It elucidates the role of conspecific
negative feedback operating at early life stages in maintaining successional diversity in forest ecosystems with a strong competitive hierarchy. Despite the diversity of life-history
strategies determined by many plant traits and parameters, coexistence ultimately relies on species adhering to a single fundamental axis. By simplifying ecological complexity into a
tradeoff between height growth and break-even time, rather than increasing the number of niches, which is usually thought to create opportunities for coexistence, the model suggests that
optimizing these two demographics alone is sufficient to maintain high diversity. Thus, increasing the number of life-history traits does not necessarily facilitate coexistence because it
generates suboptimal strategies. This result differs from other successional models that found that two traits offer distinct mechanisms of successional differentiation13 because, in our
model, the effect of different traits can be recast into the same fundamental coexisting mechanism. Given the disparity between the number of plant traits that can influence \(g\) and \(r\)
and the dimension of successional diversity, it is likely that each successional type comprises several ecologically equivalent species, which could explain why coexisting species often
exhibit a wide range of functional traits that appear weakly correlated with their position along the successional axis63,64, as shown in the inset of Fig. 1a. Successional strategies not
considered in the current model, such as shade-tolerant shrubs that reproduce in the understory or fast-growing species with a small maximum stature, increase the dimensionality of the
problem53 but do not preclude equalization. The addition of CNDD in the successional model does not substantially alter the fundamental reasons for successional coexistence. While it is true
that CNDD makes a community more invasible by reducing limiting similarities, it is also true that evolutionary dynamics or repeated random invasions will also reduce limiting similarities
to zero in the limit, even in the absence of CNDD. The effect of CNDD in the successional model can be explained as a contraction of the _niche shadow_ in relation to the _safety distance_
(Fig. 5). All else equal, increasing CNDD causes species to become less abundant. This delays competitive exclusion times, as fewer individuals take more time to close the canopy. Longer
exclusion times mean potentially more species packing. In the presence of ecologically equivalent species within each successional type, the effect of CNDD on successional diversity is
diluted. When there are two or more species per successional strategy, CNDD promotes diversity within each strategy by reducing ecological drift33. However, in doing so, CNDD becomes less
effective in maintaining successional diversity. By definition, CNDD is a function of species abundance and not the abundance of the successional type. Thus, the more ecologically equivalent
species within each successional type, the weaker the average strength of CNDD is and, thus, the weaker the effect of CNDD on successional diversity (Supplementary Appendix A). This
paradoxical impact on diversity generates the counter-intuitive prediction that hyper-diverse forests are less successionally diverse, which appears to be consistent with the empirical
observation that the most diverse tropical forests have the least variation in demographic rates that imply successional diversity, i.e., variation between species-specific growth and
mortality rates consistent with successional diversity65,66,67. Importantly, CNDD modifies the frequency of successional types. The reason for the interaction between CNDD and succession
dynamics lies in the power-law function describing \({LRS}\) increase with age. This function is an important regulator of population density. As we demonstrated above, CNDD reduces limiting
similarities. However, because the slope of the \({LRS}\) around 1 is steeper for species with shorter \(r\) (Fig. 3b), these species can adjust their density with a smaller contraction of
the _niche shadow_. Thus, early successional species can still maintain relatively high recruit density and large limiting similarity even in the presence of CNDD (Fig. 4b). This mechanism
generates a diversity gradient along the successional axis, with more species packed in the late-successional end. Furthermore, CNDD can lead to diminishing benefit returns for species that
grow larger in size, especially if its effects were proportional to biomass (in the current model is proportional to area occupied by adults), because biomass grows faster than crown and
larger trees have more biomass per unit of reproductive area. In the successional model, CNDD can substantially increase diversity, but only by an incremental fraction of what is already
generated by the resource competition component of the model, which is roughly half of the available species pool. This result is in agreement with27,28, who show that while the introduction
of CNDD in a neutral model increases diversity by several folds, it has only marginal effects in tradeoff models. Consequently, in this model, large diversity gradients must be generated
primarily by differences in metacommunity size. However, the larger the metacommunity, the larger the increase in diversity promoted by CNDD (Fig. 4a), which might reconcile why CNDD is more
important for tropical forests despite evidence that higher latitude forests also experience similar CNDD effects16,19,68. Besides the fact that our model represents interactions among
species and individuals and competitive differences—the lack of such differences was the main limitation of Hubbell’s theory—the two frameworks present some affinities: both aim to predict
species diversity and species abundance distribution in a local forest community connected to a larger metacommunity and can be generalized to incorporate CNDD33. Hubbell argued that trait
variation in plants may not translate into ecological uniqueness. The collapse of plant diversity into a much smaller space of ecological variation is an interesting parallel between this
study and Hubbell’s neutral theory. Both theories envision a forest mosaic subjected to disturbance69. However, in our model, patch dynamics are explicitly represented, whereas, in Hubbell’s
model, the process is simplified to a single step: the patch is immediately filled by an individual randomly selected from the local community or, with some probability, from the
metacommunity without accounting for a dynamic structural component or size differences among individuals. Hubbell’s model operates on a finite domain and maintains the discreteness of
individuals, which is appealing for two key reasons: it accounts for drift and allows for direct comparisons with observational data, typically collected on a delimited portion of the
forest. This feature also allows computing the species-area curve. In contrast, our model represents a large number of patches and, in its current form, does not simulate drift. However,
apart from drift, our theory incorporates three of the four processes influencing species composition and diversity patterns70: selection, dispersal, and speciation, whereas Hubbell’s theory
includes drift, dispersal, and speciation. Finally, we note that, besides patch size and disturbance frequency, which in the current model are scaling factors (all set to one), the model
has only four governing parameters: the number of species in the metacommunity, the minimum break-even time, the allometric constant, and the CNDD parameter. However, the model without CNDD
is insensitive to the crown-biomass scaling (Eq. (3) and Supplementary Fig. B6), and, in principle, the scaling can be independently estimated from allometric relationships. So, for the case
without CNDD, there are only two free parameters:\(\frac{{J}_{M}}{1-{r}_{\min }}\) and a scaling factor to convert the number of individuals into density per patch area. Interestingly, it
has the same number of free parameters as the classic neutral model: metacommunity size (or speciation rate) and immigration probability. The model presented serves as an initial step
towards integrating multiple mechanistic processes into a forest diversity theory that is analytically tractable and enables the prediction of macroecological properties. However, before the
theory can be tested on data, some of the limitations of the current approach need to be addressed. The theory needs to include other forms of light competition and life-history strategies,
such as gap specialists and plants that thrive in the understory, which can generate successional axes that are orthogonal to the axis identified in this model. Furthermore, our model does
not track suppressed plants once they are folded in the understory, though this type of model allows us to represent them analytically, at least in a single understory layer71. It could also
be possible to include drift and immigration by treating each successional type as a sub-neutral community in a finite area, an avenue promising to reconcile neutral and niche theories. As
mentioned above, the model has only four free parameters. Although the example in Fig. 6c is encouraging, fitting these parameters to data will require integrating demographic and species
compositional datasets, including species and size abundance distributions72. For example, though not shown here, this type of model can predict forest structure, which could help constrain
some of the model parameters against observed size abundance distributions73. A comprehensive theory of forest diversity would enhance our ability to predict how ecosystems might respond to
environmental shifts, such as climate change or other human alterations of natural systems. This predictive capability is essential for informing conservation efforts and sustainable
management practices. DATA AVAILABILITY The 50 ha plot Barro Colorado Island data can be found on Dryad at https://doi.org/10.15146/5xcp-0d46. The source data for all the graphs provided in
the figures can be found at https://github.com/mdetto/Succession-and-CNDD in the file Data4Figs.xlsx. CODE AVAILABILITY All codes used in this study can be found at
https://github.com/mdetto/Succession-and-CNDD. REFERENCES * Grubb, P. J. The maintenance of species-richness in plant communities: the importance of the regeneration niche. _Biol. Rev._ 52,
107–145 (1977). Article Google Scholar * Janzen, D. H. Herbivores and the number of tree species in tropical forests. _Am. Nat_. 501–528 (1970). * Pacala, S. W. & Rees, M. Models
suggesting field experiments to test two hypotheses explaining successional diversity. _Am. Nat._ 152, 729–737 (1998). Article PubMed CAS Google Scholar * Huston, M. & Smith, T.
Plant succession: life history and competition. _Am. Nat._ 130, 168–198 (1987). Article Google Scholar * Connell, J. H. Diversity in tropical rain forests and coral reefs. _Sci. (80-.)_
199, 1302–1310 (1978). Article CAS Google Scholar * Horn, H. S. The ecology of secondary succession. _Annu. Rev. Ecol. Syst._ 5, 25–37 (1974). Article Google Scholar * Kohyama, T.
Size-structured tree populations in gap-dynamic forest-the forest architecture hypothesis for the stable coexistence of species. _J. Ecol._ 81, 131 (1993). Article Google Scholar *
Schliemann, S. A. & Bockheim, J. G. Methods for studying treefall gaps: A review. _Ecol. Manag._ 261, 1143–1151 (2011). Article Google Scholar * FAO. _Global Forest Resources
Assessment 2020: Main report_. https://doi.org/10.4060/ca9825en. (FAO, 2020). * Rüger, N. et al. Beyond the fast–slow continuum: demographic dimensions structuring a tropical tree community.
_Ecol. Lett._ 21, 1075–1084 (2018). Article PubMed Google Scholar * Russo, S. E. et al. The interspecific growth–mortality trade-off is not a general framework for tropical forest
community structure. _Nat. Ecol. Evol_. https://doi.org/10.1038/s41559-020-01340-9 (2020). * Detto, M., Levine, J. M. & Pacala, S. W. Maintenance of high diversity in mechanistic forest
dynamics models of competition for light. _Ecol. Monogr_. 92, (2022). * Falster, D. S., Brännström, Å., Westoby, M. & Dieckmann, U. Multitrait successional forest dynamics enable diverse
competitive coexistence. _Proc. Natl. Acad. Sci. USA_ 114, E2719–E2728 (2017). Article PubMed PubMed Central CAS Google Scholar * Miller, Z. R. et al. Coexistence of many species under
a random competition-colonization trade-off. _bioRxiv_ 2023.03.23.533867 (2023). * Mangan, S. A., Herre, E. A., Bever, J. D., Mangan, A. & James, D. Specificity between Neotropical tree
seedlings and their fungal mutualists leads to plant — soil feedback Published by: Ecological Society of America content in a trusted digital archive. We use information technology and
tools to increase productivity. _Ecology_ 91, 2594–2603 (2010). Article PubMed Google Scholar * Hille Ris Lambers, J., Clark, J. S. & Beckage, B. Density-dependent mortality and the
latitudinal gradient in species diversity. _Nature_ 417, 732–735 (2002). Article CAS Google Scholar * Yamazaki, M., Iwamoto, S. & Seiwa, K. Distance- and density-dependent seedling
mortality caused by several diseases in eight tree species co-occurring in a temperate forest. in _Forest Ecology: Recent Advances In Plant Ecology_ (ed. VanderValk, A. G.) 181–196.
https://doi.org/10.1007/978-90-481-2795-5_14 (2009). * Jiang, F., Zhu, K., Cadotte, M. W. & Jin, G. Tree mycorrhizal type mediates the strength of negative density dependence in
temperate forests. _J. Ecol_. 1–10. https://doi.org/10.1111/1365-2745.13413 (2020). * Song, X., Lim, J. Y., Yang, J. & Luskin, M. S. When do Janzen–Connell effects matter? A phylogenetic
meta-analysis of conspecific negative distance and density dependence experiments. _Ecol. Lett_. https://doi.org/10.1111/ele.13665. (2020). * Bagchi, R., Henrys, P. A. & Brown, P. E.
Spatial patterns reveal negative density dependence and habitat associations in tropical trees. _Ecology_ 92, 1723–1729 (2011). Article PubMed Google Scholar * Bennett, J. A. et al.
Plant-soil feedbacks and mycorrhizal type influence temperate forest population dynamics. _Sci. (80-.)_ 355, 181–184 (2017). Article CAS Google Scholar * Jia, S. et al. Tree species
traits affect which natural enemies drive the Janzen-Connell effect in a temperate forest. _Nat. Commun._ 11, 1–9 (2020). Article Google Scholar * Terborgh, J. At 50, Janzen–Connell Has
Come of Age. _Bioscience_ XX, 1–11 (2020). Google Scholar * Kalyuzhny, M., Lake, J. K., Wright, S. J. & Ostling, A. M. Pervasive within-species spatial repulsion among adult tropical
trees. _Sci. (80-.)_ 381, 563–568 (2023). Article CAS Google Scholar * Adler, P. B., HilleRislambers, J. & Levine, J. M. A niche for neutrality. _Ecol. Lett._ 10, 95–104 (2007).
Article PubMed Google Scholar * Ellner, S. P., Snyder, R. E., Adler, P. B. & Hooker, G. An expanded modern coexistence theory for empirical applications. _Ecol. Lett._ 22, 3–18
(2019). Article PubMed Google Scholar * Chave, J., Muller-Landau, H. C. & Levin, S. A. Comparing classical community models: theoretical consequences for patterns of diversity. _Am.
Nat._ 159, 1–23 (2002). Article PubMed Google Scholar * Chisholm, R. A. & Fung, T. Janzen-Connell effects are a weak impediment to competitive exclusion. _Am. Nat._ 196, 649–661
(2020). Article PubMed Google Scholar * May, F., Wiegand, T., Huth, A. & Chase, J. M. Scale-dependent effects of conspecific negative density dependence and immigration on
biodiversity maintenance. _Oikos_ 129, 1072–1083 (2020). Article Google Scholar * Addicott, J. F. et al. Ecological neighborhoods: scaling environmental patterns. _Oikos_ 49, 340 (1987).
Article Google Scholar * Schupp, E. W. The Janzen-Connell model for tropical tree diversity: population implications and the importance of spatial scale. _Am. Nat._ 140, 526–530 (1992).
Article PubMed CAS Google Scholar * Detto, M. & Muller-Landau, H. C. Stabilization of species coexistence in spatial models through the aggregation–segregation effect generated by
local dispersal and nonspecific local interactions. _Theor. Popul. Biol._ 112, 97–108 (2016). Article PubMed Google Scholar * Volkov, I., Banavar, J. R., He, F., Hubbell, S. P. &
Maritan, A. Density dependence explains tree species abundance and diversity in tropical forests. _Nature_ 438, 658–661 (2005). Article PubMed CAS Google Scholar * Cannon, P. G.,
Edwards, D. P. & Freckleton, R. P. Asking the wrong question in explaining tropical diversity. _Trends Ecol. Evol._ 36, 482–484 (2021). Article PubMed Google Scholar * Cheng, Y., Xia,
W., Detto, M. & Shoemaker, C. A. A framework to calibrate ecosystem demography models within earth system models using parallel surrogate global optimization. _Water Resour. Res._ 59,
1–15 (2023). Article CAS Google Scholar * Fisher, R. A. & Koven, C. D. Perspectives on the Future of Land Surface Models and the Challenges of Representing Complex Terrestrial
Systems. _J. Adv. Model. Earth Syst_. 12, (2020). * Maréchaux, I. & Chave, J. An individual-based forest model to jointly simulate carbon and tree diversity in Amazonia: description and
applications. _Ecol. Monogr._ 87, 632–664 (2017). Article Google Scholar * Powell, T. L. et al. Variation in hydroclimate sustains tropical forest biomass and promotes functional
diversity. _N. Phytol._ 219, 932–946 (2018). Article Google Scholar * Lischke, H. & Loeffler, T. J. Intra-specific density dependence is required to maintain species diversity in
spatio-temporal forest simulations with reproduction. _Ecol. Modell._ 198, 341–361 (2006). Article Google Scholar * Nakashizuka, T. & Kohyama, T. The significance of the asymmetric
effect of crowding for coexistence in a mixed temperate forest. _J. Veg. Sci._ 6, 509–516 (1995). Article Google Scholar * Koven, C. et al. Benchmarking and parameter sensitivity of
physiological and vegetation dynamics using the functionally assembled terrestrial ecosystem simulator (FATES) at Barro Colorado Island, Panama. _Biogeosciences Discuss_. 1–46.
https://doi.org/10.5194/bg-2019-409 (2019). * Cano, I. M. et al. Allometric constraints and competition enable the simulation of size structure and carbon fluxes in a dynamic vegetation
model of tropical forests (LM3PPA-TV). _Glob. Chang. Biol._ 26, 4478–4494 (2020). Article Google Scholar * Chambers, J. Q. et al. The steady-state mosaic of disturbance and succession
across an old-growth central Amazon forest landscape. _Proc. Natl Acad. Sci. Usa._ 110, 3949–3954 (2013). Article PubMed PubMed Central CAS Google Scholar * Shugart, H. H. & Smith,
T. M. A review of forest patch models and their application to global change research. _Clim. Change_ 34, 131–153 (1996). Article Google Scholar * Brokaw, V. L. N. Gap-phase Regeneration
in a Tropical Forest. _Ecology_ 66, 682–687 (1985). Article Google Scholar * Weiner, J. Asymmetric competition in plant populations. _Trends Ecol. Evol._ 5, 360–364 (1990). Article PubMed
CAS Google Scholar * Subbey, S., Devine, J. A., Schaarschmidt, U. & Nash, R. D. M. Modelling and forecasting stock-recruitment: current and future perspectives. _ICES J. Mar. Sci._
71, 2307–2322 (2014). Article Google Scholar * Rüger, N. et al. Demographic tradeoffs predict tropical forest dynamics. _Sci. (80-.)_ 368, 165–168 (2020). Article Google Scholar *
Santos, G. G. A., Santos, B. A., Nascimento, H. E. M. & Tabarelli, M. Contrasting Demographic Structure of Short- and Long-lived Pioneer Tree Species on Amazonian Forest Edges.
_Biotropica_ 44, 771–778 (2012). Article Google Scholar * Piovesan, G. & Biondi, F. On tree longevity. _New Phytol_. https://doi.org/10.1111/nph.17148 (2020). * Levine, J. I., Levine,
J. M., Gibbs, T. & Pacala, S. W. Competition for water and species coexistence in phenologically structured annual plant communities. _Ecol. Lett._ 25, 1110–1125 (2022). Article PubMed
Google Scholar * Ehrlén, J. & van Groenendael, J. M. The trade‐off between dispersability and longevity ‐ an important aspect of plant species diversity. _Appl. Veg. Sci._ 1, 29–36
(1998). Article Google Scholar * Kambach, S. et al. Consistency of demographic trade-offs across 13 (sub)tropical forests. _J. Ecol._ 110, 1485–1496 (2022). Article Google Scholar *
King, D. A., Wright, S. J. & Connell, J. H. The contribution of interspecific variation in maximum tree height to tropical and temperate diversity. _J. Trop. Ecol._ 22, 11–24 (2006).
Article Google Scholar * Salguero-Gómez, R. et al. Fast-slow continuum and reproductive strategies structure plant life-history variation worldwide. _Proc. Natl. Acad. Sci. USA_ 113,
230–235 (2016). Article PubMed Google Scholar * Grainger, T. N., Levine, J. M. & Gilbert, B. The invasion criterion: a common currency for ecological research. _Trends Ecol. Evol._
34, 925–935 (2019). Article PubMed Google Scholar * Volkov, I., Banavar, J. R., Hubbell, S. P. & Maritan, A. Patterns of relative species abundance in rainforests and coral reefs.
_Nature_ 450, 45–49 (2007). Article PubMed CAS Google Scholar * Landis, M. J. & Schraiber, J. G. Pulsed evolution shaped modern vertebrate body sizes. _Proc. Natl Acad. Sci. USA_
114, 13224–13229 (2017). Article PubMed PubMed Central CAS Google Scholar * Condit, R. et al. Complete data from the Barro Colorado 50-ha plot: 423617 trees, 35 years. _Dryad_
https://doi.org/10.15146/5xcp-0d46 (2019). Article Google Scholar * De Deurwaerder, H. P. T., Detto, M., Visser, M. D., Schnitzer, S. & Pacala, S. W. Linking physiology, epidemiology,
and demography: Understanding how lianas outcompete trees in a changing world. _Proc. Natl. Acad. Sci. USA_ 121, e2319487121 (2024). Article PubMed Google Scholar * Volkov, I., Banavar,
J. R., Hubbell, S. P. & Maritan, A. Neutral theory and relative species abundance in ecology. _Nature_ 424, 1035–1037 (2003). Article PubMed CAS Google Scholar * Serván, C. A. &
Allesina, S. Tractable models of ecological assembly. _Ecol. Lett._ 24, 1029–1037 (2021). Article PubMed Google Scholar * Wright, S. J. et al. Functional traits and the growth-mortality
trade-off in tropical trees. _Ecology_ 91, 3664–3674 (2010). Article PubMed Google Scholar * Zhang, C., Gu, R., Lin, L. & Russo, S. E. Functional traits and ecological niches as
correlates of the interspecific growth–mortality trade-off among seedlings of 14 tropical tree species. _Funct. Ecol_. 1888–1901 https://doi.org/10.1111/1365-2435.14624 (2024). * Condit, R.
et al. The importance of demographic niches to tree diversity. _Sci. (80-.)_ 98, 98–101 (2006). Article Google Scholar * Needham, J. F. et al. Demographic composition, not demographic
diversity, predicts biomass and turnover across temperate and tropical forests. _Glob. Chang. Biol._ 28, 2895–2909 (2022). Article PubMed CAS Google Scholar * Leite, M. et al. Major axes
of variation in tree demography across global forests. _bioRxiv_ 2023.01.11.523538 (2023). * Hülsmann, L. et al. Latitudinal patterns in stabilizing density dependence of forest communities
Check for updates. _Nature_ https://doi.org/10.1038/s41586-024-07118-4 (2024). Article PubMed PubMed Central Google Scholar * Hubbell, S. P. Neutral Theory and the Theory of Island
Biogeography. in _The Theory of Island Biogeography Revisited_ (ed. Losos, J. B. and Ricklefs, R.) 264–292. https://doi.org/10.1515/9781400831920.264 (Princeton University Press, 2009). *
Vellend, M. Conceptual synthesis in community ecology. _Q. Rev. Biol._ 85, 183–206 (2010). Article PubMed Google Scholar * Purves, D. W., Lichstein, J. W., Strigul, N. & Pacala, S. W.
Predicting and understanding forest dynamics using a simple tractable model. _Proc. Natl. Acad. Sci. USA_ 105, 17018–17022 (2008). Article PubMed PubMed Central CAS Google Scholar *
McGill, B. J. et al. Species abundance distributions: Moving beyond single prediction theories to integration within an ecological framework. _Ecol. Lett._ 10, 995–1015 (2007). Article
PubMed Google Scholar * Farrior, C. E., Bohlman, S. A., Hubbell, S. & Pacala, S. W. Dominance of the suppressed: Power-law size structure in tropical forests. _Sci. (80-.)_ 351,
155–157 (2016). Article CAS Google Scholar Download references ACKNOWLEDGEMENTS M.D. was supported by the Carbon Mitigation Initiative at Princeton University and NSF grant 2017804.
AUTHOR INFORMATION AUTHORS AND AFFILIATIONS * Department of Ecology and Evolutionary Biology, Princeton University, Princeton, NJ, USA Matteo Detto & Stephen Pacala Authors * Matteo
Detto View author publications You can also search for this author inPubMed Google Scholar * Stephen Pacala View author publications You can also search for this author inPubMed Google
Scholar CONTRIBUTIONS M.D. conceived the idea the study and wrote the manuscript. S.P. contributes substantially to develop the theory and to manuscript revision. CORRESPONDING AUTHOR
Correspondence to Matteo Detto. ETHICS DECLARATIONS COMPETING INTERESTS The authors declare no competing interests. PEER REVIEW PEER REVIEW INFORMATION _Communications Biology_ thanks the
anonymous reviewers for their contribution to the peer review of this work. Primary Handling Editors: Quan-Xing Liu and Laura Rodríguez Pérez. A peer review file is available. ADDITIONAL
INFORMATION PUBLISHER’S NOTE Springer Nature remains neutral with regard to jurisdictional claims in published maps and institutional affiliations. SUPPLEMENTARY INFORMATION SUPPLEMENTARY
INFORMATION REPORTING SUMMARY TRANSPARENT PEER REVIEW FILE RIGHTS AND PERMISSIONS OPEN ACCESS This article is licensed under a Creative Commons Attribution-NonCommercial-NoDerivatives 4.0
International License, which permits any non-commercial use, sharing, distribution and reproduction in any medium or format, as long as you give appropriate credit to the original author(s)
and the source, provide a link to the Creative Commons licence, and indicate if you modified the licensed material. You do not have permission under this licence to share adapted material
derived from this article or parts of it. The images or other third party material in this article are included in the article’s Creative Commons licence, unless indicated otherwise in a
credit line to the material. If material is not included in the article’s Creative Commons licence and your intended use is not permitted by statutory regulation or exceeds the permitted
use, you will need to obtain permission directly from the copyright holder. To view a copy of this licence, visit http://creativecommons.org/licenses/by-nc-nd/4.0/. Reprints and permissions
ABOUT THIS ARTICLE CITE THIS ARTICLE Detto, M., Pacala, S. Integrating conspecifics negative density dependence, successional and evolutionary dynamics: Towards a theory of forest diversity.
_Commun Biol_ 7, 1572 (2024). https://doi.org/10.1038/s42003-024-07156-8 Download citation * Received: 03 June 2024 * Accepted: 28 October 2024 * Published: 26 November 2024 * DOI:
https://doi.org/10.1038/s42003-024-07156-8 SHARE THIS ARTICLE Anyone you share the following link with will be able to read this content: Get shareable link Sorry, a shareable link is not
currently available for this article. Copy to clipboard Provided by the Springer Nature SharedIt content-sharing initiative