- Select a language for the TTS:
- UK English Female
- UK English Male
- US English Female
- US English Male
- Australian Female
- Australian Male
- Language selected: (auto detect) - EN
Play all audios:
ABSTRACT Understanding gene expression in different cell types within their spatial context is a key goal in genomics research. SPADE (SPAtial DEconvolution), our proposed method, addresses
this by integrating spatial patterns into the analysis of cell type composition. This approach uses a combination of single-cell RNA sequencing, spatial transcriptomics, and histological
data to accurately estimate the proportions of cell types in various locations. Our analyses of synthetic data have demonstrated SPADE’s capability to discern cell type-specific spatial
patterns effectively. When applied to real-life datasets, SPADE provides insights into cellular dynamics and the composition of tumor tissues. This enhances our comprehension of complex
biological systems and aids in exploring cellular diversity. SPADE represents a significant advancement in deciphering spatial gene expression patterns, offering a powerful tool for the
detailed investigation of cell types in spatial transcriptomics. SIMILAR CONTENT BEING VIEWED BY OTHERS ADVANCES IN MIXED CELL DECONVOLUTION ENABLE QUANTIFICATION OF CELL TYPES IN SPATIAL
TRANSCRIPTOMIC DATA Article Open access 19 January 2022 ESTIMATION OF CELL LINEAGES IN TUMORS FROM SPATIAL TRANSCRIPTOMICS DATA Article Open access 02 February 2023 ROBUST DECOMPOSITION OF
CELL TYPE MIXTURES IN SPATIAL TRANSCRIPTOMICS Article 18 February 2021 INTRODUCTION Spatial transcriptomics is a cutting-edge technology that has fundamentally transformed the field of
transcriptomics by enabling studies of gene expression with unprecedented resolution and specificity1. The ability to identify the precise location of gene expression within a tissue
represents a game-changing development, as it provides fresh avenues for investigating the complex interplay between gene expression and tissue architecture. By profiling the transcriptome
at a high resolution in a spatial context, researchers can gain insights into the cellular heterogeneity that underlies normal tissue function or disease states2, with significant
implications for addressing a broad range of biological and medical questions. For example, spatial transcriptomics has demonstrated great promise in elucidating the cellular basis of brain
function3, and in enabling precision treatments for heart disease4 or cancer5. Moreover, spatial transcriptomics has shown immense potential for studying the immune system6. Profiling the
transcriptome of immune cells in various tissues has yielded insights into how the immune system responds to infection and disease7. This approach could play a crucial role in shaping the
future of immunotherapies for cancer and other diseases, with spatial precision that is critical for effective treatment with minimal non-specific side effects8. Current spatial
transcriptomics technologies face limitations in yielding cell type-specific information within a tissue region, thereby prohibiting the complete capture of gene expression patterns at
single-cell resolution in space9. For instance, imaging-based spatial transcriptomics protocols provide detailed information at a single cell or subcellular level, but they are unable to
measure a large number of genes, making them less suitable for exploratory investigations at the transcriptome level10. On the other hand, sequencing-based approaches allow for the
measurement of gene expression for each spatial location across the entire transcriptome, but this comes at the cost of single-cell resolution11. As the compositions of cell types vary
between different tissue locations, the data obtained from sequencing may be inconsistent for subsequent analyses. Specifically, when identifying differentially expressed genes across
multiple spatial locations, the observed gene expression variations may not solely be influenced by spatial location, but also by differences in the categories or proportions of cell
types12. Hence, there is a growing need for methodologies that accurately depict and describe the spatial patterns of gene expression variations while accounting for the specificity of
individual cell types. Single-cell RNA sequencing (scRNA-seq) has significantly advanced our understanding of cell heterogeneity and gene expression patterns at an individual cell level13.
While scRNA-seq reveals intricate details of cellular functions, its limitation lies in not capturing the spatial context of cells within tissues9. Addressing this gap, computational
deconvolution techniques have emerged, focusing particularly on integrating spatial transcriptomics with single-cell data. This integration is vital for understanding tissue architecture and
the spatial distribution of cell types. Several spatially resolved cell type deconvolution techniques have been developed, including SPOTlight14, spatialDWLS15, RCTD16, SpatialDecon17, and
CARD12. SPOTlight utilizes non-negative matrix factorization and non-negative least squares for cell type proportion calculation but neglects location correlations. RCTD leverages
single-cell RNA-Seq data for cell type composition deconvolution while accounting for sequencing technology differences, but it does not model spatial patterns. SpatialDWLS extends DWLS18,
employing a modified weighted least square for cell type composition estimation and uniquely using an enrichment test for cell type determination, but its enrichment score selection is
arbitrary and spatial patterns are not considered. SpatialDecon surpasses traditional least-squares methods through log-normal regression and background modeling but overlooks location
relationships. CARD incorporates conditional autoregressive modeling for spatial correlation structure consideration but disregards varying cell type identities in spatial patterns. Notably,
none of these methods utilize valuable histological information. Overlooking spatial structures can lead to misleading conclusions, as they significantly impact biological functions. To
meet the challenge of cell type deconvolution in spatially resolved transcriptomics data, we have developed SPADE, a deconvolution tool that integrates cell type information derived from
scRNA-seq data obtained from corresponding samples to accurately estimate the proportions of diverse cell types. Recognizing the unique characteristics of spatial transcriptomics data, such
as the association of particular cell types with specific locations, the correlation between spatial positions and cell types, and the similarity between adjacent locations, we incorporated
a cutting-edge spatial domain detection algorithm19 that capitalizes on gene expression patterns, spatial coordinates, and histological data. To accommodate variations in cell type
composition across distinct locations, we implemented an adaptive cell type selection step that efficiently determines the presence of specific cell types within each spot. Our findings
substantiate the effectiveness of SPADE through rigorous simulations, wherein we benchmarked it against the existing spatial deconvolution methodologies. Furthermore, we applied SPADE to
publicly available spatial transcriptomics studies across various areas, underscoring its utility in deciphering cell type-specific gene expression profiles. The proposed approach
constitutes a significant advancement in the field of spatial transcriptomics, facilitating comprehensive and precise analyses of complex, heterogeneous tissue samples. RESULTS OVERVIEW OF
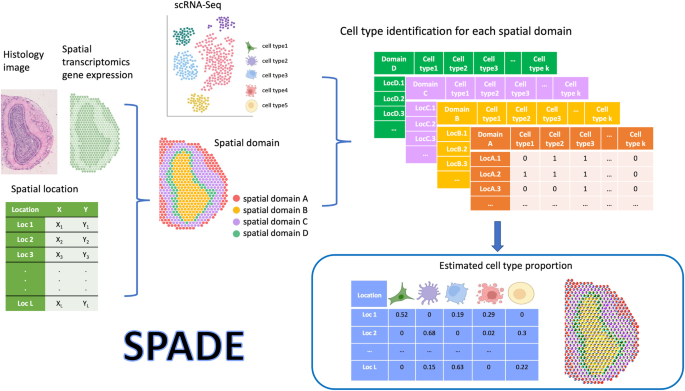
SPADE SPADE methodology involves a three-step approach to estimate the cell type proportions within a spatial domain, as depicted in Fig. 1 and Supplementary Fig. 1. In the first step, SPADE
identifies the spatial domains within a tissue by employing spaGCN19, a graph convolutional network specifically designed for spatial transcriptomics data. This integration of gene
expression, spatial location, and histology data enables SPADE to identify the spatial domains that spatially coherent in both gene expression and histology. In the second phase, a cell type
reference dataset is built from scRNA-seq to guide cell type identification within each domain, employing a Lasso regression algorithm20. This algorithm capitalizes on spatial gene
expression data and cell type information to determine the optimal number of cell types present within each domain, which is subsequently employed for deconvolution analysis in the ensuing
step. Concurrently, scRNA-seq data is adopted to create cell type-specific gene expression profiles, which guide the deconvolution process. In the final step, SPADE calculates the
proportions of cell types within each spatial domain by utilizing cell type-specific features. These features consist of genes that are differentially expressed to each cell type. The SPADE
analysis output provides the calculated cell type proportions for every spatial location for a given tissue region, which is an essential metric for investigating complex biological systems.
SIMULATION STUDIES To simulate synthetic spatial gene expression data, we implemented a simulation approach similar to the CARD methodology12, leveraging single-cell RNA-seq data. The
synthetic data generation involved three steps: (1) generating random proportions for each spatial location within domains using a Dirichlet distribution and this proportion will be used as
ground truth, (2) selecting cells from single-cell RNA-seq data within each cell type and summing these counts to produce cell type specific gene expression data, and (3) aggregating gene
expression across all cell types within each location and constructing a gene by location matrix as the pseudo-spatial transcriptomic data. More details can be found in Supplementary Fig. 2.
This approach produced synthetic spatial gene expression data similar to real-world data. We conducted two separate simulation experiments that were generated on different mouse tissues. We
also compared the method SPADE with existing spatial deconvolution methods, including CARD, SPOTlight, RCTD, spatialDWLS, and SpatialDecon. The first simulation involves using mouse
olfactory bulb (MOB) data. In this simulation study, we utilized three publicly available datasets to generate spatial transcriptomic data, including a single-cell RNA-seq dataset consisting
of 10 cell types of the mouse olfactory bulb21, a spatial gene expression dataset for the same area, and corresponding hematoxylin and eosin stain (H&E) image data (Fig. 2a)22. We
employed SpaGCN and detected four distinct spatial domains (Fig. 2b), assigning a dominant cell type to each domain, along with varying numbers of minor cell types. To assess the accuracy of
cell type detection, we created a bar plot displaying the true positive and false positive rates for each domain (Fig. 2c). This visualization highlights SPADE’s capability to achieve the
highest true positive rates and lowest false positive rates across all domains. The scatter plot (Fig. 2d) comparing the estimated and true proportions demonstrates that the SPADE estimation
closely aligns with the ground truth, achieving results comparable to those of CARD. To represent the inferred cell type proportions for each spatial location, we employed a spatial scatter
pie plot (Fig. 2e), in which SPADE generated an overall pattern that closely mirrored the true patterns and outperformed competing methods. Finally, to account for the stochastic nature of
data generation, we evaluated SPADE and other methods by repeating the simulation ten times with varying proportions. The results are shown in a boxplot (Fig. 2f) in terms of mean absolute
deviation (mAD), root mean squared error (RMSE), and correlation (R). Our results demonstrated that SPADE consistently outperformed other methods, achieving the lowest mAD and RMSE and the
highest correlation across all simulations, followed by CARD. To further investigate the performance of SPADE, we calculated the mAD and RMSE for each cell type, with the stacked bar plot
signifying the least deviation in proportions inferred by SPADE (Supplementary Fig. 3a). Owing to the effective cell type selection of SPADE, its mean absolute deviation (Supplementary Fig.
3b) and correlation (Supplementary Fig. 3c) displayed superior outcomes across all cell types and domains in comparison to alternative methodologies. To visualize the estimation of dominant
cell types, we employed a half violin plot (Supplementary Fig. 3d). This plot indicates that the distribution of dominant cell type proportions estimated by SPADE is more closely aligned
with the true proportions than those obtained from other methods. We have also considered adding different levels of noise when generating the synthetic data, and compared the performance of
SPADE with other methods on noisy data. From Supplementary Fig. 4, the results indicate that SPADE not only performs well under noisy conditions but also maintains its superior performance
among all the compared methods. In the second simulation study, we generated additional synthetic data from mouse kidney single-cell RNA-seq data23 and obtained the mouse kidney spatial
location and histology information from 10X Genomics to assess the robustness of our algorithm further. Specifically, we applied spaGCN and identified three spatial domains. SPADE was
utilized to accurately retrieve the spatial pattern (Fig. 3a, b) compared to other methods (Supplementary Fig. 5) by assigning the most precise proportions to the dominant cell type within
each spatial domain, as evidenced by Fig. 3c. To evaluate the accuracy of SPADE within each cell type across all locations, we compared the mAD and RMSE between true and inferred proportions
to those obtained with other methods. Our analysis revealed that SPADE had the lowest error rate (Fig. 3d). Additionally, we created a scatter plot to compare the estimated cell-type
proportions against the true proportions and found that SPADE displayed a close alignment to the 45-degree line (Fig. 3e). Furthermore, we assessed the ability of SPADE to accurately
identify the correct cell types within each domain. Our analysis indicated the superior ability of SPADE to detect the correct cell types in spatial locations, as evidenced by the high true
positive rate and low false positive rate (Fig. 3f). Finally, we assessed the stability of SPADE’s estimation by repeating the simulation ten times. The consistently low deviations, as well
as high correlation (Fig. 3g), demonstrated that SPADE is a robust and accurate method for spatial deconvolution, superior to existing methods. To evaluate the ability of SPADE in handling
noise data, we introduced varying levels of noise during the creation of synthetic data and compared its performance with other methods. The results, as shown in Supplementary Fig. 6, reveal
that SPADE not only copes well with noisy conditions but also continues to maintain low deviance and high correlation among all compared methods. APPLICATION OF REAL DATA ON DEVELOPMENTAL
CHICKEN HEART The heart is the first organ to develop during embryogenesis, and interactions among various cell populations play a pivotal role in driving cardiac fate decision. The
heterogeneity of cell types in heart development poses a challenge to study by traditional methods. Therefore, it is important to explore varied techniques for prediction of cell type
heterogeneity during heart development. During early embryonic development, the heart initially forms as a simple tube and undergoes a series of intricate morphological changes, eventually
developing into a fully functional four-chambered heart complete with the blood vessels. In their previous research, Mantri, M. et al. employed a combination of spatially resolved RNA
sequencing and high-throughput single-cell RNA sequencing to investigate the spatial and temporal interactions as well as the regulatory mechanisms involved in the development of the
embryonic chicken heart24. Their research employed chicken embryos to generate over 22,000 single-cell transcriptomes across four pivotal developmental stages, in addition to spatially
resolved RNA-seq on 12 heart tissue sections at the same stages, encompassing approximately 700 to nearly 2,000 tissue locations. These stages comprised day 4, an early stage of chamber
formation and the initiation of ventricular septation; day 7, when the four-chamber cardiac morphology is initiated; day 10, representing the mid-stage of four-chambered heart development;
and day 14, denoting the late stage of four-chamber development. The study of early embryonic development details the progression of anatomical development across multiple temporal points by
way of H&E stained images, as presented in the Supplementary Fig. 7a. Upon applying SPADE, spatial domains were defined for each timepoint, revealing the emergence of ventricular
separation by day 4, as illustrated in Fig. 4a. From day 7 onwards, the clustering of diverse chambers was readily discernible, as evidenced by Fig. 4b, c, and d. The estimated cell type
proportions for each chamber over the four temporal points are illustrated in the bar plot in Fig. 4e, which indicates a preponderance of immature myocardial and fibroblast cells on day 4,
with a decreasing trend as the heart matures. This pattern is further verified by the scatter pie plot, as presented in the Supplementary Fig. 7b. This phenomenon is attributed to the
tube-like structure of the chicken heart during early developmental stages, which necessitates the presence and active participation of fibroblast cells in the creation of connective
tissue25. As the heart develops, fibroblast cells undergo proliferation and differentiation into various types of connective tissue cells. During later stages of development, the number of
fibroblast cells in the heart declines, coinciding with its maturation and specialization. However, fibroblast cells continue to play a vital role in maintaining the heart’s structure and
function throughout the chicken’s lifespan26,27,28,29. Conversely, the number of cardiomyocyte cells increases significantly during the development of the chicken heart, with the highest
rate of proliferation occurring from day 4 to day 7, and slowing down from day 10 to day 14, as shown in Fig. 4e. The proliferation of cardiomyocytes is a pivotal process during embryonic
heart development, leading to a significant increase in their numbers. Previous studies have demonstrated that the rate of cardiomyocyte proliferation is highest during early developmental
stages and gradually decreases as the heart matures28,30,31,32,33. Our findings, obtained through the application of SPADE, support this notion. Specifically, we observed that immature
myocardial cells constitute a subset of cardiomyocytes that are present only during days 4 to 7 of embryonic development (Fig. 4e). These immature cells undergo differentiation to become
mature cardiomyocytes, which is a crucial step for the proper contractile function of the heart24. We aimed to investigate the trends in proportions of various cell types, including
cardiomyocytes, vascular endothelial cells, fibroblasts, and endocardial cells. To determine whether the observed changes in proportions were statistically significant, we conducted a
thorough analysis, comparing every pair of time points for each cell type using Fig. 4f. Our results indicate that nearly all changes between any two days were statistically significant
(from Wilcoxon test with _p_ < 0.05). Furthermore, we employed a spatial cell type map (Fig. 4g, h) to visually represent the proportions of each cell type at Day 4 and Day 14. Results
for Day 7 and Day 10 can be found in Supplementary Fig. 8a. As expected, at Day 4, both cardiomyocytes and vascular endothelial cells exhibited relatively low proportions in Fig. 4g, while
at Day 14 (Fig. 4h), their proportions increased significantly. These findings highlight the dynamic changes in cell type proportions over time, providing crucial insights into the
development and function of the studied tissues. The heart, a vital organ composed of various cell types, including cardiomyocytes, fibroblasts, endothelial cells, and smooth muscle cells,
undergoes intricate cellular interactions and network formation during its developmental stages that are crucial for its proper functioning34,35,36,37. We utilized cellular colocalization
analysis, a key technique in spatial transcriptomics, to quantitatively evaluate how different cell types are positioned and interact within tissue. This approach provides insights into the
spatial dynamics of cellular environments, revealing potential interactions and functional relationships between cells. By analyzing the spatial organization and proximity of cell types, we
aim to understand their roles in tissue function and development, and how they contribute to the overall tissue architecture and intercellular communication35,36. Our results revealed an
increased cohesion between cell types, particularly between cardiomyocytes and vascular endothelial cells, in conjunction with heart development. This was supported by our results, as
illustrated in Fig. 4i, j for Day 4 and Day 14, respectively, which showed stronger spatial coherence of organization during development. The correlation plots for Day 7 and Day 10 are in
the Supplementary Fig. 8b. Collectively, our study highlights the significant variability in the spatial organization of cell types across different developmental stages and underscores the
significance of dynamic interactions among various cell types for a comprehensive understanding of heart development as compared to the results from other methods (indicated in Supplementary
Figs. 9–13). APPLICATION OF REAL DATA ON HUMAN BREAST CANCER Breast cancer is a complex disease that arises from the uncontrolled growth of malignant cells in the breast tissue, with
varying molecular and cellular characteristics among individual patients. The Luminal subtype, which constitutes approximately 70% of all cases, is characterized by the expression of hormone
receptors, namely estrogen receptor (ER) and progesterone receptor (PR)38. The combination of spatial transcriptomics and single-cell data is proving to be a valuable method for unraveling
the complexities of human breast cancer38. This method maps gene expression and analyzes single-cell transcriptomes to identify cell types and their interactions in the tumor environment,
crucial for understanding cancer progression and treatment effectiveness. We retrieved the single-cell RNA-seq data as well as the spatial transcriptomics data of primary pre-treatment
breast tumor samples from a human breast cancer study39. To create a reference for cell types in SPADE analysis, we utilized scRNA-Seq data comprising 9 distinct cell types from breast
tumors. This reference was then employed to deconstruct a spatially mapped tumor sample. In the SPADE results (Fig. 5a), a preponderance of cancer epithelial cells is evident, with
plasmablasts as the subsequent most abundant cell type. A comprehensive examination of cellular composition across various spatial locations, depicted in Supplementary Fig. 14, further
corroborates the prevalence of cancer epithelial cells at the majority of these sites. In Luminal breast cancer, the development of malignancy typically stems from epithelial cells, which
may undergo genetic mutations leading to uncontrolled growth and tumor formation. These malignant epithelial cells often express high levels of hormone receptors, which facilitate response
to the growth-promoting effects of estrogen and progesterone40,41. Plasmablasts are a type of immune cell that plays a crucial role in humoral immune response, responsible for antibody
production and secretion. Recent evidence has shown that Luminal breast tumors with higher levels of infiltrating plasmablasts have a better prognosis compared to the tumors with lower
levels of plasmablasts, suggesting a potential protective role of these cells in Luminal breast cancer42,43. We observed the colocalization of cancer epithelial cells and immune cells, such
as plasmablasts, myeloid cells, and T/B cells, in the tumor microenvironment (Fig. 5b). We noted strong negative correlations between cancer epithelial cells and immune cells in these areas.
The presence of tumor-infiltrating lymphocytes (TILs) is an important aspect of cancer epithelial cell and immune cell colocalization. TILs are immune cells that migrate into the tumor
microenvironment and are believed to play a crucial role in anti-tumor immunity42. In several cancer types, including breast cancer, the presence of TILs has been linked to improved
outcomes43,44,45.Furthermore, We investigated the cell type proportion within each location for cancer epithelial cells, cancer-associated fibroblast cells (CAFs), and B cell (Fig. 5c),
along with their associated marker genes EPCAM (Epithelial), FAP(CAFs) and CD55 (B cell) (Fig. 5d). The spatial distribution of cell types corresponded with their marker gene expression,
confirming the cell types inferred by SPADE. The results displayed a similar pattern to those of CARD and RCTD, as shown in Supplementary Fig. 15. APPLICATION OF REAL DATA ON MOUSE VISUAL
CORTEX The mouse brain, with its millions of neurons, is an ideal model for studying mammalian brain structure and function, especially in the visual cortex. This region, crucial for
processing visual information, is organized into layers, each with specialized cell types, making it a good model for human visual cognition research46,47,48,49. The visual cortex hosts
various neuron types, including excitatory neurons using glutamate and inhibitory neurons using GABA, forming a network for interpreting visual stimuli50,51. Each neuron type plays a
specific role in visual processing, from detecting visual features to integrating complex visual information52,53,54. Understanding these functions and their disruptions can provide insights
into neurological and psychiatric disorders55 We implemented a single-cell analysis56 to identify 30 distinct cell types in the mouse visual cortex. This analysis was used to deconstruct
the adult mouse brain, which had undergone spatial processing (see Fig. 6a). Initially, we divided the mouse brain into 19 different regions (illustrated in Fig. 6b). In these regions, we
were able to identify specific layers that correlate with various brain functions. Compared to the other methods (results are in Supplementary Fig. 16), SPADE successfully decomposed each
brain region into its constituent cell types. The predominant cell type in each location is shown in Fig. 6c. Our focus was particularly on the visual cortex, where we found that most areas
were primarily composed of excitatory neurons, followed by inhibitory neurons and oligodendrocytes, as detailed in Fig. 6d. Excitatory neurons, which utilize the neurotransmitter glutamate
to typically enhance neuronal activity, are an integral part of the mouse visual cortex, as well as all mammalian brains. These neurons have a central role in transmitting and processing
visual data. They are found in all layers of the mouse visual cortex from the deeper layers (layers 5 and 6) to the superficial layers (layers 2 and 3) (Fig. 6e). The genes expressed
differently (Fig. 6f) for each subtypes of excitatory neuron further confirmed the corresponding multiple-layer structures. DISCUSSION Spatial transcriptomics, essential for studying gene
expression and tissue diversity, is more informative when combined with cell type deconvolution. This computational method identifies cell types from gene expression data, enhancing our
understanding of biological processes at the cellular level within tissues. Spatial transcriptomics is a critical tool for investigating gene expression patterns and regional differences in
a tissue, providing insight into its biological significance. However, the interpretation of this data can be challenging without knowledge of the specific cell types present in each region.
Cell type deconvolution is a computational approach that can identify cell types based on gene expression data. By applying this technique to spatial transcriptomics data, it becomes
possible to contextualize gene expression data and gain a deeper understanding of the biological processes occurring within a tissue at the cellular level. While many existing cell type
deconvolution methods do not account for the spatial domain structure, SPADE has been developed to overcome this limitation. Our method stands out by integrating spatial structures and using
a reliable approach for cell type selection. Differing from other techniques, it employs lasso regression and adaptive thresholding for more accurate and flexible cell type identification.
This effectiveness is evident in our results, notably in Fig. 2c, enhancing SPADE’s robustness and precision in complex spatial transcriptomics datasets. The SPADE algorithm effectively
predicts cell types and their distribution in tissues, as shown in tests on synthetic mouse datasets. Applied to chicken heart development, human breast cancer, and mouse visual cortex,
SPADE revealed insights into cell type development and spatial patterns in diseases. This has promising implications for clinical studies, especially in understanding cancer cell type
heterogeneity and informing treatment strategies. Although the SPADE algorithm has demonstrated superior accuracy, one of its notable challenges is the accurate deconvolution of rare cell
types. Our analysis, especially with rare cell types like the Immature cells in the mouse olfactory bulb data, indicated a tendency for underestimation, a limitation common to current
deconvolution methods. This underestimation issue is critical to address in order to improve SPADE’s robustness and applicability, particularly in complex biological tissues where rare cell
types are are crucial for functional significance or disease state. Moreover, it’s important to note that SPADE’s performance can be further improved by incorporating better-designed
reference datasets. In our study, we utilized one single scRNA-seq dataset to construct the reference, potentially limiting the algorithm’s overall efficacy. Advances in scRNA-seq
technologies have led to the generation of multiple reference datasets from different platforms or samples obtained from the same tissues. Integration of these diverse scRNA-seq datasets
holds the potential to provide a comprehensive and accurate reference set, thereby improving the performance of the SPADE algorithm. It should also be mentioned that SPADE, while not the
most efficient in processing time and memory usage, involves a meticulous process of identifying cell types within each domain before estimating proportions. This methodological aspect,
though extending processing time, substantially enhances the accuracy and robustness of our analyses, particularly for complex datasets. This balance between processing efficiency and
analytical precision is a key consideration, making SPADE a valuable tool for in-depth spatial gene expression studies. Continuous methodological improvements are necessary. Future studies
should explore the use of multiple reference datasets to improve the accuracy and efficacy of SPADE in predicting cell types and their spatial distribution across different tissues. METHODS
SPATIAL DOMAIN DETECTION Spatial domain detection constitutes a critical aspect of spatial transcriptomics, as evidenced by numerous studies19,57,58. A spatial domain encompasses regions
that demonstrate spatial coherence in both gene expression and histology. Traditional approaches for identifying these domains are dependent on clustering algorithms that solely consider
gene expression, neglecting spatial information and histology19. To address this limitation, spaGCN19 incorporates gene expression, spatial location, and histology to construct a graph
convolutional network, facilitating the identification of spatial domains. The spaGCN algorithm unfolds in three stages. Initially, information derived from physical location and histology
is employed to establish an undirected graph, reflecting the relationships between all spots. Subsequently, a graph convolutional network is implemented to integrate gene expression, spatial
location and histological data. Finally, an iterative unsupervised clustering algorithm is applied to segregate spots into distinct spatial domains based on gene expression and histology
coherence. Importantly, spaGCN can be applied to the datasets where histology images are absent. In these situations, it makes use of spatial gene expression data to identify the spatial
domains which is comparable to methods used in other spatial domain detection approaches. For a comprehensive understanding, refer to the original publication19. DETERMINE THE NUMBER OF CELL
TYPES FOR EACH DOMAIN A crucial disparity between bulk deconvolution and spatial deconvolution is that not all cell types are uniformly distributed across all regions. Consequently,
identifying the presence of specific cell types in individual locations is crucial for efficacious cell type deconvolution. A key assumption underlying this approach is that while different
locations within the same domain are closely related, they may not have exactly the same cell types. Instead, each location is thought to contain a similar set of cell types, but the
proportions of these cell types can vary from one location to another. To tackle this issue, we leverage a Lasso-regularized generalized linear model20, which offers the advantages of
concurrent feature selection and regularization, enforcement of sparsity, computational efficiency, resistance to multicollinearity, and broad applicability across diverse domains. Employing
Lasso, cell types are selected for each domain through the subsequent methodology: $$\mathop{\sum }\limits_{i=1}^{M}{\left({y}_{i}-\mathop{\sum }\limits_{j = 1}^{K}{\beta
}_{j}{x}_{ij}\right)}^{2}+\lambda \mathop{\sum }\limits_{j=1}^{K}\left\vert {\beta }_{j}\right\vert$$ (1) where _y__i_ is the gene expression for gene _i_, _x__i__j_ is the gene _i_
expression for cell type _j_, _β__j_ is the coefficient for cell type _j_. To perform cell type selection, we estimate cell type coefficients, effectively eliminating a cell type from a
given location if its coefficient shrinks to 0. The tuning parameter, _λ_, is chosen via 10-fold cross-validation. Upon obtaining the cell-type-associated coefficient matrix for each
location within the spatial domains, we transform it into a binary matrix, where each entry holds a value of either 1 or 0. To achieve this, we employ an adaptive thresholding technique59
that utilizes a 2D convolution with the Fast Fourier Transform (FFT) to filter the coefficient matrix, thus enabling the efficient identification of entries surpassing a specific threshold.
In particular, if a coefficient exceeds the filtered value, the corresponding entry is set to 1, whereas entries falling below the threshold are assigned a value of 0. A comprehensive
description of these steps can be found in Supplementary Fig. 17. CELL TYPE PROPORTION ESTIMATION FOR EACH LOCATION WITHIN EACH DOMAIN The deconvolution problem can be solved to find the
optimal estimation for cell type proportion that minimize the difference between estimated spatial gene expression and observed spatial gene expression for each location as below:
$$\mathop{{{{{{\rm{argmin}}}}}}}\limits_{P}\left\{\mathop{\sum }\limits_{i=1}^{M}\left| {y}_{i}-\mathop{\sum}\limits_{j\in {{{{{{{\rm{S}}}}}}}}}{p}_{j}{x}_{ij}\right| \right\}$$ (2) subject
to _p__j_ ≥ 0 and ∑_j_∈S_p__j_ = 1 where _y__i_ is the expression for gene _i_( = 1…_M_). _x__i__j_ is the expression for gene i for cell type _j_ that is extracted from single-cell
reference. _p__j_ is the proportion for cell type _j_. _S_ is the set of cell types determined for each domain. Here we select the absolute deviation loss as the optimal choice due to its
less sensitive to the extreme values than the commonly used quadratic loss function. The optimization problem is solved using the Augmented Lagrange Minimization algorithm that is
implemented by auglag function in R package alabama60. Due to the unique feature of proportion, we not only minimize the nonlinear objective function, but also satisfy two constrains. The
proportion for each cell type has to be nonnegative, and the sum of all cell type within each sample needs to be 1. CONSTRUCT REFERENCE The accurate estimation of cell types is essential for
understanding tissue function and identifying cell type specific features. A well-designed cell type reference is crucial for this purpose, and in this study, we utilize single-cell RNA-seq
data that contains tissue or samples with a similar phenotype to the spatial transcriptomics data. The scRNA-seq data were first checked for quality based on the commonly used
pre-processing workflow from Seurat61. To extract cell type information, we followed the main idea from MuSiC62 and applied several steps. Firstly, we calculated the cross-cell variation for
each gene of each cell type within an individual sample, taking into account cell type and sample-specific library size. To achieve this, we subset the expression data by removing redundant
cell type annotations given by the original single-cell study and by removing genes with zero counts. For each sample within each cell type, we scaled the gene expression by their library
size, which is calculated by summing all gene counts for each cell. Next, we filtered genes by three criteria to keep genes that satisfy any of these criteria: 1) the genes shared between
single-cell data and bulk data, 2) commonly used cell type biomarkers or highly cited markers, and 3) differentially expressed genes (DEGs) by comparing each pair of cell types. To detect
DEGs, we used the FindAllMarkers function from Seurat. The resulting table is a gene by cell type expression matrix that can be implemented in the cell type deconvolution model. For a more
in-depth step of reference construction, please refer to the flowchart depicted in the Supplementary Fig. 18 for more details. STATISTICS AND REPRODUCIBILITY All single-cell and spatial
transcriptomics data used for simulation and real datasets are publicly available. The codes for other methods are also publicly accessible; we adhered to the online tutorials for running
each method. For our method, we have developed an R package that enables the reproduction of our results. The R package and tutorial for implement SPADE is freely available on GitHub
(https://github.com/anlingUA/SPADE). REPORTING SUMMARY Further information on research design is available in the Nature Portfolio Reporting Summary linked to this article. DATA AVAILABILITY
The datasets utilized in this study are publicly available. The spatial MOB, mouse kidney, and mouse brain datasets were obtained from the 10x Visium dataset, which can be accessed at
https://www.10xgenomics.com/resources/datasets. The single cell RNA-seq data for the MOB and mouse kidney samples are available through the GEO Series accession numbers GSE162654 and
GSE107585, respectively. The spatial transcriptomics data for the developmental chicken heart were downloaded from https://github.com/madhavmantri/chicken_heart/tree/master/data, while the
corresponding single cell data can be accessed via the GEO Series accession number GSE149457. The human breast cancer spatial transcriptomic data is available from the Zenodo data repository
(https://doi.org/10.5281/zenodo.4739739), and the single cell data can be obtained via the GEO Series accession number GSE176078. Finally, the single cell data for the mouse visual cortex
can be accessed through GSE102827. REFERENCES * Moses, L. & Pachter, L. Museum of spatial transcriptomics. _Nat. Methods_ 19, 534–546 (2022). Article CAS PubMed Google Scholar *
Walker, B. L., Cang, Z., Ren, H., Bourgain-Chang, E. & Nie, Q. Deciphering tissue structure and function using spatial transcriptomics. _Commun. Biol._ 5, 220 (2022). Article PubMed
PubMed Central Google Scholar * Close, J. L., Long, B. R. & Zeng, H. Spatially resolved transcriptomics in neuroscience. _Nat. Methods_ 18, 23–25 (2021). Article CAS PubMed Google
Scholar * Roth, R., Kim, S., Kim, J. & Rhee, S. Single-cell and spatial transcriptomics approaches of cardiovascular development and disease. _BMB Rep._ 53, 393–399 (2020). Article CAS
PubMed PubMed Central Google Scholar * Yu, Q., Jiang, M. & Wu, L. Spatial transcriptomics technology in cancer research. _Front. Oncol._ 12, 1019111 (2022). Article CAS PubMed
PubMed Central Google Scholar * Hu, B., Sajid, M., Lv, R., Liu, L. & Sun, C. A review of spatial profiling technologies for characterizing the tumor microenvironment in
immuno-oncology. _Front. Immunol._ 13, 996721 (2022). Article CAS PubMed PubMed Central Google Scholar * Rao, A., Barkley, D., França, G. S. & Yanai, I. Exploring tissue
architecture using spatial transcriptomics. _Nature_ 596, 211–220 (2021). Article CAS PubMed PubMed Central Google Scholar * Williams, C. G., Lee, H. J., Asatsuma, T., Vento-Tormo, R.
& Haque, A. An introduction to spatial transcriptomics for biomedical research. _Genome Med._ 14, 68 (2022). Article CAS PubMed PubMed Central Google Scholar * Longo, S. K., Guo, M.
G., Ji, A. L. & Khavari, P. A. Integrating single-cell and spatial transcriptomics to elucidate intercellular tissue dynamics. _Nat. Rev. Genet._ 22, 627–644 (2021). Article CAS
PubMed PubMed Central Google Scholar * Kleino, I., Frolovaitė, P., Suomi, T. & Laura, L. E. Computational solutions for spatial transcriptomics. _Comput. Struc. Biotechnol. J._ 20,
4870–4884 (2022). Article CAS Google Scholar * Chen, J. et al. A comprehensive comparison on cell-type composition inference for spatial transcriptomics data. _Brief. Bioinform._ 23,
bbac245 (2022). Article PubMed PubMed Central Google Scholar * Ma, Y. & Zhou, X. Spatially informed cell-type deconvolution for spatial transcriptomics. _Nat. Biotechnol._ 40,
1349–1359 (2022). Article CAS PubMed Google Scholar * Lu, Y., Chen, Q. M. & An, L. Semi-reference based cell type deconvolution with application to human metastatic cancers. _NAR
Genom. Bioinformatics_ 5, 4 (2023). Google Scholar * Elosua-Bayes, M., Nieto, P., Mereu, E., Gut, I. & Heyn, H. Spotlight: seeded nmf regression to deconvolute spatial transcriptomics
spots with single-cell transcriptomes. _Nucleic Acids Res._ 49, e50–e50 (2021). Article CAS PubMed PubMed Central Google Scholar * Dong, R. & Yuan, G.-C. Spatialdwls: accurate
deconvolution of spatial transcriptomic data. _Genome Biol._ 22, 145 (2021). Article PubMed PubMed Central Google Scholar * Cable, D. M. et al. Robust decomposition of cell type mixtures
in spatial transcriptomics. _Nat. Biotechnol._ 40, 517–526 (2022). Article CAS PubMed Google Scholar * Danaher, P. et al. Advances in mixed cell deconvolution enable quantification of
cell types in spatial transcriptomic data. _Nat. Commun._ 13, 385 (2022). Article CAS PubMed PubMed Central Google Scholar * Tsoucas, D. et al. Accurate estimation of cell-type
composition from gene expression data. _Nat. Commun._ 10, 2975 (2019). Article PubMed PubMed Central Google Scholar * Hu, J. et al. Spagcn: Integrating gene expression, spatial location
and histology to identify spatial domains and spatially variable genes by graph convolutional network. _Nat. Methods_ 18, 1342–1351 (2021). Article PubMed Google Scholar * Tibshirani, R.
Regression shrinkage and selection via the lasso. _J. R. Stat. Soc. Ser. B Methodol._ 58, 267–288 (1996). Google Scholar * Tepe, B. et al. Single-cell rna-seq of mouse olfactory bulb
reveals cellular heterogeneity and activity-dependent molecular census of adult-born neurons. _Cell Rep._ 25, 2689–2703.e3 (2018). Article PubMed PubMed Central Google Scholar * 10x
Genomics. Adult mouse olfactory bulb: Spatial gene expression dataset by space ranger 2.0.0. https://support.10xgenomics.com (2022). * Park, J. et al. Single-cell transcriptomics of the
mouse kidney reveals potential cellular targets of kidney disease. _Science_ 360, 758–763 (2018). Article CAS PubMed PubMed Central Google Scholar * Mantri, M. et al. Spatiotemporal
single-cell rna sequencing of developing chicken hearts identifies interplay between cellular differentiation and morphogenesis. _Cell Rep._ 12, 1771 (2021). CAS Google Scholar * Wittig,
J. G. & Münsterberg, A. The chicken as a model organism to study heart development. _Cold Spring Harb. Perspect. Biol._ 12, a037218 (2020). Article CAS PubMed PubMed Central Google
Scholar * Choy, M., Oltjen, S., Ratcliff, D., Armstrong, M. & Armstrong, P. Fibroblast behavior in the embryonic chick heart. _Dev. Dyn. Off. Publ. Am. Assoc. Anat._ 198, 97–107 (1993).
CAS Google Scholar * Consigli, S. A. & Joseph-Silverstein, J. Immunolocalization of basic fibroblast growth factor during chicken cardiac development. _J. Cell. Physiol._ 146, 379–385
(1991). Article CAS PubMed Google Scholar * Tallquist, M. D. Developmental pathways of cardiac fibroblasts. _Cold Spring Harb. Perspect. Biol._ 12, a037184 (2020). Article CAS PubMed
PubMed Central Google Scholar * Ivey, M. J. & Tallquist, M. D. Defining the cardiac fibroblast. _Circ. J. Off. J. Jpn. Circ. Soc._ 80, 2269–2276 (2016). CAS Google Scholar * Guo,
Y. & Pu, W. T. Cardiomyocyte maturation. _Circ. Res._ 126, 1086–1106 (2020). Article CAS PubMed PubMed Central Google Scholar * Soufan, A. T. et al. Regionalized sequence of
myocardial cell growth and proliferation characterizes early chamber formation. _Circ. Res._ 99, 545–552 (2006). Article CAS PubMed Google Scholar * Evans-Anderson, H. J., Alfieri, C. M.
& Yutzey, K. E. Regulation of cardiomyocyte proliferation and myocardial growth during development by foxo transcription factors. _Circ. Res._ 102, 686–694 (2008). Article CAS PubMed
Google Scholar * Günthel, M., Barnett, P. & Christoffels, V. M. Development, proliferation, and growth of the mammalian heart. _Mol. Ther._ 26, 1599–1609 (2018). Article PubMed
PubMed Central Google Scholar * Litviňuková, M. et al. Cells of the adult human heart. _Nature_ 588, 466–472 (2020). Article PubMed PubMed Central Google Scholar * Ieda, M. Heart
development and regeneration via cellular interaction and reprogramming. _Keio J. Med._ 62, 99–106 (2013). Article CAS PubMed Google Scholar * Tirziu, D., Giordano, F. J. & Simons,
M. Cell communications in the heart. _Circulation_ 122, 928–937 (2010). Article PubMed PubMed Central Google Scholar * Wittig, J. G. & Münsterberg, A. The early stages of heart
development: Insights from chicken embryos. _J. Cardiovasc. Dev. Dis_. 3, 12 (2016). * Wu, S. Z. et al. A single-cell and spatially resolved atlas of human breast cancers. _Nat. Genet._ 53,
1334–1347 (2021). Article CAS PubMed PubMed Central Google Scholar * Wu, S. Z. et al. A single-cell and spatially resolved atlas of human breast cancers. [Data set]. Zenodo
https://zenodo.org/records/4739739 (2021). * Hinck, L. & Näthke, I. Changes in cell and tissue organization in cancer of the breast and colon. _Curr. Opin. Cell Biol._ 26, 87–95 (2013).
Article PubMed Google Scholar * Scabia, V. et al. Estrogen receptor positive breast cancers have patient specific hormone sensitivities and rely on progesterone receptor. _Nat. Commun._
13, 3127 (2022). Article CAS PubMed PubMed Central Google Scholar * Nelson, M., Ngamcherdtrakul, W., Luoh, S. & Yantasee, W. Prognostic and therapeutic role of tumor-infiltrating
lymphocyte subtypes in breast cancer. _Cancer Metastasis Rev._ 40, 519–536 (2021). Article CAS PubMed PubMed Central Google Scholar * Garaud, S. et al. Tumor-infiltrating b cells signal
functional humoral immune responses in breast cancer. _JCI Insight_ 4, e129641 (2019). Article PubMed Central Google Scholar * Paijens, S., Vledder, A., de Bruyn, M. & Nijman, H.
Tumor-infiltrating lymphocytes in the immunotherapy era. _Cell Mol. Immunol._ 18, 842–859 (2021). Article CAS PubMed Google Scholar * Li, F. et al. The association between CD8+
tumor-infiltrating lymphocytes and the clinical outcome of cancer immunotherapy: A systematic review and meta-analysis. _eClin. Med._ 41, 101134 (2021). * Meechan, D. et al. Modeling a
model: Mouse genetics, 22q11.2 deletion syndrome, and disorders of cortical circuit development. _Prog. Neurobiol._ 130, 1–28 (2015). Article CAS PubMed PubMed Central Google Scholar *
Pessoa, L. & Adolphs, R. Emotion processing and the amygdala: from a ‘low road’ to ‘many roads’ of evaluating biological significance. _Nat. Rev. Neurosci._ 11, 773–783 (2010). Article
CAS PubMed PubMed Central Google Scholar * Preuss, T. Taking the measure of diversity: comparative alternatives to the model-animal paradigm in cortical neuroscience. _Brain Behav.
Evol._ 55, 287–299 (2000). Article CAS PubMed Google Scholar * Espinosa, J. & Stryker, M. Development and plasticity of the primary visual cortex. _Neuron_ 75, 230–49 (2012). Article
CAS PubMed PubMed Central Google Scholar * Fee, C., Banasr, M. & Sibille, E. Somatostatin-positive gamma-aminobutyric acid interneuron deficits in depression: Cortical microcircuit
and therapeutic perspectives. _Biol. Psychiatry_ 82, 549–559 (2017). Article CAS PubMed PubMed Central Google Scholar * Yuste, R. & Katz, L. Control of postsynaptic ca2+ influx in
developing neocortex by excitatory and inhibitory neurotransmitters. _Neuron_ 6, 333–344 (1991). Article CAS PubMed Google Scholar * Lamme, V., Supèr, H., Landman, R., Roelfsema, P.
& Spekreijse, H. The role of primary visual cortex (v1) in visual awareness. _Vision Res._ 40, 1507–1521 (2000). Article CAS PubMed Google Scholar * Epstein, R. The cortical basis of
visual scene processing. _Visual Cogn._ 12, 954–978 (2005). Article Google Scholar * Pellicano, E., Gibson, L., Maybery, M., Durkin, K. & Badcock, D. Abnormal global processing along
the dorsal visual pathway in autism: a possible mechanism for weak visuospatial coherence? _Neuropsychologia_ 43, 1044–1053 (2005). Article PubMed Google Scholar * Siddiqi, S., Kording,
K., Parvizi, J. & Fox, M. Causal mapping of human brain function. _Nat. Rev. Neurosci._ 23, 361–375 (2022). Article CAS PubMed PubMed Central Google Scholar * Hrvatin, S. et al.
Single-cell analysis of experience-dependent transcriptomic states in the mouse visual cortex. _Nat Neurosci._ 21, 120–129 (2018). Article CAS PubMed Google Scholar * Li, Z. & Zhou,
X. Bass: multi-scale and multi-sample analysis enables accurate cell type clustering and spatial domain detection in spatial transcriptomic studies. _Genome Biol._ 23, 168 (2022). Article
CAS PubMed PubMed Central Google Scholar * Dong, K. & Zhang, S. Deciphering spatial domains from spatially resolved transcriptomics with an adaptive graph attention auto-encoder.
_Nat. Commun._ 13, 1739 (2022). Article CAS PubMed PubMed Central Google Scholar * Pau, G., Fuchs, F., Sklyar, O., Boutros, M. & Huber, W. Ebimage–an r package for image processing
with applications to cellular phenotypes. _Bioinformatics_ 26, 979–981 (2010). Article CAS PubMed PubMed Central Google Scholar * Varadhan, R. alabama: Constrained nonlinear
optimization https://CRAN.R-project.org/package=alabama (2022). R package version 2022.4-1. * Satija, R., Farrell, J. A., Gennert, D., Schier, A. F. & Regev, A. Spatial reconstruction of
single-cell gene expression data. _Nat. Biotechnol._ 33, 495–502 (2015). Article CAS PubMed PubMed Central Google Scholar * Wang, X., Park, J., Susztak, K., Zhang, N. R. & Li, M.
Bulk tissue cell type deconvolution with multi-subject single-cell expression reference. _Nat. Commun._ 10, 380 (2019). Article CAS PubMed PubMed Central Google Scholar Download
references ACKNOWLEDGEMENTS This research was partially supported by the National Institute of Health R01 GM125212, R01 GM126165, and Holsclaw endowment (Q.M.C.); R01 GM139829, P01
AI148104-01A1, and United States Department of Agriculture (ARZT-1361620-H22-149) (L.A.). AUTHOR INFORMATION AUTHORS AND AFFILIATIONS * Interdisciplinary Program in Statistics and Data
Science, University of Arizona, Tucson, AZ, 85721, USA Yingying Lu & Lingling An * College of Pharmacy, University of Arizona, Tucson, AZ, 85721, USA Qin M. Chen * Department of
Biosystems Engineering, University of Arizona, Tucson, AZ, 85721, USA Lingling An * Department of Epidemiology and Biostatistics, University of Arizona, Tucson, AZ, 85721, USA Lingling An
Authors * Yingying Lu View author publications You can also search for this author inPubMed Google Scholar * Qin M. Chen View author publications You can also search for this author inPubMed
Google Scholar * Lingling An View author publications You can also search for this author inPubMed Google Scholar CONTRIBUTIONS Conceptualization, L.A. and Y.L.; methodology, Y.L. and L.A.;
simulation studies, Y.L. and L.A.; real data analysis, Y.L., Q.M.C., and L.A.; writing and revising the manuscript, Y.L., Q.M.C. and L.A. CORRESPONDING AUTHOR Correspondence to Lingling An.
ETHICS DECLARATIONS COMPETING INTERESTS The authors declare no competing interests. PEER REVIEW PEER REVIEW INFORMATION _Communications Biology_ thanks Krishan Gupta and the other,
anonymous, reviewer(s) for their contribution to the peer review of this work. Primary Handling Editors: Debarka Sengupta, Gene Chong and Christina Karlsson Rosenthal. A peer review file is
available. ADDITIONAL INFORMATION PUBLISHER’S NOTE Springer Nature remains neutral with regard to jurisdictional claims in published maps and institutional affiliations. SUPPLEMENTARY
INFORMATION PEER REVIEW FILE SUPPLEMENTARY INFORMATION DESCRIPTION OF SUPPLEMENTARY MATERIALS SUPPLEMENTARY DATA 1 SUPPLEMENTARY DATA 2 SUPPLEMENTARY DATA 3 SUPPLEMENTARY DATA 4
SUPPLEMENTARY DATA 5 REPORTING SUMMARY RIGHTS AND PERMISSIONS OPEN ACCESS This article is licensed under a Creative Commons Attribution 4.0 International License, which permits use, sharing,
adaptation, distribution and reproduction in any medium or format, as long as you give appropriate credit to the original author(s) and the source, provide a link to the Creative Commons
licence, and indicate if changes were made. The images or other third party material in this article are included in the article’s Creative Commons licence, unless indicated otherwise in a
credit line to the material. If material is not included in the article’s Creative Commons licence and your intended use is not permitted by statutory regulation or exceeds the permitted
use, you will need to obtain permission directly from the copyright holder. To view a copy of this licence, visit http://creativecommons.org/licenses/by/4.0/. Reprints and permissions ABOUT
THIS ARTICLE CITE THIS ARTICLE Lu, Y., Chen, Q.M. & An, L. SPADE: spatial deconvolution for domain specific cell-type estimation. _Commun Biol_ 7, 469 (2024).
https://doi.org/10.1038/s42003-024-06172-y Download citation * Received: 06 June 2023 * Accepted: 10 April 2024 * Published: 17 April 2024 * DOI: https://doi.org/10.1038/s42003-024-06172-y
SHARE THIS ARTICLE Anyone you share the following link with will be able to read this content: Get shareable link Sorry, a shareable link is not currently available for this article. Copy to
clipboard Provided by the Springer Nature SharedIt content-sharing initiative