- Select a language for the TTS:
- UK English Female
- UK English Male
- US English Female
- US English Male
- Australian Female
- Australian Male
- Language selected: (auto detect) - EN
Play all audios:
ABSTRACT Oxytocin is a neuropeptide associated with both psychological and somatic processes like parturition and social bonding. Although oxytocin homologs have been identified in many
species, the evolutionary timeline of the entire oxytocin signaling gene pathway has yet to be described. Using protein sequence similarity searches, microsynteny, and phylostratigraphy, we
assigned the genes supporting the oxytocin pathway to different phylostrata based on when we found they likely arose in evolution. We show that the majority (64%) of genes in the pathway are
‘modern’. Most of the modern genes evolved around the emergence of vertebrates or jawed vertebrates (540 - 530 million years ago, ‘mya’), including _OXTR_, _OXT_ and _CD38_. Of those, 45%
were under positive selection at some point during vertebrate evolution. We also found that 18% of the genes in the oxytocin pathway are ‘ancient’, meaning their emergence dates back to
cellular organisms and opisthokonta (3500–1100 mya). The remaining genes (18%) that evolved after ancient and before modern genes were classified as ‘medium-aged’. Functional analyses
revealed that, in humans, medium-aged oxytocin pathway genes are highly expressed in contractile organs, while modern genes in the oxytocin pathway are primarily expressed in the brain and
muscle tissue. SIMILAR CONTENT BEING VIEWED BY OTHERS UNIVERSAL NOMENCLATURE FOR OXYTOCIN–VASOTOCIN LIGAND AND RECEPTOR FAMILIES Article Open access 28 April 2021 OXYTOCIN RECEPTOR
EXPRESSION PATTERNS IN THE HUMAN BRAIN ACROSS DEVELOPMENT Article 28 March 2022 IDENTIFICATION OF SHARED GENE EXPRESSION PROGRAMS ACTIVATED IN MULTIPLE MODES OF TORPOR ACROSS VERTEBRATE
CLADES Article Open access 17 October 2024 INTRODUCTION Oxytocin (OT) is a hormone and neuromodulator involved in a diverse plethora of functions in the central and peripheral nervous system
across a wide range of species, such as parturition, metabolism, or social cognition (as detailed below). Homologs to _OXT_ (the structural gene encoding OT) have been identified across
many species from mammals to fish, suggesting that OT signaling is evolutionarily ancient and conserved. Although _OXT_ orthologs have been traced for the first time in jawed vertebrate
species’ genomes1, signaling pathways resembling OT/vasotocin signaling have already been reported in mollusks2,3, insects4,5, and tunicates6. Of note, _VT_ (encoding the oligopeptide
vasotocin) was identified to be the ancestral paralogous gene from where _OXT_ was duplicated, based on their close proximity in the genomes of most vertebrate species, and on transposable
elements that possibly drove the duplication of _OXT_ from the _VT_ locus (1,7, “paralogous genes” refers to sibling genes belonging to the same gene family within one species, and they can
emerge by gene duplication from a more evolutionarily ancient gene7). For instance, the involvement of OT in parturition has been demonstrated not only in a vast number of mammalian species
(e.g., non-human primates8, rabbits9, and many others10 (including vasotocin),11,12), but possibly also in non-vertebrates such as annelids in the form of what has been considered distant
homologs13. OT has also been implicated in the regulation of energy balance and metabolism in mammals14,15,16. There is thus a growing consensus that OT and structurally similar peptides are
highly conserved, possibly reflecting conservation in their function4,17,18,19. In humans, OT has traditionally been associated with somatic reproductive processes, such as parturition20
and lactation21, but more recently it has further been linked to cardiovascular homeostasis, metabolism, and bone regeneration22,23. Its role in processes supporting social behavior and
cognition, as well as decision-making and learning in general24,25,26, has also become increasingly recognized in the past two decades27. As dysfunction in social behavior and cognition is a
key feature of several psychiatric disorders and conditions, such as schizophrenia, it follows that OT’s potential as a therapeutic to help alleviate social difficulties has been
investigated. The results are, however, inconclusive thus far28, which points to a persistent knowledge gap regarding the function and purpose of the human OT system and its treatment
potential29. Genetic studies have aided in better understanding the role of the OT system in human biology and behavior. The most intensively studied genes in the OT signaling pathway in
both humans and non-human animals are the primary OT genes _OXTR_, encoding for the OT receptor, _OXT_, and _CD38_, which also regulates OT secretion22. However, more than 150 other genes
are associated with the OT pathway as they enable and support OT signaling and functions, and mediate OT’s effects on further agents and pathways like MAP kinases in humans, as reported in
the established consensus encyclopedia on genes, genomes and pathways, “KEGG” (30,31, detailed official pathway information available at https://www.genome.jp/entry/pathway+hsa04921). Among
the sets of associated genes in the OT pathway is, for instance, the large family of genes coding for calcium voltage-gated channels, which facilitate fundamental processes in cell
functioning and signal transduction, and accordingly support other pathways besides the OT signaling pathway, too. Research is yet to systematically determine when the ancestors of all genes
supporting the OT signaling system, as opposed to two or three selected genes, emerged during evolution. A characterization of the evolutionary history of all genes in the OT signaling
pathway may guide the field toward a more comprehensive understanding of the system’s current function and purpose in modern humans (see also ref. 26), since signaling pathways, like any
other biological phenotype, are rooted in their evolutionary history and adaptiveness32. Evolution, ancestral environments and adaptions substantially contribute to shaping a phenotype into
its current form and functionality, thus tracing back the history of the OT signaling pathway can help clarify the functions of the human OT system today. Moreover, pinpointing whether a
signaling pathway consists primarily of ancient versus modern genes might be indicative of the specificity of a pathway. To this end, we sought to determine the time points in evolution when
each of the genes in the OT signaling pathway emerged, and to identify evolutionary developments (e.g., the emergence of the central nervous system or milk provisioning) and gene expression
patterns in humans that coincide with these time points. In this exploratory study, we applied a phylostratigraphic approach, using protein sequence similarity searches and microsynteny
analyses—two methods commonly used in comparative and evolutionary genetics—to identify the evolutionary age of the primary OT genes and genes supporting OT signaling. We further tested
whether genes in the OT pathway, having evolved around the emergence of a jawless and jawed vertebrate ancestor, showed signatures of positive selection during vertebrate evolution. Gene
expression patterns were investigated by assessing the expression intensities of the genes in the OT pathway across human body tissues, including the brain, and by functionally annotating
them. Providing an annotated evolutionary timeline for the OT signaling system substantiates and expands our current knowledge surrounding OT and helps better understand its function26.
RESULTS THE EVOLUTIONARY AGE OF GENES IN THE OT SIGNALING PATHWAY We used protein sequence similarity searches with protein BLAST (“BLASTp”, https://blast.ncbi.nlm.nih.gov) and microsynteny
analyses across different species to map the different homologs (orthologs or paralogs) of the OT pathway on the evolutionary timeline. Microsynteny analyses involved searching for the ten
genes flanking our genes of interest to determine whether their genomic territory is evolutionarily conserved (see “Methods” for details). Protein sequence similarity and microsynteny
searches are two of the most widely applied methods used in comparative genomics to identify homologous sequences across species33,34. When used in conjunction they can yield a robust
estimate for potential orthology. BLASTp searches were used to identify homologs in 26 species before vertebrate evolution, and combined BLASTp and microsynteny searches were used to
identify true orthologs in 13 vertebrates after vertebrate evolution. We refer to the former as homologs, since low genome and annotation quality in non-vertebrate species renders true
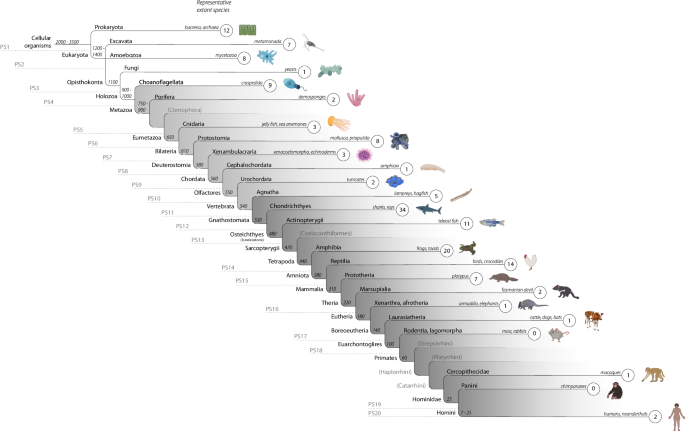
orthology identification impractical. We used these approaches to gain insight into the evolutionary origin and age of the genes supporting the OT signaling pathway (Fig. 1). Protein
sequence similarity searches among genes facilitating OT signaling revealed that 18.2% of the genes had their earliest homologous protein sequence in species dating back ~3500–1100 million
years (35; see Supplementary Data 1, sheet 1, for an overview of the species included and sheet 2 for the BLASTp thresholds for invertebrates; see Supplementary Data 2 for
BLASTp/microsynteny results for vertebrates). Thus, 28 out of the 154 genes of the OT pathway have homologs dating back to the first three phylostrata (PS), which we define as evolutionary
“ancient”. Twelve homologs (e.g., _EEF2_) were found in the first branch which includes prokaryotes (e.g., bacteria, archaea), 15 (e.g., _PPP3CC_) in the second branch of eukaryota (e.g.,
amoebozoa), and one (_PRKAG1_) in opisthokonta (third branch, e.g., fungi). For a different set of 28 genes (out of the 154 genes in total) we found meaningful protein sequence similarities
in species representing PS 4 to 10, which we define here as “medium-aged”. In other words, 18.2% of genes in the OT pathway appear to have homologous genes dating back about 1100–550 million
years35,36. The seven PS include holozoa (e.g., choanoflagellata) with nine homologs (e.g., _CAMK2A_), metazoa (e.g., porifera/sponges) with two homologs (e.g., _ITPR1_), eumetazoa (e.g.,
cnidaria) with three homologs (e.g., _CCND1_), bilateria (e.g., mollusks, nematodes/roundworms, priapulida/priapulid worms) with eight homologs (e.g., _CAMK2_), deuterostomia (e.g.,
echinodermata, xenacoelomorpha) with three homologs (e.g., _ADCY5_), chordata (e.g., cephalochordata/lancelets) with one homolog (e.g., _KCNJ6_), and olfactores (e.g., tunicata) with two
homologs (e.g., _RYR2_). In vertebrates, where we combined both protein sequence similarity and microsynteny searches, the majority of the genes in the pathway (63.6%, 98 out of 154 genes),
including _OXT_, _OXTR_ and _CD38_, had their earliest orthologs in different PS ranging from 11 to 20, which we define here as “modern” genes. For instance, we identified five orthologs in
agnatha (that we take as a proxy for the jawless vertebrate ancestor, ~540 million years ago (mya,36, PS 11), 34 (22.1%) orthologs in the great white shark (that we take as a proxy for the
gnathostome/jawed vertebrate ancestor, ~530 mya36, PS 12), 20 in amphibia (a proxy for the tetrapod ancestor, 440 mya36, PS 14), two in xenarthra/afrotheria and laurasiatheria (a proxy for
the eutherian and boreoeutherian ancestor, 180–140 mya36,37, PS 17), and two in modern humans (a proxy for the homini clade, PS 20, see Supplementary Data 3 for all genes and the assigned
PS). We found no new orthologs in PS 18 (euarchontoglires branch). These results reveal an accumulation in the emergence of genes facilitating OT signaling in the gnathostome ancestor (34
orthologs, 22.1%), 530 mya, whose most prominent extant representatives are sharks (Fig. 1). That is, approximately one fifth of the genes in the OT pathway seem to have originated in the
jawed vertebrate ancestor. Our comprehensive microsynteny analyses for the _OXT_, _OXTR_, and _CD38_ genes revealed conserved syntenic territories across vertebrates after gnathostome
evolution (~530 mya) for _OXT_ (Fig. 2) and _CD38_, and after agnatha (jawless vertebrates) evolution for _OXTR_ (~540 mya). This is in line with previous research identifying _OXT_ and
_OXTR_ orthologs as vertebrate-specific1,7,38,39,40, with _OXTR_ appearing before the emergence of _OXT_. SIGNATURES OF POSITIVE SELECTION IN JAWLESS VERTEBRATE AND GNATHOSTOME GENES IN THE
OT PATHWAY As described above, the combined BLASTp and microsynteny analyses revealed that approximately a quarter (39 out of 154) of the genes supporting the OT pathway emerged around
jawless and jawed vertebrate evolution. That is, we found five orthologs in the sea lamprey, a proxy species for the vertebrate ancestor, and 34 orthologs in the great white shark, a proxy
species for the gnathostome ancestor. In order to explore the evolutionary trajectory of these genes in more detail, we performed exploratory tests for positive selection across the same 13
vertebrate branches used for the BLASTp/microsynteny analyses leading up to the modern human in the 39 genes using adaptive branch-site random effects models (“aBSREL”41, see also ref. 42).
The tests produce, next to _P_ values and test LRTs, a maximum dN/dS value. The dN/dS ratio quantifies the rate of synonymous to non-synonymous substitutions and indicates selective
pressures43. The resulting estimate can range from 0 to, theoretically, infinity. Of the 38 genes tested (originally 39, one gene excluded during analysis, see “Methods” for details), 17
(44.74%) were found to be under positive selection in at least one branch or node (i.e., a branching point where a branch splits into two new lineages from a last common ancestor44, see
Supplementary Data 4 for all results across branches and nodes). The node or branch with most accumulation of genes under positive selection was the “mammalian” Node 8 branching into the two
lineages leading to prototheria (represented by the platypus) and theria with five significant genes (_ADCY2_: _P_ = 1.94e-2, _CACNA2D1_: _P_ = 2.06e-3, _EGFR_: _P_ = 1.30e-5, _MEF2C_: _P_
= 1.64e-6, _RYR3_: _P_ = 2.37e-2). In addition, in the order of evolutionarily most ancient to modern vertebrate branches and nodes, two genes were found to be under positive selection in
the branch leading up to the great white shark (_NFATC1_: _P_ = 6.74e-3, _RYR3_: _P_ = 2.37e-2), one gene in the branch leading to the zebrafish (_RYR3_: _P_ = 1.24e-3), two genes in the
“tetrapode” Node 5 that splits into amphibia (as represented by the western clawed frog) and amniota (_EGFR_: _P_ = 4.77e-2, _PPP1R12A_: _P_ = 1.81e-2), and two genes in the chicken/red
junglefowl ancestral branch (_ADCY7_: _P_ = 2.85e-3, _NFATC1_: _P_ = 8.09e-4). The adaptive branch-site test further revealed that, in the branch leading to the platypus, one gene showed
significant signatures of positive selection (_ADCY8_: _P_ = 5.01e-4), three genes showed signs of positive selection in the “therian” Node 9 branching into marsupialia (represented by the
Tasmanian devil) and eutheria (_ADCY8_: _P_ = 3.67e-2, _EGFR_: _P_ = 4.77e-2, _RYR3_: _P_ = 8.32e-3), two genes in the Tasmanian devil ancestral branch (_ELK1_: _P_ = 4.64e-3, _OXTR_: _P_ =
2.81e-2), three genes in the “eutherian” Node 11 that splits into xenarthra/afrotheria (represented by the nine-banded armadillo) and boreoeutheria (_ADCY7_: _P_ = 6.82e-3, _CACNA2D3_: _P_ =
4.03e-2, _EGFR_: _P_ = 4.07e-2), and again three genes in the branch leading to the nine-banded armadillo (_CACNA2D4_: _P_ = 3.73e-4, _CD38_: _P_ = 8.66e-3, _NFATC3_: _P_ = 1.28e-15).
Moreover, a proportion of nucleotide sites of one gene was found to be under selection in the “boreoeutherian” Node 12, which branches into laurasiatheria (represented by modern cattle) and
euarchontoglires (_CACNA2D1_: _P_ = 2.83e-2), of two genes in the “primate/catarrhini” Node 16 (splitting into cercopithecidae, including the rhesus macaque, and hominidae; _ELK1_: _P_ =
2.06e-2, _PLA2G4A_: _P_ = 3.03e-7), and of three genes in the rhesus macaque ancestral branch (_MEF2C_: _P_ = 2.00e-10, _PLA2G4A_: _P_ = 4.31e-3, _PRKAB1_: _P_ = 1.12e-9). Lastly, one gene,
_PLA2G4A_, was found to be under strong positive selection in the branch leading to the common chimpanzee (_P_ < 0.0001; all above-mentioned _P_ values were FDR-corrected for multiple
comparisons). The maximum dN/dS values for each gene in each branch and node are visualized in Fig. 3. The more modern the tested branch or node becomes, the narrower the distribution of
maximum dN/dS values appears, suggesting that extreme values are less common in more modern branches and nodes. THE FUNCTIONAL RELEVANCE OF AGE ESTIMATES FOR GENES IN THE OT PATHWAY Our
evolutionary analysis of the genes in the OT signaling pathway revealed 28 ancient genes (PS 1–3), 28 medium-aged genes (PS 4–10), and 98 modern vertebrate genes (PS 11–20, Supplementary
Data 3). To investigate the functional relevance of these gene subsets in the OT pathway, these three gene sets were submitted separately to FUMA (“Functional Mapping and Annotation of
Genome-Wide Associations Studies”45), which integrates human gene expression data from the GTEx database and GWAS data. This analysis revealed that out of 30 tissue types across the body,
genes from the medium-aged gene set were significantly upregulated in blood vessels (default Bonferroni corrected _P_ = 3.61e-7) and the bladder (default Bonferroni corrected _P_ = 1.26e-3),
and genes from the modern gene set were significantly upregulated in skeletal muscle tissue (default Bonferroni corrected _P_ = 1.46e-7) and the brain (default Bonferroni corrected _P_ =
1.89e-3, Fig. 4). The modern gene set in the OT pathway was further enriched in two GWAS associated with tooth decay and denture use (both _P_ = 3.72e-2, FDR-corrected for multiple testing),
which corresponds to the evolution of the jaw, and mineralization of teeth and bone in vertebrate evolution (see below). In another GWAS they were found to be related to “Automobile
speeding propensity” (also _P_ = 3.72e-2, FDR-corrected), which could be considered a proxy for impulsivity46. The ancient genes supporting the OT pathway showed no tissue-specific
upregulation or enrichment in any GWAS, with the latter being the case also for medium-aged genes with any GWAS (see Supplementary Data 6–8). CEREBRAL EXPRESSION OF MODERN GENES SUPPORTING
OT SIGNALING Based on our findings that modern genes in the OT pathway were differentially expressed in the brain, we next explored gene expression differences between brain regions in this
subset of genes from the OT pathway. Between-brain region comparisons of the expression patterns of the gene set were calculated for 42 brain regions with data from the Allen Human Brain
Atlas (“AHBA” dataset, https://human.brain-map.org, parcellation based on the Desikan–Killiany atlas, focus on left hemisphere due to a larger sample size, cortical and additional
subcortical regions included). The region-specific mRNA levels of the modern gene set in each of the 42 brain regions were compared to the average, whole-brain mRNA intensity of the modern
gene set in the pathway. This yielded statistically significant mean differences in four cortical brain regions (pars opercularis: _P_ = 4.11e-2, _d_ = 1.75, _t_ = 4.29; posterior cingulate:
_P_ = 4.11e-2, _d_ = 1.79, _t_ = 4.38; precentral gyrus: _P_ = 1.06e-2, _d_ = 2.98, _t_ = 7.29; superior frontal gyrus: _P_ = 4.44e-2, _d_ = 1.67, _t_ = 4.08; all _P_ values FDR-corrected),
and five subcortical regions (thalamus proper: _P_ = 5.24e-4, _d_ = 6.98, _t_ = −17.11; pallidum: _P_ = 2.27e-2, _d_ = 2.36, _t_ = −5.79; accumbens area: _p_ = 4.11e-2, _d_ = 1.81, _t_ =
6.87; hippocampus: _P_ = 4.11e-2, _d_ = 1.77, _t_ = −4.35; brainstem: _P_ = 1.74e-3, _d_ = 4.74, _t_ = −11.61; all _P_ values FDR-corrected). This indicates that the modern genes supporting
the OT system are upregulated in certain cortical regions, most pronounced in the precentral gyrus, and downregulated in certain subcortical, central structures, such as the basal ganglia
and limbic structures, as well as in the brainstem (Fig. 5, for all test statistics see Supplementary Data 9). Given the heterogeneous sample characteristics of the AHBA dataset, we assessed
the consistency of the cerebral expression patterns we identified for the genes in the OT pathway across donors using the differential stability metric, as implemented in the abagen
toolbox47. Differential stability (DS) is a measure based on pair-wise averaged Pearson correlations which can be used to quantify expression reproducibility48. We found that 77.21% of the
genes in the OT pathway (105 out of 136, no data available for 18 genes) were among the top 50% of all protein-coding genes in terms of expression stability, which included _OXT_, _OXTR_ and
_CD38_. This is indicative of relatively stable expression intensities of these genes in the OT pathway across donors within a comparable age category (Supplementary Data 10). DISCUSSION
Comparative and evolutionary genetics can shed light on the biological relevance of genes and the phenotypes they support. With our open, exploratory approach and analyses, we identified the
evolutionary time points when genes associated with the OT signaling pathway arose, with most of them having emerged in the gnathostome (jawed vertebrate) ancestor. Functional annotation of
these genes demonstrated that medium-aged genes are highly expressed in human contractile organs (e.g., blood vessels and bladder), whereas modern genes are upregulated in muscle tissue and
in the brain, especially in cortical regions. Combined protein sequence similarity searches and microsynteny analyses revealed that almost 20% of the genes in the OT pathway are ancient, as
they were found in species representing the first three PS (e.g., bacteria, yeasts, and other fungi phyla49). Some of these genes play a critical role in basal cellular mechanisms and
organism functioning, as they encode, for instance, the RAS protein family (e.g., _KRAS_, _NRAS_) or are members of the protein serine/threonine phosphatase family (e.g., _PPP3CC_,
_PPP3R1_). Others encode serine/threonine-specific protein kinase enzymes (e.g., _PRKAA1_, _CAMK1_), which are involved in many integral intracellular signaling processes50,51,52. Among the
medium-aged genes of the OT pathway that emerged in PS 4–10 (holozoa to olfactores), we identified a gene family coding for the voltage-gated L-type calcium channel (e.g., _CACNB2_,
_CACNB4_), an ion channel that is crucial for numerous cellular functions and may play a role in cardiac arrhythmia53. Most of the genes in this age category accumulate in PS 4 (~32%)—and
thus likely evolved in the holozoan ancestor—and in PS 7 (~29%)—and could thus have evolved in the bilaterian ancestor. Choanoflagellates (e.g., _S. rosetta_) are prominent representatives
of PS 4, which are thought to be the bridge connecting unicellularity with multicellularity54. PS 7, including species like mollusks and priapulida/priapulid worms, is where it is thought
that a centralized nervous system—which was likely not present in the eumetazoan predecessor—first appeared55. We found that among the modern genes facilitating OT signaling, various genes
from the voltage-dependent calcium channel _γ_ family were highly expressed in cerebral tissue56,57. Interestingly, subunits _CACNG_2-4, 7, and 8, along with _OXT_ and _OXTR_ and other genes
in the OT pathway, account for the brain expression signal we found in our functional annotation FUMA analyses. _CACNG4_, _5_, _6_, and _8_, which are gene members of the same family, have
been associated with schizophrenia risk58. Within that subset of modern orthologs in the OT pathway, more than one-third were allocated to the evolution of the jawed vertebrate ancestor
(represented by the great white shark) in PS 12 (Fig. 1). The emergence of the jawed vertebrates (gnathostomes) was a major evolutionary milestone and is characterized by several gene
duplications, most likely including the origin of _OXT_ from _VT_1,7,59,60. On a phenotype level, the development of a bony jaw, sophisticated teeth, mineralization of different bone
structures, the development of an adaptive immune system, and the emergence of the parasympathetic nervous system, among other features, were important advancements that likely facilitated
the diversification of feeding and preying behavior61,62. The OT system plays an important role in processes relevant to these phenotypes, such as energy balance regulation and
metabolism22,63, osteoblast regulation64,65 and bone maturation and preservation22,66. Whether these OT functions markedly shaped gnathostome evolution or whether the observation is
coincidental needs to be further substantiated by more research, as microsynteny analyses alone cannot determine this. Although speculative, broader dietary options could have led to further
development of the central nervous system and an increase in brain size, as a similar connection has already been hypothesized for the human lineage67. Lastly, _OXT_ and _CD38_ had their
earliest ortholog in PS 12 (gnathostomata), whereas we found an ortholog for _OXTR_ in PS 11 (vertebrata), before _OXT_, in line with findings from previous research on the origin of _OXT_
and its receptor1,7,40,59,68. To summarize, many of the ancient and medium-aged genes, but also some of the modern genes that facilitate OT signaling are not exclusively part of the OT
pathway. They support a variety of different pathways due to their function in ubiquitous cellular mechanisms. This, in conjunction with the finding that some genes in the OT pathway emerged
several million years before the primary OT genes themselves, points to a scenario where already existing proteins and genes became involved with _OXT_ and _OXTR_ signaling and regulation
at a later point in time during vertebrate evolution. They then progressively began to work in concert with and facilitate the more recently evolved OT nonapeptide system around _OXT_ and
_OXTR_ signaling. Subsequently, other more modern genes that evolved after _OXT_ and _OXTR_ may have taken part later in the polygenic pathway that had already been established in early
gnathostome evolution. Based on the observation that just over 25% of the genes facilitating the OT pathway seem to have had their earliest ortholog around the time of the emergence of the
jawless and jawed vertebrates, we assessed whether selective pressures affected those genes particularly during the remaining vertebrate evolution up until the emergence of homini. Our
exploratory positive selection analyses revealed evidence for positive selection in 17 out of 38 tested agnathan (jawless vertebrate) and gnathostomian (jawed vertebrate) genes in one or
more of the 13 branches and/or ten nodes during the last 540 million years. Of the principal OT genes, _OXTR_ was under positive selection in the marsupialia branch leading to the Tasmanian
devil, and _CD38_ in the xenarthra/afrotheria branch leading to the nine-banded armadillo. The signal of positive selection of _OXT_ in the homini branch leading to the modern human did not
survive correction for multiple testing. Signatures of positive selection of multiple genes were especially prominent in the ‘mammalian’ node which branches into the prototheria lineage
(represented by the extant monotreme platypus) and the theria lineage (leading to among others the Tasmanian devil, cattle, rodents, and primates), 310 million years ago. Interestingly, a
sophisticated lactation system has first been documented in early mammals like prototheria and theria69. The node further leads to the lineage split between the last egg-laying mammals
(e.g., prototherians) and viviparous mammals (i.e., eutherians and marsupials). The mammalian node hence possibly explains the genetic architecture of an important milestone in the evolution
of lactation and milk provision for offspring, which is a key differential feature of mammals. As mentioned, _OXTR_ was under positive selection in the marsupialia branch. Marsupials are
reported to have a more complex and highly adaptive lactation system since the milk composition can change drastically in some species throughout the lactation cycle69,70. Hence, the
positive selection of a considerable portion of the modern genes supporting the OT system during the evolution of the mammalian lactation system is consistent with OT’s established role in
milk let-down21. The two genes that were under positive selection in most branches or nodes were _EGFR_ and _RYR3_. _EGFR_ encodes the epidermal growth factor receptor and has been largely
implicated in the development of different types of cancers71,72, and has been explored as a treatment for neuropathic pain in cancer patients73. It may also be relevant for non-pathological
physiological functions (e.g., tyrosine kinase activation, tyrosine autophosphorylation74). _EGFR_ seems to be involved in OT signaling in several ways. One of them is the mediation of the
antiproliferative effect of OT75, which could connect back to _EGFR_’s relevance in cancer. Furthermore, _EGFR_ could be implicated in the OT pathway via regulating OT-triggered
prostaglandin pulses in the endometrium (76, as shown in bovines). The functions of the gene _RYR3_ (coding for the ryanodine receptor 3) are less straightforward since it has been linked to
a variety of conditions, ranging from hypertension to diabetes77,78. When genes are found to be under positive selection (i.e., a proportion of the nucleotides building the gene shows
signatures of positive selection), this can be indicative of the genes being ‘favored’ (i.e., selected) during a particular period of time in evolution. It follows that the 17 genes here
were of likely importance and underwent evolutionary adaption during specific periods in time, possibly because they supported phenotypes that were beneficial for survival and reproduction
during that time. Our gene enrichment and functional annotation analyses pointing to medium-aged genes in the OT pathway being primarily enriched in blood vessel and bladder tissue could
correspond to their function in tissue constriction and contraction. The enriched expression of the modern genes in the OT pathway in the brain and muscle tissue (Fig. 4), compared to the
other tissue samples, could correspond to the role of OT in uterine, heart, and mammary cell contraction79,80,81, as well as to an association with phenotypes related to cardiovascular and
energy regulation79, such as body weight14,82, and cognition24,25. These results substantiate the role of the primary OT genes and other genes involved in OT signaling in shared somatic
functions across vertebrates and invertebrates, as well as in higher-order functions of the central nervous system in vertebrates, which presumably evolved later. Our detailed cerebral gene
expression results shed light on the specifics of the upregulation of modern genes in the OT pathway in the brain, showing that those genes are significantly more expressed in certain
cortical regions, mostly frontal lobe regions (e.g., superior frontal gyrus, precentral gyrus, Fig. 5). Since cortical, particularly fronto-cortical, regions are involved in higher-order
cognitive functions83,84 and partially motor control85, this could link to the role of the OT system in cognition (e.g., ref. 24) and neurodevelopmental conditions associated with motor
control challenges86. The downregulation of the modern genes in the signaling pathway in subcortical regions might at first glance appear contradictory to other studies. For example,
Quintana and colleagues87 reported an increased _OXTR_ and _CD38_ expression in the thalamus. However, it is important to note that in our study, out of the modern genes tested, _OXTR_ and
_CD38_ were among the above-average upregulated genes (whole-brain (black dashed line) and subcortical (gray dashed line) average) in all of the subcortical structures, especially in the
pallidum, accumbens area, caudate, and thalamus proper (Fig. 5a). We also found some _OXT_ mRNA signal in subcortical regions that are usually not prominently associated with the synthesis
of _OXT_. The presence of small amounts of _OXT_ mRNA in those regions is also reported in other databases (e.g., “Bgee”88, https://www.bgee.org; “GTEx”89, https://gtexportal.org) and
studies (e.g.,87, using the same data), and the _OXT_ mRNA intensity is still considerably higher in regions where it is to be expected (e.g., hypothalamus, compare
https://human.brain-map.org). Lastly, the results of the cerebral gene expression analysis rely on the high-resolution AHBA brain expression dataset. Although this dataset provides the major
advantage of higher anatomical resolution, it only consists of six donors, with mixed ancestries and an unbalanced sex ratio. To address this heterogeneity in the sample, we used
differential stability (DS) which showed that almost 80% of the signaling pathway genes had DS scores that were among the top 50% of all protein-coding genes, indicating generalizable gene
expression patterns48. There are additional limitations to the current study that are worth noting. First, an issue that hampers the identification of true orthologs in more ancient species
is the lack of fully sequenced, annotated, complete and high-quality genomes for many invertebrate species. Genomes of thoroughly studied ancient model organisms like _C. elegans_, _E. coli_
and _S. cerevisiae_ are available. However, genomes and proteomes of ancient species stemming from PS 4–6, for instance, are often only sequenced at a scaffold level and are still
incompletely annotated. Data availability and quality improve slightly for species of PS 7–11. These circumstances render the search for conserved syntenic blocks across species intricate.
Consequently, the emergence of orthologous genes of the current OT signaling pathway in older species cannot be reliably traced back, hence we attributed as “homologs” the genes we
identified based on BLASTp hits only. One should bear in mind that we cannot rule out that these homologs could either be orthologs (i.e., the same gene across species) or paralogs (i.e.,
genes of the same gene family but not the same gene). The search for orthologous genes will remain a challenge until genomes from species older than vertebrates are sequenced at a chromosome
level and properly annotated with a uniform consensus gene nomenclature90. Furthermore, the emergence of vertebrates is characterized by one or several rounds of whole-genome duplications
(which also produced the diverse _OXT_/_VT_ gene family in vertebrates), which might be linked to the origin of evolutionary novelties91,92. Since plenty of new genetic material seems to
have emerged around that time, it remains to be clarified whether the “gnathostomian” boost of novel genes supporting the OT pathway nowadays is part of this general genomic proliferation,
or whether it is a unique occurrence specific to the OT system. Future research on other endocrine signaling pathways of similar size using the same analysis pipeline may help resolve this
question. Regarding the positive selection analysis, we deployed aBSREL as implemented in HyPhy41 to test for positive selection in a non-hypothesis-driven fashion to accommodate the
exploratory nature of the analysis, and leveraged the advantage of the method to automate running a large number of tests for multiple branches and nodes simultaneously without the
requirement to specify foreground branches a priori. However, it must be acknowledged that this analysis approach necessitating multiple testing of several branches has reduced statistical
power and thus an increased chance of false negatives. Concerning the FUMA analysis, we submitted three gene sets of varying sizes (_n_ = 28, _n_ = 28, _n_ = 98). Since the online tool is
based on hypergeometric tests operating in the background, it must be noted that smaller gene sets, like the ancient and medium-aged gene sets in this study, are more likely to produce false
positives, as compared to larger gene sets, such as the modern gene set in this study. Looking at the accumulated published studies using FUMA, there currently does not seem to be a
standard corrective mechanism for this potential issue in place. The investigation of such a mechanism may be of interest to future studies. Lastly, for the cerebral gene expression we used
data from the left hemisphere only due to the reduced sample size for the right hemisphere in the AHBA dataset. The human brain is known for its lateralization, and asymmetries in
transcriptomes93. Thus, the reported gene expression patterns might be slightly different for the right hemisphere. Until more high-resolution parcellation data for cerebral gene expression
is available from a larger sample size in both hemispheres, this issue remains to be clarified. In this study, we found that homologs enabling OT signaling emerged in different PS throughout
evolution, with the vast majority of them originating after the emergence of the vertebrate ancestor. We confirm prior studies reporting that OT ligand orthologs date back to at least 530
mya4,19,59, and our analysis expands those findings, suggesting that ~40% of homologs of genes supporting what makes up the OT signaling pathway date even further back49,94. Accordingly, we
suggest that the evolution of the OT signaling pathway was a gradual process in which evolutionary ancient genes first started interacting with and supporting OT signaling around the
evolution of vertebrates and jawed vertebrates, but other genes joined the OT signaling system afterward. We also provide evidence that modern genes part of the OT signaling pathway, found
only in vertebrates, are significantly expressed in human muscle and brain tissue and have been associated with mental illness and complex cognition. The role of the OT system in
non-stereotypical locomotion, higher-order cognition and social behavior may therefore not have been an initial function but only have evolved later when new environmental demands required
it. We also provide a possible link between the emergence of phenotypic novelties related to the jaw and bones seen in gnathostomes and the lactation system evolved in early mammals, and the
OT pathway. By systematically mapping the evolutionary history of the OT signaling system, and gene expression correlates in humans, our study provides a greater understanding of the OT
signaling pathway that can inform future experiments and treatments in humans. METHODS If not stated otherwise, the statistical software R (version 4.2.095) and RStudio (version
2022.7.1.55496) were used for analyses and data visualizations (except for Figs. 1, 2, parts of Figs. 3, 4a, see “Acknowledgments”). The R package tidyverse97 was used to conduct core
analyses (see below and supplementary references for further R packages used). The 154 genes thought to be involved in OT signaling were retrieved from the official consensus encyclopedia
“Kyoto Encyclopedia of Genes and Genomes” (KEGG30), where they are reported to be part of the OT signaling pathway. An overview of the pathway information and visual representation is
accessible at https://www.genome.jp/entry/pathway+hsa04921, see also ref. 31. GENE AGE ESTIMATES (PHYLOSTRATIGRAPHY) To identify gene orthologs (of the 154 genes currently supporting the OT
signaling pathway) in _vertebrates_, we performed protein BLAST (“BLASTp”, NCBI, https://blast.ncbi.nlm.nih.gov) queries and microsynteny analyses. The _Homo sapiens_ protein sequence (FASTA
format, downloaded from https://blast.ncbi.nlm.nih.gov) was used as a reference and queried against the proteomes of the following target species: chicken/red junglefowl (_Gallus gallus_),
western clawed frog (_Xenopus tropicalis_), zebrafish (_Danio rerio_), great white shark (_Carcharodon carcharias_), and sea lamprey (_Petromyzon marinus_; database “non-redundant protein
sequences"). These five species, as extant descendants of major vertebrate lineages, were taken as proxies for their amniota, tetrapoda, euteleostomi, gnathostomata, and agnatha/jawless
vertebrates ancestor, respectively. They are furthermore well-studied model organisms and have genomes sequenced at chromosome level (i.e., high coverage) available. From the BLASTp
results, we used the hits (and their accession numbers) with the lowest E-value (expect value) and highest max score of each target species in each gene and entered them into the NCBI gene
search engine (https://www.ncbi.nlm.nih.gov) to trace back the gene underlying the hit. Subsequently, we used these gene loci to perform microsynteny analyses on a 10-gene window, that is,
the five protein-coding genes before and after our gene of interest. Neighboring protein-coding genes were identified using the information from the “genomic regions, transcripts, and
products" section in the NCBI gene database; pseudo-genes, exons, and RNA regions were excluded. Vertebrate microsynteny for each gene supporting the OT signaling pathway was
established using this approach. For those genes where the synteny of neighboring genes around the focal gene seemed to be markedly scattered or absent in the sea lamprey or great white
shark, we hypothesized that these genes had evolved after agnathans/jawless vertebrates or gnathostomes and no further BLASTp searches with _non_-vertebrate species were run. For those
“vertebrates genes” that were present in the modern human genome but appeared to have no shared synteny in the chicken/red junglefowl, western clawed frog or zebrafish either we searched for
BLASTp hits and microsynteny in other mammalian species to determine the timing of their emergence (i.e., chimpanzee (_Pan troglodytes_), rhesus macaque (_Macaca mulatta_), house mouse
(_Mus musculus_), cattle (_Bos taurus_), nine-banded armadillo (_Dasypus novemcinctus_), Tasmanian devil (_Sarcophilus harrisii_), and platypus (_Ornithorhynchus anatinus_); see
Supplementary Data 1, sheet 1, for a list of the vertebrate species). We then performed BLASTp searches in 26 _non_-vertebrate target species for the genes with vertebrate-wide microsynteny
that was present in the sea lamprey or the great white shark (_n_gene = 95). We used sea lamprey or great white shark protein sequences identified before of these remaining genes as queries
and BLASTed them against the proteomes of the 26 target species ranging from cellular organisms (e.g., bacterium _Escherichia coli_) to tunicates (e.g., _Ciona savignyi_; see Supplementary
Data 1, sheet 1, for a list of the invertebrate species). This was done to help determine whether there are any potential homologs in more ancient species than vertebrates. Of note, since
microsynteny is less feasible and reliable for the majority of ancient species’ genomes, due to poor sequencing quality and incomplete annotation, no additional microsynteny analyses were
performed in the non-vertebrate species. Possible hits in non-vertebrates are therefore referred to as “homologs” and could not be distinguished between “orthologs” and “paralogs”. A scaled
_and_ averaged max score threshold specific to each of the 26 non-vertebrate species was calculated as follows to function as a cutoff value to determine reliable protein sequence
similarity. For each protein sequence comparison that yielded a hit in BLASTp, first, a scaled max score was calculated by dividing the largest max score by the sum of the lengths of the hit
protein sequence and the reference protein sequence. For instance, the BLASTp query for _OXTR_ yielded several hits in the tunicate _Ciona savignyi_ and the hit with the highest max score
was at a value of 92.8. This value was divided by 795, the sum of 364 (sequence length of said _OXTR_ hit in _C. savignyi_) and 431 (sequence length of the reference _OXTR_ protein in the
sea lamprey), yielding a scaled max score of 0.1167296. The scaled max scores were then averaged across genes per target species, resulting in the scaled and averaged (mean) max score, which
functioned as the cutoff value specific to a non-vertebrate species (i.e., each non-vertebrate species had its own unique cutoff value). If a scaled max score of a gene for a species was
above that species-specific cutoff value, the hit was considered a putative homolog. As an example, the averaged, scaled cutoff value for _C. savignyi_ is 0.2098398, hence the aforementioned
_OXTR_ BLASTp hit in _C. savignyi_ with a scaled max score of 0.1167296 would not pass the threshold and would not be considered a homolog. These calculations allow one to normalize protein
sequence lengths, which have an impact on sequence similarity discovery since BLASTp max scores for genes with longer sequences are by definition smaller than those for genes with shorter
sequences due to BLASTp not accounting for sequence length (see also ref. 98). For all averaged, scaled max score thresholds and scaled max score values, see Supplementary Data 1, sheet 2.
Orthologs and homologs were finally sorted into three categories. Genes dating back to species from phylostratum (PS) 1–3 (99, including cellular organisms, eukaryota and opisthokonta) were
classified as “ancient”, genes with homologs dating back to PS 4–10 (including holozoa, metazoa, eumetazoa, bilateria, deuterostomia, chordata and olfactores) were classified as
“medium-aged”, and genes with orthologs in PS 11–20 (including among others vertebrata, gnathostomata, osteichthyes, tetrapoda, mammalia, and euarchontoglires) were classified as “modern”
genes (see Supplementary Data 1, sheet 1, for a detailed phylogeny). We chose to primarily rely on max scores, since this metric allowed us to apply extended normalization statistics, unlike
E-values, which we found not sufficiently informative on their own to make the homolog versus non-homolog differentiation. The phylogeny used to represent the evolutionary timeline from
cellular organisms to humans including the species and lineage splits was constructed with reference to refs.
35,36,37,59,100,101,102,103,104,105,106,107,108,109,110,111,112,113,114,115,116,117,118,119 (but also note ref. 120) and verified with the help of the NCBI Taxonomy Browser
(https://www.ncbi.nlm.nih.gov/Taxonomy/Browser/wwwtax.cgi). SIGNATURES OF NATURAL SELECTION IN THE JAWLESS VERTEBRATE AND GNATHOSTOME OT PATHWAY GENES A detailed guide with requirements,
instructions, and tips for this positive selection analysis is provided in Supplementary Note 1. Briefly, exploratory tests for episodic positive selection across the same thirteen
vertebrate species that were used in the BLASTp/microsynteny analyses (_H. sapiens_, _P. troglodytes_, _M. mulatta_, _M. musculus_, _B. taurus_, _D. novemcinctus_, _S. harrisii_, _O.
anatinus_, _G. gallus_, _X. tropicalis_, _D. rerio_, _C. carcharias_, _P. marinus_), representing major branches in vertebrate evolution, were performed on the five genes that had their
earliest ortholog in the extant proxy species (_P. marinus_) for the vertebrate ancestor (i.e., _ADCY9_, _GUCY1A2_, _OXTR_, _PIK3R5_, _PLA2G4A_) and on the 34 genes that had their earliest
ortholog in the extant proxy species (_C. carcharias_) for the gnathostome ancestor (i.e., _ADCY1_, _ADCY2_, _ADCY7_, _ADCY8_, _CACNA2D1_, _CACNA2D3_, _CACN2D4_, _CACNG1_, _CACNG3_,
_CACNG4_, _CACNG5_, _CD38_, _EEF2K_, _EGFR_, _ELK1_, _FOS_, _JUN_, _KCNJ12_, _KCNJ2_, _KCNJ3_, _KCNJ4_, _KCNJ5_, _MEF2C_, _MYLK3_, _NFATC1_, _NFACT2_, _NFACT3_, _OXT_, _PLA2G4F_, _PLCB1_,
_PPP1R12A_, _PRKAB1_, _RAF1_, _RYR3_), as identified by the preceding combined BLASTp and microsynteny. First, orthologous protein sequences (AAS) and coding sequences (CDS) for the 39 genes
in each of the 13 species—if an orthologous sequence was present—were manually downloaded from NCBI. The information on which sequences with which accession number were the most credible
was taken from the previous combined BLASTp and microsynteny analyses (compare Supplementary Data 2). For each gene, the AAS and CDS from the different species were manually collected into
an aggregative protein FASTA file and a CDS FASTA file, respectively. This resulted in 39 protein FASTA and 39 CDS FASTA files. Subsequently, the AAS in each aggregative file were aligned
using MUSCLE (version 5.1, https://github.com/rcedgar/muscle121) yielding 39 separate protein multiple sequence alignments, one for each gene. The protein multiple sequence alignments were
translated into codon-based alignments based on the corresponding previously collected CDS using PAL2NAL (version 14122). The codon-alignment files were further processed for the main
analysis by indicating missing orthologs with empty dummy sequences, by changing the sequence identifiers to shortened taxon names (e.g., “hsapiens", “ggallus”), and by converting the
FASTA format codon-alignments to PHYLIP sequential format files using TriFusion (version 1.0.1, https://github.com/ODiogoSilva/TriFusion123). A vertebrate species tree was generated with
TimeTree (version 5, http://timetree.org124), which draws on public data from published studies to generate reliable and robust species trees, and downloaded in Newick format. That tree is
in line with the manually built tree derived from a literature search for the BLASTp and microsynteny analysis (compare to Fig. 1). The branch lengths in the species tree were manually
removed from the tree file and the taxon names were shortened to match the sequence identifiers in the codon-based alignments. Following this, exploratory searches for positive selection of
each gene along the vertebrate species tree using adaptive branch-site random effects likelihood models (“aBSREL”, version 2.341) from the HyPhy package (version 2.5.52,
https://github.com/veg/hyphy125) were performed. aBSREL allows for non-hypothesis-driven (i.e., exploratory) positive selection analyses. That is, all branches and nodes are tested and no
foreground branch needs to be specified a priori. The method uses a modified version of the classic branch-site model that allows for an adaptive number of _ω_ classes per branch depending
on the evolutionary properties of the branch. It compares the full, alternative model against a null model and then performs a Likelihood Ratio Test (“LRT”, for a detailed description of the
aBSREL test, see ref. 41). The method further comes with the advantage of automating running a large number of tests for multiple branches and nodes simultaneously. In R, all resulting raw
_P_ values were corrected for multiple testing with the Benjamini–Hochberg False Discovery Rate (FDR) correction method at an initial significance threshold of _α_ = 0.05. The branch-site
test did not finish for the gene _MYLK3_, most likely due to poor sequencing quality in the platypus _O. anatinus_. FUNCTIONAL ANNOTATION WITH FUMA To functionally annotate the results from
the phylostratigraphic BLASTp and microsynteny analyses, the data was submitted to the “Functional Mapping and Annotation of Genome-Wide Association Studies” (FUMA) web application
(https://fuma.ctglab.nl,45) GENE2FUNC in three separate queries for the “ancient” (homologs in branches cellular organisms to opisthokonta, PS 1–3), “medium-aged” (homologs in branches
holozoa to olfactores, PS 4–10) and “modern” (orthologs in branches vertebrata to homini, PS 11–20) gene sets (background set “Protein-coding”, Ensembl version v92 (v102 for the ancient
genes), MHC included, all default Bonferroni corrected, FDR correction for the gene-set enrichment testing). The tool uses RNA-seq data from GTEx v8126 to test for tissue-specific enrichment
of the gene set (here focused on 30 tissues across the human body, including the brain) and performs a hypergeometric test to assess enrichment of genes in different categories (i.e., GWAS)
and pathways. Detailed information about the data sets and configuration of statistic tests implemented in FUMA can be found in ref. 45. CEREBRAL EXPRESSION OF MODERN GENES SUPPORTING OT
SIGNALING The FUMA tissue specificity results were extended with between-brain region expression specificity analyses for the modern genes supporting OT signaling. For these, first,
expression data from the Allen Human Brain Atlas (“AHBA”, _n_ = 6 (1 female, 5 males), ages 24.0–57.0, three of Caucasian ethnicity, two African American, one Hispanic,
https://human.brain-map.org127) was preprocessed with the Python toolbox abagen (version 0.1.1, https://github.com/rmarkello/abagen47) in Jupyter Lab based on the processing pipeline
suggested by ref. 128. According to the documentation, the expression data collection process complied with the relevant ethical regulations concerning the collection and processing of human
postmortem tissue samples. Consent from the next-of-kin of each donor was obtained. Detailed information regarding the data collection procedures can be found at https://human.brain-map.org
and ref. 128 (see also Supplementary Information thereof). The following processing steps were performed for each of the six donors’ cortical and subcortical regions in one joint query.
Cortical and subcortical expression data for six brains was prepared using the 83-region (34 cortical, lateralized, and eight additional subcortical areas of which seven lateralized,
brainstem structure bilateral) volumetric Desikan–Killiany atlas in MNI space129 (subcortical structures included in the abagen analysis pipeline). Microarray probes were reannotated using
data provided in ref. 128; probes not matched to a valid Entrez ID were discarded. Probes were then filtered based on their expression intensity relative to background noise130. Probes with
intensity less than the background in less than 50.00% of samples across donors were excluded, yielding 31,569 probes. When multiple probes indexed the expression of the same gene, the probe
with the most consistent pattern of regional variation across donors (i.e., differential stability48) was selected. Here, regions correspond to the structural designations provided in the
ontology from the AHBA. The MNI coordinates of tissue samples were updated to those generated via non-linear registration using the Advanced Normalization Tools (“ANTs”,
https://github.com/chrisfilo/alleninf). Samples were assigned to brain regions in the Desikan–Killiany atlas if their MNI coordinates were within 2 mm of a given parcel. To reduce the
potential of misassignment, sample-to-region matching was constrained by hemisphere and gross structural divisions (i.e., cortex, subcortex/brainstem, and cerebellum, such that e.g., a
sample in the left cortex could only be assigned to an atlas parcel in the left cortex128). If a brain region was not assigned a tissue sample based on that procedure, every voxel in the
region was mapped to the nearest tissue sample from the donor in order to generate a dense, interpolated expression map. The average of these expression values was taken across all voxels in
the region, weighted by the distance between each voxel and the sample mapped to it, in order to obtain an estimate of the parcellated expression values for the missing region.
Inter-subject variation was addressed by normalizing tissue sample expression values across genes using a robust sigmoid function131. Normalized expression values were then rescaled. Gene
expression values were normalized across tissue samples using an identical procedure. All available tissue samples were used in the normalization process regardless of whether they were
assigned to a brain region. Tissue samples not matched to a brain region were discarded after normalization. Samples assigned to the same brain region were averaged separately for each
donor. These processing steps resulted in six expression matrices, one for each donor, with 83 rows corresponding to brain regions and 15,633 columns corresponding to genes (Supplementary
Data 14–19, available at https://osf.io/rxphw). Finally, 81 modern genes in the OT pathway were extracted (17 were not available in the processed matrices). Differential stability (DS)
values were also obtained with the abagen toolbox. Because the values are not directly accessible from the above-described workflow, they were calculated in an adjunct query with the
difference that the DS estimates obtained with this procedure are computed as correlations between parcels in the Desikan–Killiany atlas as opposed to the main query where they are computed
between the AHBA-defined brain structures. The DS values from the main query and the adjunct query can thus differ minimally, however, they generally are highly similar. Subsequently,
between-brain region comparisons of the expression profile of the modern gene set in the OT pathway were calculated with the prepared matrices as follows. Between-region comparisons were
implemented with 42 two-sided one-sample _t_ tests (one _t_ test per brain region, only left cortical hemisphere due to sample size limitations for the right hemisphere (_n_ = 2)). For each
brain region and each of the six subjects, the expression intensities of the modern gene set facilitating OT signaling in that region were compared against the whole-brain population mean
expression of the gene set (i.e., the average expression of the modern gene set facilitating OT signaling across all available brain regions and donors); _P_ values were adjusted for 42
comparisons with the FDR correction method. The Desikan–Killiany cortical atlas values were visualized using the R package ggseg (https://github.com/ggseg/ggseg132). As a measure of effect
size, Cohen’s _d_ for one-sample _t_ tests was calculated. REPORTING SUMMARY Further information on research design is available in the Nature Portfolio Reporting Summary linked to this
article. DATA AVAILABILITY Sequences used for the gene age estimations/phylostratigraphy and positive selection analysis were downloaded from https://blast.ncbi.nlm.nih.gov. The databases
for the functional annotation analysis in FUMA are included and available in the FUMA online tool at https://fuma.ctglab.nl. The AHBA data and cerebral atlas used for this study are included
in the Python toolbox abagen. Further information and other download links for the AHBA data are available at https://human.brain-map.org. All other data used in the analyses not mentioned
above are deposited at https://osf.io/rxphw133. CODE AVAILABILITY R and Jupyter Notebook/Python scripts used in the analyses with information on specific parameter settings, further code,
data, Supplementary Information, and additional notes are all available at https://osf.io/rxphw. A guide with requirements and instructions for the positive selection analysis is provided in
Supplementary Note 1. REFERENCES * Theofanopoulou, C., Gedman, G., Cahill, J. A., Boeckx, C. & Jarvis, E. D. Universal nomenclature for oxytocin-vasotocin ligand and receptor families.
_Nature_ 592, 747–755 (2021). Article CAS PubMed PubMed Central Google Scholar * Takuwa-Kuroda, K., Iwakoshi-Ukena, E., Kanda, A. & Minakata, H. Octopus, which owns the most
advanced brain in invertebrates, has two members of vasopressin/oxytocin superfamily as in vertebrates. _Regul. Pept._ 115, 139–149 (2003). Article CAS PubMed Google Scholar * Reich, G.
A new peptide of the oxytocin/vasopressin family isolated from nerves of the cephalopod octopus vulgaris. _Neurosci. Lett._ 134, 191–194 (1992). Article CAS PubMed Google Scholar *
Donaldson, Z. R. & Young, L. J. Oxytocin, vasopressin, and the neurogenetics of sociality. _Science_ 322, 900–904 (2008). * Stafflinger, E. et al. Cloning and identification of an
oxytocin/vasopressin-like receptor and its ligand from insects. _Proc. Natl. Acad. Sci. USA_ 105, 3262–3267 (2008). * Urano, A., Hyodo, S. & Suzuki, M. Chapter 4 molecular evolution of
neurohypophysial hormone precursors. In _Progress in Brain Research_ (eds Joosse, J. et al.) Vol. 92, 39–46 (Elsevier, 1992). * Gwee, P.-C., Tay, B.-H., Brenner, S. & Venkatesh, B.
Characterization of the neurohypophysial hormone gene loci in elephant shark and the Japanese lamprey: origin of the vertebrate neurohypophysial hormone genes. _BMC Evol. Biol._ 9, 47
(2009). Article PubMed PubMed Central Google Scholar * Vargas-Pinilla, P. et al. Evolutionary pattern in the OXT-OXTR system in primates: coevolution and positive selection footprints.
_Proc. Natl. Acad. Sci. USA_ 112, 88–93 (2015). Article CAS PubMed Google Scholar * Fuchs, A.-R. & Dawood, Y. M. Oxytocin release and uterine activation during parturition in
rabbits. _Endocrinology_ 107, 1117–1126 (1980). Article CAS PubMed Google Scholar * Landgraf, R., Schulz, J., Eulenberger, K. & Wilhelm, J. Plasma levels of oxytocin and vasopressin
before, during and after parturition in cows. _Exp. Clin. Endocrinol. Diabetes_ 81, 321–328 (1983). * Rapacz-Leonard, A., Leonard, M., Chmielewska-Krzesińska, M., Siemieniuch, M. &
Janowski, T. E. The oxytocin-prostaglandins pathways in the horse (_Equus caballus_) placenta during pregnancy, physiological parturition, and parturition with fetal membrane retention.
_Sci. Rep._ 10, 2089 (2020). * Gram, A., Boos, A. & Kowalewski, M. Uterine and placental expression of canine oxytocin receptor during pregnancy and normal and induced parturition.
_Reprod. Domest. Anim._ 49, 41–49 (2014). Article CAS PubMed Google Scholar * Fujino, Y. et al. Possible functions of oxytocin/vasopressin-superfamily peptides in annelids with special
reference to reproduction and osmoregulation. _J. Exp. Zool._ 284, 401–406 (1999). Article CAS PubMed Google Scholar * Blevins, J. E. & Baskin, D. G. Translational and therapeutic
potential of oxytocin as an anti-obesity strategy: Insights from rodents, nonhuman primates and humans. _Physiol. Behav._ 152, 438–449 (2015). Article CAS PubMed PubMed Central Google
Scholar * Camerino, C. Low sympathetic tone and obese phenotype in oxytocin-deficient mice. _Obesity_ 17, 980–984 (2009). Article CAS PubMed Google Scholar * Takayanagi, Y. et al.
Oxytocin receptor-deficient mice developed late-onset obesity. _NeuroReport_ 19, 951–955 (2008). Article CAS PubMed Google Scholar * Carter, C. S. Oxytocin pathways and the evolution of
human behavior. _Annu. Rev. Psychol._ 65, 17–39 (2014). Article PubMed Google Scholar * Gimpl, G. & Fahrenholz, F. The oxytocin receptor system: structure, function, and regulation.
_Physiol. Rev._ 81, 629–683 (2001). Article CAS PubMed Google Scholar * Knobloch, H. & Grinevich, V. Evolution of oxytocin pathways in the brain of vertebrates. _Front. Behav.
Neurosci._ 8, 31 (2014). Article PubMed PubMed Central Google Scholar * Howarth, G. & Botha, D. J. Amniotomy plus intravenous oxytocin for induction of labour. _Cochrane Database
Syst. Rev._ 2001, CD003250 (2001). PubMed PubMed Central Google Scholar * Ruis, H., Rolland, R., Doesburg, W., Broeders, G. & Corbey, R. Oxytocin enhances onset of lactation among
mothers delivering prematurely. _BMJ_ 283, 340–342 (1981). Article CAS PubMed PubMed Central Google Scholar * Jurek, B. & Neumann, I. D. The oxytocin receptor: From intracellular
signaling to behavior. _Physiol. Rev._ 98, 1805–1908 (2018). Article CAS PubMed Google Scholar * Winterton, A., Westlye, L. T., Steen, N. E., Andreassen, O. A. & Quintana, D. S.
Improving the precision of intranasal oxytocin research. _Nat. Hum. Behav._ 5, 9–18 (2021). Article PubMed Google Scholar * Kapetaniou, G. E. et al. The role of oxytocin in delay of
gratification and flexibility in non-social decision making. _eLife_ 10, e61844 (2021). Article CAS PubMed PubMed Central Google Scholar * Zhuang, Q. et al. Oxytocin-induced
facilitation of learning in a probabilistic task is associated with reduced feedback- and error-related negativity potentials. _J. Psychopharmacol._ 35, 40–49 (2021). Article CAS PubMed
Google Scholar * Quintana, D. S. & Guastella, A. J. An allostatic theory of oxytocin. _Trends Cogn. Sci._ 24, 515–528 (2020). Article PubMed Google Scholar * Lippert, T. H., Mueck,
A. O., Seeger, H. & Pfaff, A. Effects of oxytocin outside pregnancy. _Horm. Res._ 60, 262–271 (2003). CAS PubMed Google Scholar * Bradley, E. R. & Woolley, J. D. Oxytocin effects
in schizophrenia: reconciling mixed findings and moving forward. _Neurosci. Biobehav. Rev._ 80, 36–56 (2017). Article CAS PubMed PubMed Central Google Scholar * Erdozain, A. M. &
Peñagarikano, O. Oxytocin as treatment for social cognition, not there yet. _Front. Psychiatry_ https://doi.org/10.3389/fpsyt.2019.00930 (2020). * Kanehisa, M., Furumichi, M., Tanabe, M.,
Sato, Y. & Morishima, K. KEGG: new perspectives on genomes, pathways, diseases and drugs. _Nucleic Acids Res._ 45, D353–D361 (2017). Article CAS PubMed Google Scholar * Devost, D.,
Wrzal, P. & Zingg, H. H. Oxytocin receptor signalling. _Prog. Brain Res._ 170, 167–176 (2008). Article CAS PubMed Google Scholar * Wells, J. C. K., Nesse, R. M., Sear, R., Johnstone,
R. A. & Stearns, S. C. Evolutionary public health: introducing the concept. _Lancet_ 390, 500–509 (2017). Article PubMed Google Scholar * Liu, D., Hunt, M. & Tsai, I. J.
Inferring synteny between genome assemblies: a systematic evaluation. _BMC Bioinforma._ 19, 26 (2018). Article Google Scholar * Pearson, W. R. An introduction to sequence similarity
("homology”) searching. _Curr. Protoc. Bioinforma._ 42, 3.1.1–3.1.8 (2013). Article Google Scholar * Lozano-Fernandez, J., dos Reis, M., Donoghue, P. C. & Pisani, D. RelTime rates
collapse to a strict clock when estimating the timeline of animal diversification. _Genome Biol. Evol._ 9, 1320–1328 (2017). Article PubMed PubMed Central Google Scholar * Suzuki, N.
Glycan diversity in the course of vertebrate evolution. _Glycobiology_ 29, 625–644 (2019). Article CAS PubMed Google Scholar * Villar, D. et al. Enhancer evolution across 20 mammalian
species. _Cell_ 160, 554–566 (2015). Article CAS PubMed PubMed Central Google Scholar * Mayasich, S. A. & Clarke, B. L. The emergence of the vasopressin and oxytocin hormone
receptor gene family lineage: clues from the characterization of vasotocin receptors in the sea lamprey (_Petromyzon marinus_). _Gen. Comp. Endocrinol._ 226, 88–101 (2016). Article CAS
PubMed Google Scholar * Ocampo Daza, D., Lewicka, M. & Larhammar, D. The oxytocin/vasopressin receptor family has at least five members in the gnathostome lineage, inclucing two
distinct v2 subtypes. _Gen. Comp. Endocrinol._ 175, 135–143 (2012). Article CAS PubMed Google Scholar * Ocampo Daza, D., Bergqvist, C. A. & Larhammar, D. The evolution of oxytocin
and vasotocin receptor genes in jawed vertebrates: a clear case for gene duplications through ancestral whole-genome duplications. _Front. Endocrinol._ 12, 792644 (2022). Article Google
Scholar * Smith, M. D. et al. Less is more: an adaptive branch-site random effects model for efficient detection of episodic diversifying selection. _Mol. Biol. Evol._ 32, 1342–1353 (2015).
Article CAS PubMed PubMed Central Google Scholar * Álvarez Carretero, S., Kapli, P. & Yang, Z. Beginner’s guide on the use of PAML to detect positive selection. _Mol. Biol. Evol._
40, msad041 (2023). Article PubMed PubMed Central Google Scholar * Yang, Z. & Bielawski, J. P. Statistical methods for detecting molecular adaptation. _Trends Ecol. Evol._ 15,
496–503 (2000). Article CAS PubMed PubMed Central Google Scholar * Baum, D. Reading a phylogenetic tree: the meaning of monophyletic groups. _Nat. Educ._ 1, 190 (2008). * Watanabe, K.,
Taskesen, E., van Bochoven, A. & Posthuma, D. Functional mapping and annotation of genetic associations with FUMA. _Nat. Commun._ 8, 1826 (2017). Article PubMed PubMed Central Google
Scholar * Bıçaksız, P. & Özkan, T. Impulsivity and driver behaviors, offences and accident involvement: a systematic review. _Transport. Res. Part F: Traffic Psychol. Behav._ 38,
194–223 (2016). Article Google Scholar * Markello, R. D. et al. Standardizing workflows in imaging transcriptomics with the abagen toolbox. _eLife_ 10, e72129 (2021). * Hawrylycz, M. et
al. Canonical genetic signatures of the adult human brain. _Nat. Neurosci._ 18, 1832–1844 (2015). Article CAS PubMed PubMed Central Google Scholar * Cooper, G. M. _The Origin and
Evolution of Cells._ _The Cell: A Molecular Approach_, 2nd edition (Sinauer Associates, 2000). * Creamer, T. P. Calcineurin. _Cell Commun. Signal._ 18, 137 (2020). Article CAS PubMed
PubMed Central Google Scholar * Swulius, M. T. & Waxham, M. N. Ca(2+)/calmodulin-dependent protein kinases. _Cell. Mol. Life Sci.: CMLS_ 65, 2637–2657 (2008). Article CAS PubMed
Google Scholar * Taylor, S. S. et al. PKA: a portrait of protein kinase dynamics. _Biochimica Et. Biophysica Acta_ 1697, 259–269 (2004). Article CAS PubMed Google Scholar * Zhang, Q.,
Chen, J., Qin, Y., Wang, J. & Zhou, L. Mutations in voltage-gated l-type calcium channel: implications in cardiac arrhythmia. _Channels_ 12, 201–218 (2018). Article PubMed PubMed
Central Google Scholar * Grau-Bové, X. et al. Dynamics of genomic innovation in the unicellular ancestry of animals. _eLife_ 6, e26036 (2017). Article PubMed PubMed Central Google
Scholar * Albertin, C. B. & Ragsdale, C. W. More than one way to a central nervous system. _Nature_ 553, 34–36 (2018). * Arikkath, J. & Campbell, K. P. Auxiliary subunits: essential
components of the voltage-gated calcium channel complex. _Curr. Opin. Neurobiol._ 13, 298–307 (2003). Article CAS PubMed Google Scholar * Chen, R.-S., Deng, T.-C., Garcia, T., Sellers,
Z. M. & Best, P. M. Calcium channel Γ subunits: a functionally diverse protein family. _Cell Biochem. Biophys._ 47, 178–186 (2007). Article CAS PubMed Google Scholar * Guan, F. et
al. Evaluation of voltage-dependent calcium channel Γ gene families identified several novel potential susceptible genes to schizophrenia. _Sci. Rep._ 6, 24914 (2016). Article CAS PubMed
PubMed Central Google Scholar * Odekunle, E. A. & Elphick, M. R. Comparative and evolutionary physiology of casopressin/oxytocin-type neuropeptide signaling in invertebrates. _Front.
Endocrinol._ https://doi.org/10.3389/fendo.2020.00225 (2020). * Simakov, O. et al. Deeply conserved synteny resolves early events in vertebrate evolution. _Nat. Ecol. Evol._ 4, 820–830
(2020). * Deakin, W. J. et al. Increasing morphological disparity and decreasing optimality for jaw speed and strength during the radiation of jawed vertebrates. _Sci. Adv._ 8, eabl3644
(2022). Article PubMed PubMed Central Google Scholar * Donoghue, P. C. J. & Keating, J. N. Early vertebrate evolution. _Palaeontology_ 57, 879–893 (2014). Article Google Scholar *
Lawson, E. A. The effects of oxytocin on eating behaviour and metabolism in humans. _Nat. Rev. Endocrinol._ 13, 700–709 (2017). * Di Benedetto, A. et al. Osteoblast regulation via
ligand-activated nuclear trafficking of the oxytocin receptor. _Proc. Natl. Acad. Sci. USA_ 111, 16502–16507 (2014). * Colaianni, G. et al. The oxytocin-bone axis. _J. Neuroendocrinol._ 26,
53–57 (2014). Article CAS PubMed PubMed Central Google Scholar * Breuil, V., Trojani, M.-C. & Ez-Zoubir, A. Oxytocin and bone: review and perspectives. _Int. J. Mol. Sci._ 22, 8551
(2021). * Burini, R. C. & Leonard, W. R. The evolutionary roles of nutrition selection and dietary quality in the human brain size and encephalization. _Nutrire_ 43, 19 (2018). Article
Google Scholar * Lagman, D. et al. The vertebrate ancestral repertoire of visual opsins, transducin alpha subunits and oxytocin/vasopressin receptors was established by duplication of their
shared genomic region in the two rounds of early vertebrate genome duplications. _BMC Evol. Biol._ 13, 238 (2013). Article PubMed PubMed Central Google Scholar * Lefèvre, C. M., Sharp,
J. A. & Nicholas, K. R. Evolution of lactation: ancient origin and extreme adaptations of the lactation system. _Annu. Rev. Genomics Hum. Genet._ 11, 219–238 (2010). Article PubMed
Google Scholar * Brennan, A. J. et al. The tammar wallaby and fur seal: models to examine local control of lactation. _J. Dairy Sci._ 90, E66–E75 (2007). Article PubMed Google Scholar *
Mitsudomi, T. & Yatabe, Y. Epidermal growth factor receptor in relation to tumor development: EGFR gene and cancer. _FEBS J._ 277, 301–308 (2010). Article CAS PubMed Google Scholar *
Sigismund, S., Avanzato, D. & Lanzetti, L. Emerging functions of the EGFR in cancer. _Mol. Oncol._ 12, 3–20 (2018). Article PubMed Google Scholar * Kersten, C., Cameron, M. G.,
Laird, B. & MjÅland, S. Epidermal growth factor receptor-inhibition (EGFR-i) in the treatment of neuropathic pain. _BJA: Br. J. Anaesth._ 115, 761–767 (2015). Article CAS PubMed
Google Scholar * Schlessinger, J. Receptor tyrosine kinases: legacy of the first two decades. _Cold Spring Harb. Perspect. Biol._ 6, a008912–a008912 (2014). Article PubMed PubMed Central
Google Scholar * Neumann, I. D. & Van Den Burg, E. H. Oxytocin and vasopressin release and their receptor-mediated intracellular pathways that determine their behavioral effects. In
_Oxytocin, Vasopressin and Related Peptides in the Regulation of Behavior_ (eds Choleris, E. et al.) 1st edn, 27–43 (Cambridge University Press, 2013). * Krishnaswamy, N. et al. Epidermal
growth factor receptor is an obligatory intermediate for oxytocin-induced cyclooxygenase 2 expression and prostaglandin f2_α_ production in bovine endometrial epithelial cells.
_Endocrinology_ 151, 1367–1374 (2010). Article CAS PubMed Google Scholar * Gong, S. et al. Polymorphisms within RYR3 gene are associated with risk and age at onset of hypertension,
diabetes, and Alzheimer’s disease. _Am. J. Hypertension_ 31, 818–826 (2018). Article CAS Google Scholar * Shendre, A. et al. RYR3 gene variants in subclinical atherosclerosis among
HIV-infected women in the women’s interagency HIV study (WIHS). _Atherosclerosis_ 233, 666–672 (2014). Article CAS PubMed PubMed Central Google Scholar * Gutkowska, J. & Jankowski,
M. Oxytocin tevisited: Its role in cardiovascular regulation. _J. Neuroendocrinol._ 24, 599–608 (2012). Article CAS PubMed Google Scholar * Tom, N. & Assinder, S. J. Oxytocin in
health and disease. _Int. J. Biochem. Cell Biol._ 42, 202–205 (2010). Article CAS PubMed Google Scholar * Uvnäs-Moberg, K. et al. Maternal plasma levels of oxytocin during physiological
childbirth—a systematic review with implications for uterine contractions and central actions of oxytocin. _BMC Pregnancy Childbirth_ 19, 285 (2019). Article PubMed PubMed Central Google
Scholar * Lawson, E. A., Olszewski, P. K., Weller, A. & Blevins, J. E. The role of oxytocin in regulation of appetitive behaviour, body weight and glucose homeostasis. _J.
Neuroendocrinol._ 32, e12805 (2020). Article CAS PubMed Google Scholar * Chayer, C. & Freedman, M. Frontal lobe functions. _Curr. Neurol. Neurosci. Rep._ 1, 547–552 (2001). Article
CAS PubMed Google Scholar * du Boisgueheneuc, F. D. et al. Functions of the left superior frontal gyrus in humans: a lesion study. _Brain_ 129, 3315–3328 (2006). Article PubMed Google
Scholar * Ugur, H. C. et al. Arterial vascularization of primary motor cortex (precentral gyrus). _Surg. Neurol._ 64, S48–S52 (2005). Article PubMed Google Scholar * Bookheimer, S. Y.
Precentral gyrus. In _Encyclopedia of Autism Spectrum Disorders_ (ed. Volkmar, F. R.) 3617–3618 (Springer International Publishing, 2021). * Quintana, D. S. et al. Oxytocin pathway gene
networks in the human brain. _Nat. Commun._ 10, 668 (2019). Article CAS PubMed PubMed Central Google Scholar * Bastian, F. B. et al. The bgee suite: integrated curated expression atlas
and comparative transcriptomics in animals. _Nucleic Acids Res._ 49, D831–D847 (2021). Article CAS PubMed Google Scholar * Lonsdale, J. et al. The genotype-tissue expression (GTEx)
project. _Nat. Genet._ 45, 580–585 (2013). * Theofanopoulou, C. & Jarvis, E. D. Reply to: The case for standardizing gene nomenclature in vertebrates. _Nature_ 614, E33-E36 (2023). *
Bayramov, A. V., Ermakova, G. V., Kuchryavyy, A. V. & Zaraisky, A. G. Genome duplications as the basis of vertebrates’ evolutionary success. _Russian J. Dev. Biol._ 52, 141–163 (2021).
Article Google Scholar * Moriyama, Y. & Koshiba-Takeuchi, K. Significance of whole-genome duplications on the emergence of evolutionary novelties. _Brief. Funct. Genomics_ 17, 329–338
(2018). Article CAS PubMed Google Scholar * de Kovel, C. G. F., Lisgo, S. N., Fisher, S. E. & Francks, C. Subtle left-right asymmetry of gene expression profiles in embryonic and
foetal human brains. _Sci. Rep._ 8, 12606 (2018). * Embley, T. M. & Martin, W. Eukaryotic evolution, changes and challenges. _Nature_ 440, 623–630 (2006). Article CAS PubMed Google
Scholar * R Core Team R: A Language and Environment for Statistical Computing. _R Foundation for Statistical Computing_. https://www.R-project.org (2022). * RStudio Team. RStudio:
Integrated Development Environment for R. RStudio, PBC. http://www.rstudio.com (2022). * Wickham, H. et al. Welcome to the tidyverse. _J. Open Source Softw._ 4, 1686 (2019). Article Google
Scholar * Emms, D. M. & Kelly, S. OrthoFinder: solving fundamental biases in whole genome comparisons dramatically improves orthogroup inference accuracy. _Genome Biol._ 16, 157 (2015).
Article PubMed PubMed Central Google Scholar * Drost, H.-G., Gabel, A., Liu, J., Quint, M. & Grosse, I. myTAI: evolutionary transcriptomics with r. _Bioinformatics_ 34, 1589–1590
(2018). Article CAS PubMed Google Scholar * Adl, S. M. et al. The revised classification of eukaryotes. _J. Eukaryot. Microbiol._ 59, 429–514 (2012). Article PubMed PubMed Central
Google Scholar * Baker, D. W., Sardella, B., Rummer, J. L., Sackville, M. & Brauner, C. J. Hagfish: champions of CO2 tolerance question the origins of vertebrate gill function. _Sci.
Rep._ 5, 11182 (2015). Article CAS PubMed PubMed Central Google Scholar * Baldauf, S., Romeralo, M. & Carr, M. The evolutionary origin of animals and fungi. In _Evolution from the
Galapagos: Two Centuries after Darwin_, _Social and Ecological Interactions in the Galapagos Islands_ (eds Trueba, G. & Montúfar, C.) 73–106 (Springer, 2013). * Brownstein, C. D. &
Near, T. J. Phylogenetics and the cenozoic radiation of lampreys. _Curr. Biol._ 33, 397–404.e3 (2023). Article PubMed Google Scholar * Butterfield, N. J. Early evolution of the eukaryota.
_Palaeontology_ 58, 5–17 (2015). Article Google Scholar * Elsaid, R. et al. Hematopoiesis: a layered organization across chordate species. _Front. Cell and Dev. Biol._ 8, 1557 (2020). *
Evans, S. E. Evolution and phylogeny of amniotes. In _Evolution and Phylogeny of Amniotes, in Encyclopedia of Neuroscience_, (eds Binder, M. D. et al.) 1192–1194 (Springer, 2009). * Evans,
S. E. Evolution and phylogeny of vertebrates. In _Evolution and Phylogeny of Vertebrates, in Encyclopedia of Neuroscience_ (eds Binder, M. D. et al.) 1194–1197 (Springer, 2009). * Hallström,
B. M. & Janke, A. Mammalian evolution may not be strictly bifurcating. _Mol. Biol. Evol._ 27, 2804–2816 (2010). Article PubMed PubMed Central Google Scholar * Kapli, P. &
Telford, M. J. Topology-dependent asymmetry in systematic errors affects phylogenetic placement of Ctenophora and Xenacoelomorpha. _Sci. Adv._ 6, eabc5162 (2020). * Mulhair, P. O., McCarthy,
C. G. P., Siu-Ting, K., Creevey, C. J. & O’Connell, M. J. Filtering artifactual signal increases support for Xenacoelomorpha and ambulacraria sister relationship in the animal tree of
life. _Curr. Biol._ 32, 5180–5188.e3 (2022). Article PubMed Google Scholar * Nishihara, H., Maruyama, S. & Okada, N. Retroposon analysis and recent geological data suggest
near-simultaneous divergence of the three superorders of mammals. _Proc. Natl. Acad. Sci. US_A 106, 5235–5240 (2009). * Perelman, P. et al. A molecular phylogeny of living primates. _PLoS
Genet._ 7, e1001342 (2011). * Ruiz-Trillo, I., Roger, A. J., Burger, G., Gray, M. W. & Lang, B. F. A phylogenomic investigation into the origin of metazoa. _Mol. Biol. Evol._ 25, 664–672
(2008). Article CAS PubMed Google Scholar * Satoh, N. _Chordate Origins and Evolution: The Molecular Evolutionary Road to Vertebrate_s (Academic Press, 2016). * Senatore, A., Raiss, H.
& Le, P. Physiology and evolution of voltage-gated calcium channels in early diverging animal phyla: cnidaria, placozoa, porifera and ctenophora. _Front. Physiol_. 7, 227618 (2016). *
Tirosh, Y., Linial, I., Askenazi, M. & Linial, M. Short toxin-like proteins abound in cnidaria genomes. _Toxins_ 4, 1367–1384 (2012). * Upham, N. S., Esselstyn, J. A. & Jetz, W.
Inferring the mammal tree: species-level sets of phylogenies for questions in ecology, evolution, and conservation. _PLoS Biol._ 17, e3000494 (2019). * Yamamoto, K., Bloch, S. & Vernier,
P. New perspective on the regionalization of the anterior forebrain in osteichthyes. _Dev. Growth Differ._ 59, 175–187 (2017). Article PubMed Google Scholar * Zhou, X., Sun, F., Xu, S.,
Yang, G. & Li, M. The position of tree shrews in the mammalian tree: Comparing multi-gene analyses with phylogenomic results leaves monophyly of euarchonta doubtful. _Integr. Zool._ 10,
186–198 (2015). Article PubMed Google Scholar * dos Reis, M. et al. Uncertainty in the timing of origin of animals and the limits of precision in molecular timescales. _Curr. Biol._ 25,
2939–2950 (2015). Article PubMed PubMed Central Google Scholar * Edgar, R. C. MUSCLE: multiple sequence alignment with high accuracy and high throughput. _Nucleic Acids Res._ 32,
1792–1797 (2004). Article CAS PubMed PubMed Central Google Scholar * Suyama, M., Torrents, D. & Bork, P. PAL2NAL: robust conversion of protein sequence alignments into the
corresponding codon alignments. _Nucleic Acids Res._ 34, W609–W612 (2006). Article CAS PubMed PubMed Central Google Scholar * Silva, D. N. P. R. Phylogenomic and population genomic
insights on the evolutionary history of coffee leaf rust within the rust fungi. https://repositorio.ul.pt/handle/10451/35145?locale=en (2018). * Kumar, S. et al. TimeTree 5: an expanded
resource for species divergence times. _Mol. Biol. Evol._ 39, msac174 (2022). Article CAS PubMed PubMed Central Google Scholar * Kosakovsky Pond, S. L. et al. HyPhy 2.5—a customizable
platform for evolutionary hypothesis testing using phylogenies. _Mol. Biol. Evol._ 37, 295–299 (2020). Article PubMed Google Scholar * The GTEx Consortium et al. The genotype-tissue
expression (GTEx) pilot analysis: multitissue gene regulation in humans. _Science_ 348, 648–660 (2015). * Hawrylycz, M. J. et al. An anatomically comprehensive atlas of the adult human brain
transcriptome. _Nature_ 489, 391–399 (2012). Article CAS PubMed PubMed Central Google Scholar * Arnatkevičiūtė, A., Fulcher, B. D. & Fornito, A. A practical guide to linking
brain-wide gene expression and neuroimaging data. _NeuroImage_ 189, 353–367 (2019). Article PubMed Google Scholar * Desikan, R. S. et al. An automated labeling system for subdividing the
human cerebral cortex on MRI scans into gyral based regions of interest. _NeuroImage_ 31, 968–980 (2006). Article PubMed Google Scholar * Quackenbush, J. Microarray data normalization and
transformation. _Nat. Genet._ 32, 496–501 (2002). Article CAS PubMed Google Scholar * Fulcher, B. D., Little, M. A. & Jones, N. S. Highly comparative time-series analysis: the
empirical structure of time series and their methods. _J. R. Soc. Interface_ 10, 20130048 (2013). Article PubMed PubMed Central Google Scholar * Mowinckel, A. M. & Vidal-Piñeiro, D.
Visualization of brain statistics with r packages ggseg and ggseg3d. _Adv. Methods Pract. Psychol. Sci._ 3, 466–483 (2020). Article Google Scholar * Sartorius, A. M. et al. An evolutionary
timeline of the oxytocin signaling pathway. https://doi.org/10.31219/osf.io/42b8g (2022). * Gemmer, A. et al. Oxytocin receptors infuence the development and maintenance of social behavior
in zebrafsh (_Danio rerio_). _Sci. Rep._ 12, 4322 (2022). Article CAS PubMed PubMed Central Google Scholar Download references ACKNOWLEDGEMENTS This research was funded by the Research
Council of Norway (301767) and the Novo Nordisk Foundation (NNF16OC0019856). Figure 1 and the phylogenetic tree in Fig. 3 were created in Adobe Illustrator 2023. Some of the icons in Fig. 1
were adapted from Biorender.com. Figures 2 and 4a were created with Biorender.com. The methodological report for the AHBA expression data preprocessing steps was generated with the abagen
toolbox (https://github.com/rmarkello/abagen). AUTHOR INFORMATION AUTHORS AND AFFILIATIONS * Norwegian Centre for Mental Disorders Research (NORMENT), Institute of Clinical Medicine and
Division of Mental Health and Addiction, University of Oslo and Oslo University Hospital, Oslo, Norway Alina M. Sartorius, Jaroslav Rokicki, Francesco Bettella, Claudia Barth, Alexey
Shadrin, Nils Eiel Steen, Ole A. Andreassen, Dennis van der Meer, Lars T. Westlye & Daniel S. Quintana * Department of Psychology, University of Oslo, Oslo, Norway Alina M. Sartorius,
Ann-Marie G. de Lange, Lars T. Westlye & Daniel S. Quintana * Centre of Research and Education in Forensic Psychiatry, Oslo University Hospital, Oslo, Norway Jaroslav Rokicki * Faculty
of Chemistry, Biotechnology and Food Science, Norwegian University of Life Sciences, Ås, Norway Siri Birkeland * Natural History Museum, University of Oslo, Oslo, Norway Siri Birkeland *
Department of Medical Genetics, Division of Laboratory Medicine, Oslo University Hospital, Oslo, Norway Francesco Bettella * Department of Psychiatric Research, Diakonhjemmet Hospital, Oslo,
Norway Claudia Barth & Nils Eiel Steen * Department of Clinical Neurosciences, Lausanne University Hospital (CHUV) and University of Lausanne, Lausanne, Switzerland Ann-Marie G. de
Lange * Department of Psychiatry, University of Oxford, Oxford, UK Ann-Marie G. de Lange * Division of Mental Health and Addiction, Oslo University Hospital, Oslo, Norway Marit Haram *
Department of Mental Health and Suicide, Norwegian Institute of Public Health, Oslo, Norway Marit Haram * Department of Child Health and Development, Norwegian Institute of Public Health,
Oslo, Norway Adriano Winterton * Hector Institute for Artificial Intelligence in Psychiatry, Central Institute of Mental Health, Medical Faculty Mannheim, Heidelberg University, Mannheim,
Germany Emanuel Schwarz * Department of Psychiatry and Psychotherapy, Central Institute of Mental Health, Medical Faculty Mannheim, Heidelberg University, Mannheim, Germany Emanuel Schwarz *
SA MRC Unit on Risk & Resilience in Mental Disorders, Department of Psychiatry and Neuroscience Institute, University of Cape Town, Cape Town, South Africa Dan J. Stein * KG Jebsen
Centre for Neurodevelopmental Disorders, University of Oslo and Oslo University Hospital, Oslo, Norway Ole A. Andreassen, Lars T. Westlye & Daniel S. Quintana * School of Mental Health
and Neuroscience, Faculty of Health, Medicine and Life Sciences, Maastricht University, Maastricht, The Netherlands Dennis van der Meer * Rockefeller University, New York, NY, USA
Constantina Theofanopoulou * New York University, New York, NY, USA Constantina Theofanopoulou * NevSom, Department of Rare Disorders, Oslo University Hospital, Oslo, Norway Daniel S.
Quintana Authors * Alina M. Sartorius View author publications You can also search for this author inPubMed Google Scholar * Jaroslav Rokicki View author publications You can also search for
this author inPubMed Google Scholar * Siri Birkeland View author publications You can also search for this author inPubMed Google Scholar * Francesco Bettella View author publications You
can also search for this author inPubMed Google Scholar * Claudia Barth View author publications You can also search for this author inPubMed Google Scholar * Ann-Marie G. de Lange View
author publications You can also search for this author inPubMed Google Scholar * Marit Haram View author publications You can also search for this author inPubMed Google Scholar * Alexey
Shadrin View author publications You can also search for this author inPubMed Google Scholar * Adriano Winterton View author publications You can also search for this author inPubMed Google
Scholar * Nils Eiel Steen View author publications You can also search for this author inPubMed Google Scholar * Emanuel Schwarz View author publications You can also search for this author
inPubMed Google Scholar * Dan J. Stein View author publications You can also search for this author inPubMed Google Scholar * Ole A. Andreassen View author publications You can also search
for this author inPubMed Google Scholar * Dennis van der Meer View author publications You can also search for this author inPubMed Google Scholar * Lars T. Westlye View author publications
You can also search for this author inPubMed Google Scholar * Constantina Theofanopoulou View author publications You can also search for this author inPubMed Google Scholar * Daniel S.
Quintana View author publications You can also search for this author inPubMed Google Scholar CONTRIBUTIONS A.M.S. and D.S.Q. conceived and planned the study. A.M.S. analyzed the data, with
contributions from D.S.Q., C.T., J.R. and S.B. D.S.Q. and C.T. supervised the study. D.S.Q. provided funding for the study. A.M.S., D.S.Q., C.T., J.R., S.B., F.B., C.B., A.M.G.D.L., M.H.,
A.S., A.W., N.E.S., E.S., D.J.S., O.A.A., D.V.D.M. and L.T.W. contributed to the interpretation of the results. A.M.S. wrote the first and revised drafts of the manuscript, with D.S.Q.,
C.T., J.R., S.B., F.B., C.B., A.M.G.D.L., M.H., A.S., A.W., N.E.S., E.S., D.J.S., O.A.A., D.V.D.M. and L.T.W. contributing to the first and revised drafts of the manuscript. CORRESPONDING
AUTHORS Correspondence to Constantina Theofanopoulou or Daniel S. Quintana. ETHICS DECLARATIONS COMPETING INTERESTS M.H. has served as a speaker for Lundbeck, outside of the work presented
in the manuscript. The remaining authors declare no competing interests. PEER REVIEW PEER REVIEW INFORMATION _Communications Biology_ thanks Gökberk Alagöz and William Kenkel for their
contribution to the peer review of this work. Primary Handling Editors: Karli Montague-Cardoso and Benjamin Bessieres. A peer review file is available. ADDITIONAL INFORMATION PUBLISHER’S
NOTE Springer Nature remains neutral with regard to jurisdictional claims in published maps and institutional affiliations. SUPPLEMENTARY INFORMATION PEER REVIEW FILE SUPPLEMENTARY
INFORMATION DESCRIPTION OF SUPPLEMENTARY MATERIALS SUPPEMENTARY DATA 1-13 REPORTING SUMMARY RIGHTS AND PERMISSIONS OPEN ACCESS This article is licensed under a Creative Commons Attribution
4.0 International License, which permits use, sharing, adaptation, distribution and reproduction in any medium or format, as long as you give appropriate credit to the original author(s) and
the source, provide a link to the Creative Commons licence, and indicate if changes were made. The images or other third party material in this article are included in the article’s
Creative Commons licence, unless indicated otherwise in a credit line to the material. If material is not included in the article’s Creative Commons licence and your intended use is not
permitted by statutory regulation or exceeds the permitted use, you will need to obtain permission directly from the copyright holder. To view a copy of this licence, visit
http://creativecommons.org/licenses/by/4.0/. Reprints and permissions ABOUT THIS ARTICLE CITE THIS ARTICLE Sartorius, A.M., Rokicki, J., Birkeland, S. _et al._ An evolutionary timeline of
the oxytocin signaling pathway. _Commun Biol_ 7, 471 (2024). https://doi.org/10.1038/s42003-024-06094-9 Download citation * Received: 19 January 2023 * Accepted: 22 March 2024 * Published:
17 April 2024 * DOI: https://doi.org/10.1038/s42003-024-06094-9 SHARE THIS ARTICLE Anyone you share the following link with will be able to read this content: Get shareable link Sorry, a
shareable link is not currently available for this article. Copy to clipboard Provided by the Springer Nature SharedIt content-sharing initiative


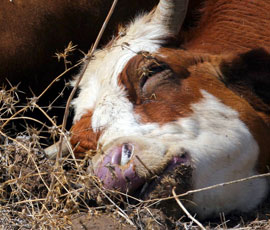
:max_bytes(150000):strip_icc():focal(319x0:321x2)/people_social_image-60e0c8af9eb14624a5b55f2c29dbe25b.png)