- Select a language for the TTS:
- UK English Female
- UK English Male
- US English Female
- US English Male
- Australian Female
- Australian Male
- Language selected: (auto detect) - EN
Play all audios:
ABSTRACT Ribonucleotides represent the most common non-canonical nucleotides found in eukaryotic genomes. The sources of chromosome-embedded ribonucleotides and the mechanisms by which
unrepaired rNMPs trigger genome instability and human pathologies are not fully understood. The available sequencing technologies only allow to indirectly deduce the genomic location of
rNMPs. Oxford Nanopore Technologies (ONT) may overcome such limitation, revealing the sites of rNMPs incorporation in genomic DNA directly from raw sequencing signals. We synthesized two
types of DNA molecules containing rNMPs at known or random positions and we developed data analysis pipelines for DNA-embedded ribonucleotides detection by ONT. We report that ONT can
identify all four ribonucleotides incorporated in DNA by capturing rNMPs-specific alterations in nucleotide alignment features, current intensity, and dwell time. We propose that ONT may be
successfully employed to directly map rNMPs in genomic DNA and we suggest a strategy to build an ad hoc basecaller to analyse native genomes. SIMILAR CONTENT BEING VIEWED BY OTHERS MAPPING
RIBONUCLEOTIDES EMBEDDED IN GENOMIC DNA TO SINGLE-NUCLEOTIDE RESOLUTION USING RIBOSE-MAP Article 04 June 2021 QUANTITATIVE PROFILING OF PSEUDOURIDYLATION DYNAMICS IN NATIVE RNAS WITH
NANOPORE SEQUENCING Article 13 May 2021 DETECTION OF GENETIC VARIATION AND BASE MODIFICATIONS AT BASE-PAIR RESOLUTION ON BOTH DNA AND RNA Article Open access 29 January 2021 INTRODUCTION Due
to the inherent chemical instability of RNA molecules, living organisms usually store their genetic information in DNA. DNA, indeed, lacks the reactive 2′-OH group of the ribose ring, which
can attack the sugar-phosphate backbone, generating breaks with genotoxic outcomes1. To guarantee the proper transmission of genetic information, cells must duplicate their DNA extremely
faithfully, avoiding mutations that can promote genome instability, leading to pathologies like cancer and neurodegenerative diseases2,3. Nevertheless, DNA integrity is constantly challenged
by a variety of exogenous and endogenous sources of damage and replication stress4,5,6. Ribonucleotides represent the most common non-canonical nucleotides found in the eukaryotic
genome7,8,9,10,11. Single rNMPs insertions in the genome primarily result from the ability of replicative DNA polymerases to duplicate chromosomal DNA, despite their high-fidelity
rates7,8,10,12. Other cellular processes potentially contributing to the incorporation of ribonucleotides in DNA are Okazaki fragments priming, R-loops formation and reparative DNA
synthesis13. The abundance and, to a certain degree, biassed distribution of ribonucleotides in the eukaryotic genome14,15,16 implies a biological relevance in specific cellular contexts.
For example, it was demonstrated that chromosome-embedded rNMPs provide sites of incision to initiate the mismatch repair (MMR) pathway in the leading strand of DNA17,18. Although having
physiological functions, ribonucleotides must be only transiently present in the genome and their prompt removal from DNA is fundamental to prevent negative consequences19,20,21. Unrepaired
ribonucleotides, especially in stretches of multiple insertions, can affect the structure of the DNA double helix22,23,24,25 and the assembly of nucleosomes26,27, they can hamper the
progression of the replicative DNA polymerases10,12,28 and they can favour mutagenesis and genomic instabilities29,30,31. To restore the correct DNA:DNA composition, cells are equipped with
ribonucleases H (RNase H1 and H2 in eukaryotes), endonucleolytic enzymes specialised in the removal of ribonucleotides from double-stranded (dsDNA) molecules32. RNase H2 mutations are
associated with Aicardi–Goutières syndrome (AGS)33, a rare autoinflammatory disorder that mainly affects the brain, and patient-derived cells show an accumulation of rNMPs in their
genome34,35,36. RNase H2 dysfunctions have also been linked to some cancers37,38,39,40,41 and to systemic lupus erythematosus (SLE)42. In order to fully unravel the mechanisms responsible
for embedding rNMPs in chromosomal DNA, to define the molecular details of ribonucleotide-induced genome instability and to determine the detrimental impact that DNA-embedded ribonucleotides
have on cells and patients, it is crucial to identify exactly how and where rNMPs are localised in the genome. Different high-throughput sequencing techniques have been developed to map
ribonucleotides at the genomic level with single-nucleotide resolution14,16,43,44,45,46,47. All these methods are based on the generation of breaks in genomic DNA by either enzymatic or
chemical digestion at the DNA-RNA junction. Hence, they share some limitations: they only allow to indirectly deduce the location of ribonucleotides in the genome, and they fail to
eventually discriminate between a single rNMP or a potentially more harmful stretch of consecutive rNMPs at a certain position13. Additionally, they were applied to
constitutively/permanently RNase H-deficient yeast strains, which accumulate thousands of ribonucleotides in the template DNA. As mentioned above, this can compromise the progression and
fidelity of the replicative DNA polymerases10,12,28, conceivably altering the real sites of rNMPs incorporation in a single round of DNA replication. Direct sequencing would be the best
approach to identify the location of single and multiple consecutive rNMPs in genomic DNA. In this context, the sequencing technologies developed by Oxford Nanopore Technologies (ONT) may
provide an appealing solution. Nanopore sequencing (extensively reviewed in48,49,50) is based on the use of engineered nanopores serving as biosensors embedded in a membrane of electrically
resistant synthetic polymers. A voltage bias of about 200 mV is usually clamped across the two sides of the membrane so that ions in an electrolytic solution flow freely through the pores,
generating an open current that is measured over time. A motor protein with helicase activity enables dsDNA or RNA:DNA duplexes to unwind and controls the translocation of single-stranded
DNA or RNA molecules through the nanopore from the negatively to the positively charged side at a translocation speed ranging from 260 to 520 bp/s for DNA strands. Each nucleotide crossing
the sensing region generates a characteristic disruption in the ion flow, detectable as a distinct change in the open current. Nucleotide identity is decoded using specific machine
learning-based algorithms, allowing real-time sequencing of single molecules. Nanopore sequencing sensitivity and versatility not only allow for the detection of the four canonical bases in
a nucleic acid filament, but it also permits the identification of base analogues51,52,53, nucleotide modifications as tiny as methylation52, and other structures like DNA adducts54,55 or
non-B DNA structures (as G-quadruplexes)56. These features make Nanopore sequencing the perfect candidate tool to attempt to directly identify and map rNMPs embedded in genomic DNA. In this
study, we assessed the feasibility of directly detecting rNMPs embedded in DNA molecules by Nanopore sequencing. We sequenced and analysed two types of rNMPs-containing synthetic DNA
molecules and we developed dedicated bioinformatic tools for their recognition. First, by using rNMPs-containing synthetic DNA primers complementary to the viral M13mp18 circular
single-stranded DNA (ssDNA), we generated linear dsDNA fragments containing single rNMPs at known positions. Second, taking advantage of a _Taq_-I614K DNA polymerase mutant produced in our
laboratory25,57, we obtained, from the same template, dsDNA molecules with randomly incorporated rNMPs. Nanopore libraries were constructed without prior chemical processing of the
ribonucleotides so that rNMPs were in their unmodified native state. In-house ad hoc data analysis pipelines based on the assessment of nucleotide alignment errors together with alterations
in reference-anchored current intensity values and dwell times were successfully elaborated and exploited, following the approach used for the detection of other nucleotide modifications by
the ONT sequencing platform58,59,60,61,62. Our results show an unexplored ability of Nanopore sequencing not only to identify the occurrence of all four ribonucleotides incorporated in DNA
molecules at known positions but also to recognise sites where rNMPs were randomly incorporated in DNA. These findings demonstrate that Nanopore sequencing may successfully be employed to
directly detect and map rNMPs embedded in native genomic DNA. Moreover, we identified the tools that may be exploited to build a specialised basecaller able to reveal the presence and exact
positions of rNMPs in chromosomal DNA. RESULTS CONSTRUCTION AND SEQUENCING OF SYNTHETIC DSDNA SUBSTRATES CONTAINING SINGLE RNMPS AT KNOWN POSITIONS To determine whether Nanopore sequencing
technologies are suitable for direct detection of ribonucleotides embedded in DNA, we needed special DNA substrates containing the four rNMPs at known positions so that, if a specific
sequencing signal was detected, it could be traced back to the presence of a specific rNMP. To this aim, we designed DNA oligonucleotides containing single rNMPs, complementary to the viral
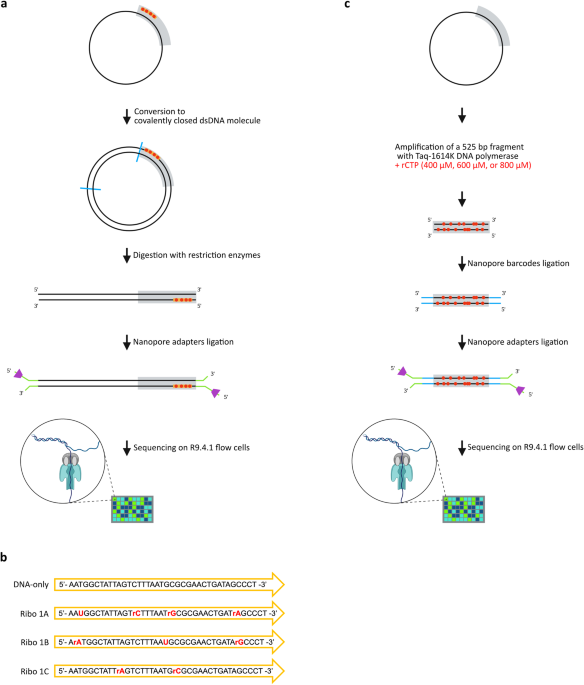
M13mp18 circular ssDNA, which we exploited as primers and templates, respectively, for in vitro extension reactions (Fig. 1a). In particular, we designed three distinct oligonucleotides
(Ribo1A, Ribo1B and Ribo1C) complementary to the same M13mp18 region, each containing different combinations of 2–4 single rNMPs embedded in different DNA sequence contexts, for a total of
nine single rNMP substitutions (Fig. 1b). These oligonucleotides were used to perform three independent in vitro extension reactions. The integrity of the generated M13mp18 circular dsDNA
was ensured by enzymatic treatment to obtain covalently closed molecules that were cleaved with a combination of restriction enzymes to produce linear dsDNA fragments (Fig. 1a). Such
synthetic dsDNA substrates containing rNMPs in the proximity of the 5’ end of the strand complementary to the original M13mp18 ssDNA template, were ligated to Nanopore adapters (Fig. 1a),
according to the standard Nanopore library construction protocol. The resulting “Ribo1A”, “Ribo1B” and “Ribo1C” libraries were sequenced on R9.4.1 flow cells (Fig. 1a). A “DNA-only” control
library of dsDNA fragments having the same sequence of the rNMPs-containing dsDNA fragments, but without rNMPs, was obtained with the same procedure, using an oligonucleotide entirely made
of dNMPs. A total amount of reads of 1.86E + 05 for “DNA-only”, 5.34E + 05 for “Ribo1A”, 5.75E + 06 for “Ribo1B” and 4.81E + 06 for “Ribo1C” passed the quality control checks and were
successfully basecalled by the Guppy basecaller. RIBONUCLEOTIDES EMBEDDED IN DNA AT KNOWN POSITIONS CAN BE IDENTIFIED BY BASECALLING ERRORS AND BY ALTERATIONS IN CURRENT INTENSITY AND DWELL
TIME PROFILES Current intensity signals generated by Nanopore sequencing are recorded in real-time with a sampling frequency of 4 kHz and provide information about the 5- to 6-mer sequence
context inside the pocket of the pore at a given time _t_58,61,63,64,65. These signals are stored as time-series data in fast5 files and need to be translated into nucleotide sequences to
allow downstream analysis, such as basic alignment to a reference sequence. This conversion is a very demanding computational problem, as the same nucleotide can be responsible for
completely different current intensity signals depending on the surrounding sequence context. The process of translating raw ONT data into nucleotide sequences is known as “basecalling”, and
it is presently achieved through sequence-to-sequence deep neural network (DNN) algorithms, even though it represents a continuously evolving research field. Since specific nucleotide
modifications in both DNA and RNA alter the raw signal generated by the sequencing machinery in a peculiar manner, they can be detected either by expanding the basecaller vocabulary with
additional nucleotides or by searching for systematic, reproducible and non-random “errors” in basecalling features and nucleotide alignment profiles, probably due to misinterpretations of
the signal deriving from a modified nucleotide that is not included in the basecaller training dataset52,58,63. Based on these assumptions, we initially attempted to recognise DNA-embedded
ribonucleotides from alterations in the nucleotide alignment profiles. As indicated in the workflow summary of Supplementary Fig. 1, the fast5 files generated during sequencing were
converted to fastQ files and aligned to the M13mp18 ssDNA reference sequence by minimap2. The generated BAM files were split into forward (+) strand sequences, directly mapping to the
M13mp18 ssDNA sequence, and reverse (−) strand sequences, mapping to the sequence complementary to the M13mp18 ssDNA and expected to contain the single rNMP substitutions in the primer
region. Nucleotide sequences were independently retrieved from “DNA-only”, “Ribo1A”, “Ribo1B” and “Ribo1C” runs. For the “DNA-only” run, 83.44% of the passed reads were successfully mapped
against the reference sequence by the aligner, of which 46.77% were mapped on the reverse (-) strand. An average of 91.72% of the passed reads of the three “Ribo” runs were aligned to the
reference sequence, of which an average of 49.96% mapped on the reverse (−) strand. The nucleotide alignment profiles of forward and reverse strands were separately obtained by plotting the
difference in the frequency of detection of A, C, G, T, deletions, and insertions measured at each M13mp18 genomic coordinate for each “Ribo” sample respect to “DNA-only” (Fig. 2).
Strikingly, when comparing each “Ribo” sample to the control, numerous, reproducible alterations resulting in a noisier alignment profile, were detected only on the reverse strand in
correspondence of the regions known to contain ribonucleotides (Fig. 2a–c, bottom graphs). On the other hand, no clear and reproducible alterations were detected on the forward strand (Fig.
2a–c, upper graphs). According to our experimental design, we expected four rNMP substitutions on the reverse strand of the “Ribo1A” sample (rA at position 4985, rG at position 4997, rC at
position 5004 and U at position 5015), three rNMP substitutions on the reverse strand of the “Ribo1B” sample (rG at position 4984, U at position 4998 and rA at position 5016), and two rNMP
substitutions on the reverse strand of the “Ribo1C” sample (rC at position 4996, and rA at position 5007) (Fig. 1b). At all these locations, indeed, we generally observed a decrease in the
frequency of detection of the predicted base, compensated by an increase in the rate of mismatches or indels (Fig. 2a–c, bottom graphs). Interestingly, similar perturbations were observed
not only in correspondence of the exact coordinates where ribonucleotides were included in the “Ribo” primers but also at some nearby positions (Fig. 2a–c, bottom graphs). This is consistent
with the fact that, as already pointed out, ONT electric signals, and thus basecalling features, depend on a stretch of 5–6 nucleotides passing through nanopore channels at a given time. A
single rNMP is, therefore, presumed to affect the signals generated by the surrounding nucleotides. The alterations due to the presence of rA, except for rA at position 5016, and rG were
generally more evident, while the ones induced by rC and U were less pronounced but still clearly visible (Fig. 2a–c, bottom graphs). In summary, we demonstrated that the presence of all
four rNMPs embedded in DNA caused an increased rate of basecalling errors not only in correspondence of the ribonucleotide itself but also in the immediately surrounding area. Many
computational tools available for the detection of base modifications by ONT use current intensity-based methods59,60,62,66,67. The starting point of every ONT sequencing experiment is,
indeed, constituted by the electric signals stored inside the fast5 files generated by the sequencer. When the final goal is to look for dissimilarities between different samples, as in our
case, an effective approach is to directly investigate the current intensity signals. Therefore, in addition to exploiting mistakes in basecalling and nucleotide alignment profiles, we opted
for comparing the current intensity profiles of each “Ribo” run to the one of the “DNA-only” control. A preliminary step for the analysis of current intensity profiles consists in anchoring
the electric events contained in the raw data files to the reference genome. As reported in the workflow summary of Supplementary Fig. 1, the BAM files generated by minimap2 were, thus,
used for “re-squiggling” the electric events against the M13mp18 reference sequence with the f5c eventalign software in order to compare the forward and reverse current distributions derived
from “Ribo1A”, “Ribo1B” and “Ribo1C” samples to the ones derived from the “DNA-only” sample. Comparably to what we found out from the analysis of nucleotide alignment profiles, numerous,
reproducible current intensity alterations were clearly visible only on the reverse strand around the regions containing the 9 single ribonucleotides (Fig. 3a–i, bottom graphs). In this
case, the strongest perturbations consisted in some positions of the “Ribo” samples showing bimodal distributions of the current, not noticeable for the corresponding positions of the
“DNA-only” control (Fig. 3a, b, e, f, h, i, bottom graphs, dotted, red circles). Again, these alterations were not limited to the genomic coordinate where each rNMP was included, but they
were extended to the surrounding nucleotides. As expected, no clear signs of alteration were detected on the forward strand (Fig. 3a–i, upper graphs) when comparing “Ribo1A”, “Ribo1B and
“Ribo1C” runs to the “DNA-only” control. The presence of all these electric signal changes only on the reverse strand confirmed that we were really observing perturbations caused by the
presence of ribonucleotides in DNA. Another strategy used for direct detection of nucleotide modifications by Nanopore sequencing is based on the analysis of the dwell time68,69, which is
the time a nucleotide spends inside the nanopore channel during sequencing. Dwell times were extracted by exploiting again the f5c eventalign software. The dwell time profiles of the forward
and reverse strands were separately obtained by calculating the difference between the mean dwell time value of each “Ribo” run and the mean dwell time value of the “DNA-only” run at each
position (Fig. 4). Dwell time profiles analysis of the reverse strand revealed clear alterations related to the presence of all rNMPs embedded in “Ribo1A”, “Ribo1B” and “Ribo1C” samples,
except for rA at position 5016 (Fig. 4, orange lines). By contrast, dwell time profiles of the forward strand showed no clear signs of alteration (Fig. 4, blue lines). Once more, these
perturbations were not restricted to the genomic coordinates corresponding to each rNMP, but they spanned on several upstream and downstream proximal positions. These findings are in
accordance with the observations previously made by analysing nucleotide alignment profiles and current intensities. Taken together, these results indicate that all four rNMPs embedded in
DNA can be successfully identified by Nanopore sequencing by searching for rNMPs-related errors in basecalling, perturbations in current distributions, and dwell time profiles.
RIBONUCLEOTIDES EMBEDDED IN DNA AT KNOWN POSITIONS CAN BE EFFICIENTLY RECOGNISED FROM A MIXTURE OF DNMPS- AND RNMPS-CONTAINING READS IN SILICO As mentioned in the introduction, single rNMPs
incorporations are mostly caused by replicative DNA polymerase misinsertions7,8,10,12. Then, a sample of genomic DNA would not always contain a rNMP at a certain position. We, therefore,
wondered whether the signal of a specific rNMP would still be recognisable in a sample that contained molecules with and without rNMPs at a given location. To investigate this, we performed
an in silico simulated washout assay (Fig. 5), in which we virtually mixed at different ratios a fixed total number of reads mapping on the reverse strand, randomly extracted from the
“DNA-only” control and the “Ribo1B” sample. For each ratio, we evaluated all the previously analysed features around the site of rG incorporation at position 4984. The analysis of nucleotide
alignment profiles of “Ribo1B” compared to “DNA-only” showed that, on the reverse strand, rG:4984 was responsible for very pronounced alterations at its genomic coordinate (Fig. 2b). The
analysis of basecalling features at position 4984, indeed, revealed that when reads uniquely derived from the “DNA-only” sample (0% of “Ribo1B” reads on total reads), the vast majority of
basecalled events corresponded to G (Fig. 5a). When “Ribo1B” derived reads represented 20% of the total number of reads, the frequency of detection of A and, to a lesser extent, T, deletions
and insertions was increased to a total error frequency higher than 10% (Fig. 5a). The frequency of detection of A, T, deletions and insertions kept rising together with the fraction of
“Ribo1B” derived reads. At 100% of “Ribo1B” derived reads, the total frequency of errors was higher than 40% (Fig. 5a). When looking at the current distributions of “Ribo1B” and “DNA-only”
on the reverse strand, we observed that rG:4984 generated a peculiar bimodal distribution of the current at position T:4980 (Fig. 3e). For this reason, we evaluated the effect of increasing
fractions of “Ribo1B” derived reads on the current intensity at this position. In accordance with what was described above, the effect of rG on the electric signals was detectable when
“Ribo1B” derived reads constituted 20% of the total of reads, and it increased with the fraction of “Ribo1B” derived reads (Fig. 5b). As already shown in Fig. 4e, reproducible dwell time
perturbations generated by rG:4984 were observed at coordinate A:4985, when comparing the reverse strands of “Ribo1B” and “DNA-only” runs. The impact of increasing percentages of “Ribo1B”
reads on dwell time at that position was consistent with the previous results: dwell time values went up along with the fraction of “Ribo1B” reads on the number of total reads (Fig. 5c).
Interestingly, in silico simulated washout experiments conducted on all the other rNMPs, excluded rA at position 5016 that did not show evident perturbations, led to similar alteration
patterns (Supplementary Fig. 2). In light of these observations, we can conclude that ONT allows the detection of DNA-embedded ribonucleotides even in a sample where, at a given position,
dNMP- and rNMP-containing reads are mixed. These analyses were performed in situations in which features were aggregated onto genomic positions. Different strategies tailored to increase the
granularity at a per-read level would strongly lower down the minimal percentage of ribonucleotides needed at a certain position for their successful detection, which would be relevant for
their visualisation inside genomic DNA samples. CONSTRUCTION AND SEQUENCING OF DSDNA SUBSTRATES CONTAINING RANDOMLY INCORPORATED RCMPS To assess the performance of ONT sequencing on
substrates more similar to genomic DNA samples, we generated dsDNA molecules containing rCMPs at unknown, random positions. We took advantage of a _Taq_-I614K DNA Polymerase mutant25,57 that
was produced in our laboratory and was extensively characterised for its ability to synthesise hundreds-of-bp-long, rCMP-containing DNA molecules in the presence of all four dNTPs and
rCTP25. _Taq_-I614K DNA Polymerase, although designed to incorporate rCTPs, cannot function in the absence of dCTP during the synthesis; the addition of dCTP to the reaction is thus
necessary. Therefore, the incorporation of rCMPs will be random25. Using the M13mp18 DNA as a template, we employed _Taq_-I614K to generate dsDNA fragments of 525 bp in the presence of 400,
600, or 800 μM rCTP. Such synthetic dsDNA substrates containing rCMPs in both strands were subsequently ligated to Nanopore barcodes and adapters (Fig. 1c). The resulting Nanopore “rC 400
μM”, “rC 600 μM” and “rC 800 μM” libraries, constituted by dsDNA fragments containing a different combination of rCMP incorporations at unknown positions on both strands, were finally
sequenced on R9.4.1 flow cells (Fig. 1c). The same procedure was followed in a PCR reaction in which _Taq_-I614K was not provided with rCMP, to obtain a “DNA-only” control library.
Importantly, the 525 bp fragments containing randomly incorporated rCMPs included the region used to produce the DNA fragments with ribonucleotides at known positions described previously.
In this way, the two types of rNMPs-containing synthetic dsDNA substrates shared the same sequence (Fig. 1a, c, grey boxes), which would allow us to eventually compare them in the following
analyses. RIBONUCLEOTIDES EMBEDDED IN DNA AT RANDOM POSITIONS INDUCE ALTERATIONS IN NUCLEOTIDE SEQUENCE ALIGNMENT, CURRENT INTENSITY AND DWELL TIME PROFILES As for the substrates containing
rNMPs at defined positions, we started by evaluating the effect of randomly incorporated rCMPs on nucleotide alignment profiles. Following the pipeline described, the BAM files generated by
minimap2 were split into forward (+) and reverse (-) strand sequences with respect to the M13mp18 reference. Nucleotide sequences were independently retrieved from “DNA-only”, “rC 400 μM”,
“rC 600 μM” and “rC 800 μM” runs, and the nucleotide alignment profiles of forward and reverse strands were separately obtained by plotting the difference in the frequency of detection of A,
C, G, T, deletions, and insertions measured at each genomic coordinate for each “rC” sample respect to the “DNA-only” control (Supplementary 3). Two different “DNA-only” technical
replicates (“DNA-only” and “DNA-only2”) were compared to evaluate the basal instrumental bias (Supplementary Fig. 3a), revealing a quite “flat” distribution of the signal, indicative of
consistency between the runs. When comparing “rC 400 μM” (Supplementary Fig. 3b), “rC 600 μM” (Supplementary Fig. 3c), and “rC 800 μM” (Supplementary Fig. 3d) to the internal “DNA-only”
control, instead, both the forward and reverse strands showed much noisier nucleotide alignment profiles across the entire length of the substrate, consistent with the possibility of rCMP
being incorporated at different positions in both strands with variable stoichiometry. To make the interpretation of results easier, basecalling features were plotted in graphs as deltas of
the total error detected (sum of mismatches and indels frequencies) at each position of each “rC” sample with respect to the “DNA-only” control on the forward (Fig. 6a–d, left panels) and
reverse (Fig. 6a–d, right panels) strands separately. In accordance with what is described above, the comparison between the two “DNA-only” replicates exhibited a pretty compact distribution
around zero of the values of delta total error on both strands (Fig. 6a). On the other hand, the values of delta total error for internal “DNA-only” vs “rC 400 μM”, “rC 600 μM” and “rC 800
μM” on both strands, generally oscillated above or below zero (Fig. 6b–d). We subsequently collected all the values obtained from the previous analysis in a box plot in which deltas were
grouped for comparison on each strand (Fig. 6e). This representation of the data allowed us to observe that the mean delta total error on both strands significantly increased together with
the increasing concentration of rC from 400 to 800 μM, used in the PCR step with _Taq_-I614K (Fig. 6e). The average percentage variations on both strands respect to the internal control were
+164.57%, +150.52% and +223.17% for “rC 400 μM”, “rC 600 μM” and “rC 800 μM”, respectively, with a Pearson correlation coefficient computed between rCMP concentrations and average delta
total error equal to 0.90 (_p_ = 0.002, divided by strand). Ionic current values were retrieved again by using the f5c eventalign software. Current variations were separately evaluated for
forward and reverse strands and represented in scatter plots, where each point corresponds to a genomic coordinate, whose value was calculated as the sum of the absolute values of the delta
between the current distributions of the “rC” sample respect to the “DNA-only” control (Fig. 7a–d). In line with what was observed for the basecalling features, in the scatter plot deriving
from the comparison between the two “DNA-only” replicates, dots are generally very close to zero for both strands (Fig. 7a), while in the scatter plots where “rC” samples were compared to
the “DNA-only” control, many points were located above the zero, reaching values between 0.6 and 0.8 (Fig. 7b–d). Data were also represented in a box plot grouped for comparison and strand,
where, especially for the reverse strand, a positive correlation between rC concentrations and current perturbations is clearly observable (Fig. 7e). The average percentage variations on
both strands respect to the internal control were +97.66%, +101.03% and +102.04% for “rC 400 μM”, “rC 600 μM” and “rC 800 μM”, respectively, with a high linear correlation between rCMP
concentrations and average current variations with _r_ = 0.82 (_p_ = 0.012, divided by strand). Dwell times were measured with the f5c eventalign software and dwell time variations were
computed similarly to what was described above. Dwell times were represented in line plots, where each position corresponding to a genomic coordinate shows the value of the sum of the
absolute values of the differences between the dwell time distributions of the “rC” sample with respect to the “DNA-only” control (Fig. 8a–d). Also in this case, the analysis of “DNA-only”
vs “DNA-only2” showed signal alterations close to zero in both strands (Fig. 8a), while each “rC” sample vs “DNA-only” showed an increase in the differences in dwell time distributions on
both the forward and reverse strands (Fig. 8b–d). The data collected in a box plot grouped for comparison and strand showed the same behaviour already described for the previous features,
confirming that also alterations in the dwell times increased together with the concentration of rC employed to obtain the substrates (Fig. 8e). The average percentage variations on both
strands respect to the internal control, in this case, were lower in magnitude, being +11.16%, +14.11% and +28.98% for “rC 400 μM”, “rC 600 μM” and “rC 800 μM”, respectively, with a
significant positive Pearson correlation coefficient equal to 0.87 (_p_ = 0.005, divided by strand). SYNTHETIC DSDNA SUBSTRATES CONTAINING RCMPS AT KNOWN POSITIONS OR RANDOMLY DISTRIBUTED
RCMPS SHOW SIMILARLY PERTURBED PROFILES The _Taq_-I614K DNA polymerase mutant is reported to incorporate 1 rCTP every 19 dCTPs in the presence of 800 μM rCTP25, which accounts for a
probability of about 5% to have a rCMP inserted at a certain position, a value that is far below the 20% level that we analysed in the in silico washout experiments. The analysis of “rC”
samples compared to the “DNA-only” control revealed a statistically significant magnified noise in basecalling features due to raw current signals perturbations, which strictly correlated
with the concentration of rCTP used for the step of PCR amplification with _Taq_-I614K (Figs. 6e, 7e and 8e), we tested the possibility to specifically recognise rCMP-related alterations at
a certain position, even in a sample with such low ribonucleotide levels. We started by looking for a strategy to identify anomalous reads. To do that, we verified the existence of outliers
along all the 525 reference positions by selecting all the genomic coordinates with ionic current or dwell time alterations outside a confidence interval of the mean ±2 std. dev. We then
computed a general overall “anomaly” index for both features as the sum of the differences of outlier data points. In this way, we detected strong anomalies in both ionic current scores,
with a fold-change for the computed indexes of +6.27, +7.22 and +5.32 for the “rC” runs with respect to the “DNA-only” run and dwell time scores with a fold-change of +0.94, +1.35 and +0.67
for “rC” samples compared to “DNA-only”. Even if these investigations indicated that the analysed features were non-uniformly affected, the presence of outliers generally appeared to be more
pronounced for “rC” runs than “DNA-only” runs. We thus tested a more sophisticated approach to discern anomalous reads at a per-read level, based on an unsupervised machine learning
algorithm, the Isolation Forest (iForest)70,71. Indeed, the identification of randomly incorporated rCMPs, which can be considered a relatively rare event occurring during the synthetic
activity of _Taq_-I614K, is exactly the type of task that could easily be tackled by using models suited for the detection of anomalies like the iForest, which has been recently exploited to
successfully address similar problems72. For this investigation, we focused our attention on the “rC 800 μM” run, which was most affected, and we selected all the reads that mapped on the
reverse strand and covered a ±5 nt-long region surrounding the M13mp18:4996 site, where rCMP was known to be incorporated in the previously analysed “Ribo1C” sample. In this context, a total
of about 427k chunks of reads were retrieved using a custom in-house Python script, leveraging the Pysam library (see the Methods section for further details). Each read was then encoded as
a 12 nt-long features vector representing the disposition of matches, mismatches and indels, as described in Fig. 9a. After the standardisation of these encoded chunks of reads, an iForest
object was fit and trained using a “contamination” parameter equal to 0.05, that is roughly the expected ratio of reads containing at least one rCMP on the region of interest, according to
our knowledge and expectation. We then applied the trained model to classify each read as an outlier (high anomaly score, probably carrying at least one rCMP) or an inlier (a read showing a
pattern shared with the majority of the other reads, with putatively no rCMPs). A wide proportion of the variance in our dataset was due to variations between inlier and outlier reads (Fig.
9b), suggesting that the presence of a relatively low quantity of rCMPs was sufficient to generate alterations in basecalling features, distinguishable from basal instrumental noise, even if
focusing on a per-read level resolution. To further confirm that the majority of the 21,310 detected outlier reads had at least one rCMP, we analysed basecalling and current features as we
did for the analysis of the “Ribo1C” sample, but stratifying the reads based on the iForest prediction. We found out that the patterns of the outlier reads almost recapitulated the ones
observed for the “Ribo1C” run at position 4996 corresponding to rC for all the investigated features (Fig. 9c–e), while the inlier reads appeared to be mainly unaffected. The existence of
some differences between these samples can be explained by the presence of two positions in close proximity to rC:4996 (C:4994 and C:4990), where rCMP might have been incorporated by the
_Taq_-I614K polymerase in some of the outlier reads, producing a more complex mixture of DNA strands. These results indicate that the iForest model trained on alignment errors can
efficiently select reads carrying rNMPs-related signals and they strongly suggest that similar machine learning models tailored for a per-read inference may be the most suitable strategy for
direct identification and mapping of ribonucleotides in genomic DNA by ONT. DISCUSSION More than 10,000 and more than 1,000,000 rNMPs have been estimated to be inserted into yeast and mouse
genomes, respectively, in each cell cycle, making ribonucleotides the most probable source of DNA alteration in eukaryotic cells73. Despite their physiological functions in specific
circumstances16,17, the presence of chromosome-embedded ribonucleotides erroneously left in DNA is generally detrimental, as they affect DNA replication10,12,28 and other processes, leading
to genome instability18,19,20,28,29,30. Different pathologies are linked to mutations in RNase H enzymes33,37,38,39,40,41,42, which are normally responsible for the removal of
ribonucleotides from DNA32. It thus becomes crucial to extensively comprehend the mechanisms leading to rNMPs incorporation in chromosomes and the molecular details of ribonucleotide-induced
genome instability in eukaryotic cells. To this extent, high-throughput sequencing techniques have already been developed to try to map ribonucleotides at the genomic level with
single-nucleotide resolution. These methods entail an enzymatic or chemical generation of breaks at DNA–RNA junctions in genomic DNA, only allowing to indirectly infer the position of
ribonucleotides in the genome. Moreover, they were applied to RNase H-depleted cells accumulating thousands of rNMPs in their template DNA, which may have altered the real sites of
incorporation during a single round of DNA replication. A tempting solution to these limitations may come from the direct sequencing strategies developed by Oxford Nanopore Technologies.
Nanopore sequencing has already been successfully exploited to recognise a series of modifications both in DNA and RNA. We therefore wondered whether Nanopore sequencing could be exploited
for direct identification of rNMPs embedded in DNA substrates. To evaluate the feasibility of this approach, we generated synthetic DNA molecules containing the four different
ribonucleotides at known positions so that if a specific sequencing signal change was observed, it could be linked to the occurrence of a specific rNMP. Thanks to the optimisation of
in-house ad hoc data analysis pipelines based on existing bioinformatic tools for ONT data collection and manipulation, we pioneered the direct detection of ribonucleotides embedded in DNA
molecules by Oxford Nanopore sequencing. We assessed this either by searching for systematic, consistent, non-random “errors” in nucleotide alignments and basecalling features or by directly
investigating current intensity signals and dwell times. In order to assess Nanopore sequencing performance on samples whose characteristics were more similar to real genomes, we
investigated its ability to recognise rNMPs in heterogeneous samples consisting of reads containing both rNMPs and dNMPs at a certain position. This was done initially by mixing in silico
different percentages of reads containing rNMPs and dNMPs at a known position and then by analysing DNA molecules where rCMPs were randomly incorporated by PCR. Exploiting the iForest
machine learning algorithm, we verified that, as for single rNMP substitutions at fixed positions, randomly incorporated rCMP was also inducing alterations in the same features previously
analysed. Bimodal distributions in the current intensity profiles, similar to the ones observed in our samples, were previously demonstrated to be an effective index for the quantification
of modified nucleotides in single reads in direct RNA sequencing datasets67. Even if our experimental set-up was still not comprehensive of all possible k-mers, our findings confirmed that
alterations due to rNMPs insertions in DNA can be efficiently detected by ONT, also in a sample with low ribonucleotide levels. Therefore, our data provide a robust proof of concept that
machine learning models customised to get per-read inferences may be the best approach to directly visualise and map ribonucleotides in genomic DNA through the Nanopore system. These results
encourage us to build a machine learning-based model for the detection of embedded rNMPs that will require the generation of an ad-hoc comprehensive training dataset covering all the
possible rNTPs incorporation contexts. Comparably to what was done in58, this approach will allow us to have a deeper understanding of the relevance of each used variable. Although
deoxyribonucleotides and ribonucleotides only differ in the presence of the OH group on the 2′ carbon of ribose, we showed that Nanopore sequencing can detect such small structural
dissimilarity. Finding a way to increase the difference between the two types of nucleotides would possibly make the identification of rNMPs incorporated in DNA even easier. The existence of
stretches of consecutive rNMPs embedded in genomic DNA is still ambiguous, although a growing body of evidence supports the idea that they may arise from aberrations in Okazaki fragments
priming or joining, R-loops formation or processing, and reparative DNA synthesis13. Unlike single rNMPs, which are relatively tolerated up to a certain level, rNMPs stretches were reported
to be more dangerous for cell viability, aggravating replicative DNA polymerase stalling, DNA double helix distortions, and genomic instability25,28. The identification of multiple genomic
rNMPs with the available technologies has proven to be extremely challenging. The enzymatic or chemical digestion at DNA-RNA junctions indispensable to the sequencing techniques elaborated
up to now, makes it impossible to eventually discern the presence of single or multiple rNMPs at given positions in the genome. Furthermore, the most common strategies to study RNA:DNA
hybrids rely on the S9.6 monoclonal antibody or on catalytically inactive RNase H1, which both indistinctly bind any type of hybrid present in the genome (R-loops, DNA replication primers,
hybrids at DSBs and eventually stretches of consecutive rNMPs embedded in DNA)13. ONT might provide not only a solution to directly map rNMPs in chromosomes but also to distinguish sites of
single and multiple ribonucleotide insertions in the genome. Demonstrating the occurrence of stretches of consecutive rNMPs embedded in eukaryotic genomes would help to clarify the
contribution of the two RNase H enzymes to the recognition and processing of the different RNA substrates found in DNA, as well as the unconventional ability to synthesise multiple rNMPs
insertions that certain DNA polymerases, like the Y-family polymerase η, seem to possess at least in some peculiar conditions74,75,76,77. This would ultimately contribute to shed light on
the molecular details linking ribonucleotides, replication stress, genome instability and severe human pathologies. Naturally, the investigation of multiple ribonucleotides in DNA by
Nanopore sequencing will require extra experimental and bioinformatic strategies. The raw sequencing signals deriving from multiple ribonucleotides might require a greater effort to be
decoded, due to several overlapping alterations coming from each single rNMP in the stretch. In conclusion, our work provides the first evidence that the Oxford Nanopore sequencing platform
can directly distinguish ribonucleotides included in DNA molecules and the proof of concept that Nanopore sequencing may successfully be employed to directly detect and map rNMPs embedded in
genomic DNA, giving further proof of the potentialities of third-generation sequencing platforms. Moreover, the basecalling alterations we detect due to embedded rNMPs may explain at least
some of the basecalling errors that have been reported in ONT genomic sequencing efforts. Our work may thus contribute to helping the further development of ONT approaches. METHODS
PREPARATION OF SYNTHETIC DSDNA SUBSTRATES CONTAINING RNMPS AT KNOWN POSITIONS Each in vitro extension reaction was carried out with 1 μg of M13mp18 ssDNA (New England Biolabs, catalogue #
N4040) and about 25 nM of complementary oligonucleotide, exploiting the Phusion™ High-Fidelity DNA Polymerase (ThermoFisher Scientific, catalogue # F530) in the presence of 200 μM of each
dNTP in a final volume of 50 μL. Oligos were annealed to the template at 60 °C for 30 s and then extended by the polymerase at 72 °C for 10 min. “Ribo1A” samples were obtained starting from
oligo 5′-Phosphate-AAU GGC TAT TAG TrCT TTA ATrG CGC GAA CTG ATrA GCC CT-3′, “Ribo1B” samples were obtained starting from oligo 5′-Phosphate-ArAT GGC TAT TAG TCT TTA AUG CGC GAA CTG ATA rGCC
CT-3′, “Ribo1C” samples were obtained starting from oligo 5′-Phosphate-AAT GGC TAT TrAG TCT TTA ATG rCGC GAA CTG ATA GCC CT-3′, containing single rNMPs (underlined NMPs) at different
positions, while “DNA-only” samples were obtained starting from oligo 5′-Phosphate-AAT GGC TAT TAG TCT TTA ATG CGC GAA CTG ATA GCC CT-3′ that does not contain rNMPs. All oligos were
complementary to the M13mp18 sequence from position 4980 to 5017. Extension reaction products were then treated with the NEBNext® FFPE DNA Repair Mix (New England Biolabs, catalogue #
M6630), assembling the reaction according to the “Protocol for use with Other User-supplied Library Construction Reagents” reported on the product webpage, adding 3U of T4 DNA Polymerase
(New England Biolabs catalogue # M0203), and incubated at 20 °C for 3 h. The covalently closed circular dsDNA molecules obtained were O/N digested at 25 °C with MscI (New England Biolabs
catalogue # R0534) and SwaI (New England Biolabs catalogue # R0604) restriction enzymes in NEB buffer 3.1. Digestion products were run on a 0.8% agarose gel, and only DNA fragments of 5545
bp were extracted from the gel and purified with the NucleoSpin Gel and PCR Clean-up kit from Macherey-Nagel, according to the manufacturer’s instructions. PREPARATION OF DSDNA SUBSTRATES
CONTAINING RANDOMLY INCORPORATED RNMPS A fragment of 2026 bp was PCR-amplified from the M13mp18 ssDNA (New England Biolabs, catalogue # N4040) with forward DNA primer 5′-GAA GAA CTC AAA CTA
TCG GC-3’ and reverse DNA primer 5′-GAT ATT AGC GCT CAA TTA CC-3’, by using the Phusion™ High-Fidelity DNA Polymerase (ThermoFisher Scientific, catalogue # F530) according to manufacturer’s
instructions, and employed as template to PCR-amplify a fragment of 525 bp with forward DNA primer 5′-Phosphate-CCT GAA AGC GTA AGA ATA CG-3′ and reverse DNA primer 5′-Phosphate-GCC ATC ATC
TGA TAA TCA GG-3′, by using the mutant _Taq_-I614K DNA Polymerase (GeneSpin Srl, www.genespin.com). The resulting 525 bp amplicon maps on the M13mp18 reference sequence at position
4533-5057, so it includes the region of the “Ribo” and “DNA-only” oligos. Reactions were carried out as described25 in the presence of 200 μM of each dNTP for “DNA-only” samples, and in the
presence of 200 μM dATP, dGTP, and dTTP, 100 μM dCTP, and 400 μM or 600 μM, or 800 μM rCTP for “rC” samples, in a final volume of 50 μL × 48 reactions. Oligos were annealed to the template
at 50 °C for 30 s and then extended by the polymerase at 72 °C for 2 min for 45 cycles. PCR products were pooled together, concentrated by precipitation in absolute ethanol with 3 M sodium
acetate at pH 5.2, run on a 0.8% agarose gel, extracted from the gel, and purified with the NucleoSpin Gel and PCR Clean-up kit from Macherey–Nagel, according to manufacturer’s instructions.
DIRECT DNA LIBRARY PREPARATION AND SEQUENCING 1 μg of “Ribo1A”, “Ribo1B”, “Ribo1C” or “DNA-only” dsDNA fragments obtained as described in “Preparation of synthetic dsDNA substrates
containing rNMPs at known positions” were used for Nanopore libraries preparation with the SQK-LSK109 ligation sequencing kit, following the protocol “Ligation sequencing gDNA - Version:
GDE_9063_v109_revAP_25May2022. Each library was loaded on a single R9.4.1 MinION flow cell using the EXP-FLP002 Flow Cell Priming Kit and a MinION Mk1B or GridION device. Two independent
libraries for each of the above samples were sequenced and analysed. In total, 250 ng of “rC 400 μM”, “rC 600 μM”, “rC 800 μM” and “DNA-only” dsDNA fragments, obtained as described in
“Preparation of synthetic dsDNA substrates containing randomly incorporated rNMPs”, were used for preparation of a single barcoded Nanopore library with the EXP-NBD104 native barcoding kit
and the SQK-LSK109 ligation sequencing kit, following the protocol “Ligation sequencing amplicons—native barcoding—Version: NBA_9093_v109_revO_12Nov2019—Last update: 10/03/2023”. The
barcoded library was loaded on two different MinION R9.4.1 flow cells using the EXP-FLP002 Flow Cell Priming Kit and a GridION device. BASECALLING PROCEDURES AND MAPPING Reads were locally
basecalled by Guppy 5.0.1 with GPU acceleration (NVIDIA A100-40GB) using the dna_r9.4.1_450bps_hac.cfg configuration file. The M13mp18 reference sequence was downloaded from the New England
Biolabs Inc. website, and it is available at the url:
https://international.neb.com/-/media/nebus/page-images/tools-and-resources/interactive-tools/dna-sequences-and-maps/text-documents/m13mp18fsa.txt?rev=187bdc8b92314f13ba46d107b5b5553d&hash=6F212E5A79D842E6A911DF43AFAA9C07.
The fastQ files containing reads passing the Guppy quality control check, generated in the basecalling step, were merged into a single fastQ file per run and then mapped to the reference
sequence by minimap2 v.2.2278, using standard presets and setting the -ax flag to the recommended value “map-ont”. Samtools 1.13 was used to sort, index, and filter the produced BAM files,
which were then split into forward (+) and reverse (−) strand-related files using the SAM flag 16 since ribonucleotides were expected only on the reverse strand for the “Ribo1A”, “Ribo1B”
and “Ribo1C” runs with single rNMPs. The same strategy was also used for the analysis of randomly incorporated rNMPs. The subsequent analysis workflow was separated into two branches
conducted for both the strands of each run. The first branch aimed at retrieving and analysing the differences between “DNA-only” and “Ribo1” runs at the level of the basecalling features
and nucleotide alignment profiles, the second one was focused on ionic current intensities aligned back to the reference and on related dwell times. A general overview of the workflow is
schematized in Supplementary Fig. 1. For in silico simulated washout experiments, a fixed total amount of 100k reads mapping on the reverse strand were retrieved from whole BAM files from
both “DNA-only” and “Ribo1A” (or “Ribo1B”, or “Ribo1C”) runs and mixed with increasing different proportions of reads containing single rNMPs. The proportions “DNA-only”:“Ribo” reads in
these mixed and filtered BAM files used were 100:0, 80:20, 60:40, 40:60, 20:80 and 0:100. The generated BAM files were then deeply analysed at the level of all the features of interest. All
data analysis procedures were run on HPC-HTC clusters equipped with up to 40 cores, 256 GB of RAM, and several TB of disk space. ALIGNMENT PROFILES ANALYSIS Thanks to our in-house Python
scripts, the split BAM files on forward (+) and reverse (−) strands were further investigated to retrieve their alignment profiles (basecalling features) using the Pysam software v.0.19.0
https://github.com/pysam-developers/pysam79,80,81, which leverages on the htslib C-API and the pileup engine. For each reference site where a ribonucleotide was expected, an interval
covering the entire primer region (or the whole 525 bp-long PCR product for random rNMPs) was inspected and the frequencies of the aligned A, T, C, G, insertions, and deletions were
retrieved. These alignment profiles from forward and reverse BAM files were analysed separately and, for the sake of clarity, alignment profiles were shown in a simplified version (Fig. 2
and S3), as differences in frequencies for each analysed feature between the two conditions/runs “DNA-only” and “Ribo”. For the in silico simulated washout experiments, mixed BAM files with
increasing ratios of “Ribo” reads were investigated with the same approach focusing on the sites of interest in search for alteration due to rNMPs incorporation. For the evaluation of
basecalling features alterations due to the random incorporations of rCMPs, alignment profiles were retrieved analogously and summarised as total error for every genomic position computing
the sum of frequencies of unexpected aligned bases, deletions, and insertions, related to each run. So, also in this case, the difference between the total error frequencies computed on the
“DNA-only” control run and the “rC” run was calculated. All data analysis procedures were run on HPC-HTC clusters equipped with up to 40 cores, 256 GB of RAM and several TB of disk space.
All in-house scripts used are publicly available at https://github.com/F0nz0/nanopore-ribos. CURRENT PROFILES ANALYSIS For the second workflow branch, related to ionic current intensities
and dwell times analysis, the f5c software v.0.759,82 was exploited. The f5c software uses raw signals stored in fast5 files, together with BAM files, a reference genome sequence, and
basecalled reads inside fastQ files, to detect events occurring in raw signals related to nucleotides movements inside the pore and to align these back to the reference, accordingly. Since
outputs were generally very large, the extraction of events was limited to the same intervals analysed for the basecalling features via the setting of the -w flag of f5c. This allowed us to
retrieve information about raw signal levels and their mapping positions with respect to each reference coordinate for a given interval. In-house Python scripts were written to pre-process
these f5c events tables. In particular, following the indexing procedure required on fast5 files, the first step was to split the f5c table into two tables of events mapping either on the
reverse or on the forward strand. Then, unrecognised events were filtered out and all the remaining events mapping to the same genomic position and thus belonging to the same read were
collapsed together, calculating the mean current intensity value and the total dwell time. Analogously to what was done for the basecalling features, forward and reverse strand related
collapsed f5c tables were used to plot and analyse ionic current intensities along with dwell times on regions around the expected ribonucleotide incorporation sites to compare “DNA-only”
and “Ribo” runs. Dwell times analysis was shown as the difference of dwell times means between the two conditions (Figs. 4 and 9) when comparing control and “Ribo1” runs or as actual values
(Figs. 5 and Supplementary Fig. 2) varying in function of the ratio of “Ribo1” reads used for the in silico simulated washout analysis. For the _Taq_-I614 K-related set of experiments, where
the incorporation of rCMPs was expected to be random and with a varying and low stoichiometry, a different approach was used to allow the difference in currents and dwell times to emerge
from the basal level of noise. F5c eventalign tables for the region of interest were retrieved and pre-processed for forward and reverse strands using the same strategy and, for each genomic
position and for both ionic currents and dwell times, the sum of the absolute values of the differences between the “DNA-only” control and “rC” runs was computed and shown on the whole 525
bp-long PCR products or in an aggregated manner, stratifying per comparison and strand. All data analysis procedures were run on HPC-HTC clusters equipped with up to 40 cores, 256 GB of RAM
and several TB of disk space. All in-house scripts used here are publicly available at https://github.com/F0nz0/nanopore-ribos. IFOREST CLUSTERING ON THE “RC 800 ΜM” RUN For the clustering
analysis, all the reads produced by sequencing “rC 800 μM—_Taq_-I614K” DNA strands mapping on a ±5 nt-long region overlapping the site M13mp18:4996 were considered. Using custom in-house
Python scripts and functions, basecalling features for the iForest model were extracted from the related BAM file leveraging on the Pysam (v. 0.18) module. Aligned reads were traversed
individually, and information about mismatches and indels in the surrounding interval of ±5 bases were collected and encoded using a custom vectorisation strategy (consisting of a 12-long
vector), as shown in Fig. 9a, similarly to what was done for other related tasks72. More in detail, vectorized basecalling features were encoded for each read and for each position within
the explored interval as follows: +1 for matched bases, −1 for mismatched bases and 0 for deletions, while the last integer of the vector was the insertions count. Encoded basecalling
features vectors were standardised and used to fit an iForest model via the scikit-learn package and the use of the _sklearn.ensemble.IsolationForest_ class, setting the maximum number of
available threads (32 for our machine setup). The contamination parameter for this type of unsupervised machine learning model is of pivotal importance since it sets a threshold on the
anomaly score used to classify observations as anomalies-outliers or normal ones. Based on the available literature25, we set the contamination parameter to 0.05 to train the model with a
number of estimators equal to 200 and select all the samples with a bootstrap strategy to build individual trees. By means of our trained model, each basecalling features vector was
classified as an outlier or inlier and visualised via principal component analysis (PCA) focusing on the first three principal components, subsampling a subset of inlier reads equal to the
number of predicted outliers, only for visualisation purposes. In addition to PCA visualisation, the iForest predictions were used to analyse more deeply basecalling, ionic currents, and
dwell-times features, separating inliers from the outliers and comparing these two groups against the “Ribo1C” reads, looking for similar patterns. STATISTICS AND REPRODUCIBILITY For what
concerns substrates with ribonucleotides at known positions, a single “DNA-only” control library was prepared and sequenced, while two different libraries were independently prepared and
sequenced for “Ribo1A”, “Ribo1B” and “Ribo1C”. The two “Ribo” replicates gave reproducible and consistent results when compared to the “DNA-only” run. In order to avoid redundancy, only
results related to the comparisons between “DNA-only” and the first “Ribo” replicate were shown in Figures. Regarding substrates with randomly incorporated rCMPs, a single barcoded library
was prepared and sequenced twice on two different flow cells. For each flow cell, “rC” samples were compared to the internal “DNA-only” control, giving almost identical results. As shown in
Figs. 6–8, we also compared the two DNA-only technical replicates to estimate instrumental sources of variation. In order to avoid redundancy, only results related to the internal
comparisons between “DNA-only” and the “rC” samples loaded on the first flow cell were shown in the Figs. When indicated in Fig. caption, statistical analysis via two-way ANOVA was performed
using the Python3 stats models library. All data are available from the authors upon reasonable request. REPORTING SUMMARY Further information on research design is available in the Nature
Portfolio Reporting Summary linked to this article. DATA AVAILABILITY FASTQ and FAST5 files can be retrieved from the SRA database at the BioProject with accession code PRJNA928310 or at the
URL: https://www.ncbi.nlm.nih.gov/bioproject/PRJNA928310. The list of all SRA accession numbers, their corresponding URLs and the numeric sources of all data are available within the file
Supplementary Data 1. All other data are available from the authors upon request. CODE AVAILABILITY All source code and in-house scripts used in this research work are publicly available at
the GitHub repository and at https://doi.org/10.5281/zenodo.7709403. REFERENCES * Li, Y. & Breaker, R. R. Kinetics of RNA degradation by specific base catalysis of transesterification
involving the 2γ-hydroxyl group. _J. Am. Chem. Soc._ 121, 5364–5372 (1999). Article CAS Google Scholar * Yao, Y. & Dai, W. Genomic instability and cancer. _J. Carcinog. Mutagen._ 5,
1–3 (2014). CAS Google Scholar * Yurov, Y. B., Vorsanova, S. G. & Iourov, I. Y. Chromosome instability in the neurodegenerating brain. _Front. Genet._ 10, 892 (2019). Article CAS
PubMed PubMed Central Google Scholar * Hoeijmakers, J. H. J. Genome maintenance mechanisms for preventing cancer. _Nature_ 411, 366–374 (2001). Article CAS PubMed Google Scholar *
Aguilera, A. & Gómez-González, B. Genome instability: a mechanistic view of its causes and consequences. _Nat. Rev. Genet._ 9, 204–217 (2008). Article CAS PubMed Google Scholar *
Sertic, S. et al. Non-canonical CRL4A/4BCDT2 interacts with RAD18 to modulate post replication repair and cell survival. _PLoS ONE_ 8, e60000 (2013). Article CAS PubMed PubMed Central
Google Scholar * McElhinny, S. A. N. et al. Abundant ribonucleotide incorporation into DNA by yeast replicative polymerases. _Proc. Natl Acad. Sci. USA_ 107, 4949–4954 (2010). Article
Google Scholar * Sparks, J. L. et al. RNase H2-initiated ribonucleotide excision repair. _Mol. Cell_ 47, 980–986 (2012). Article CAS PubMed PubMed Central Google Scholar * Reijns, M.
A. M. et al. Enzymatic removal of ribonucleotides from DNA is essential for mammalian genome integrity and development. _Cell_ 149, 1008–1022 (2012). Article CAS PubMed PubMed Central
Google Scholar * Clausen, A. R. et al. Ribonucleotide incorporation, proofreading and bypass by human DNA polymerase δ. _DNA Repair_ 12, 121–127 (2013). Article CAS PubMed Google Scholar
* Williams, J. S., Lujan, S. A. & Kunkel, T. A. Processing ribonucleotides incorporated during eukaryotic DNA replication. _Nat. Rev. Mol. Cell Biol._ 17, 350–363 (2016). Article CAS
PubMed PubMed Central Google Scholar * Clausen, A. R. et al. Structure-function analysis of ribonucleotide bypass by B family DNA replicases. _Proc. Natl Acad. Sci. USA_ 110,
16802–16807 (2013). Article CAS PubMed PubMed Central Google Scholar * Nava, G. M. et al. One, no one, and one hundred thousand: the many forms of ribonucleotides in DNA. _Int. J. Mol.
Sci._ 21, 1–23 (2020). Article Google Scholar * Koh, K. D., Balachander, S., Hesselberth, J. R. & Storici, F. Ribose-seq: global mapping of ribonucleotides embedded in genomic DNA.
_Nat. Methods_ 12, 251–257 (2015). Article CAS PubMed PubMed Central Google Scholar * Balachander, S. et al. Ribonucleotide incorporation in yeast genomic DNA shows preference for
cytosine and guanosine preceded by deoxyadenosine. _Nat. Commun._ 11, 1–14 (2020). Article Google Scholar * Iida, T., Iida, N., Sese, J. & Kobayashi, T. Evaluation of repair activity
by quantification of ribonucleotides in the genome. _Genes Cells_ 26, 555–569 (2021). Article CAS PubMed PubMed Central Google Scholar * Ghodgaonkar, M. M. et al. Ribonucleotides
misincorporated into DNA act as strand-discrimination signals in eukaryotic mismatch repair. _Mol. Cell_ 50, 323–332 (2013). Article CAS PubMed PubMed Central Google Scholar * Lujan, S.
A. et al. Ribonucleotides are signals for mismatch repair of leading-strand replication errors. _Mol. Cell_ 50, 437–443 (2013). Article CAS PubMed PubMed Central Google Scholar *
Potenski, C. J. & Klein, H. L. How the misincorporation of ribonucleotides into genomic DNA can be both harmful and helpful to cells. _Nucleic Acids Res._ 42, 10226–10234 (2014). Article
CAS PubMed PubMed Central Google Scholar * Williams, J. S. & Kunkel, T. A. Ribonucleotides in DNA: origins, repair and consequences. _DNA Repair_ 19, 27–37 (2014). Article CAS
PubMed PubMed Central Google Scholar * Kellner, V. & Luke, B. Molecular and physiological consequences of faulty eukaryotic ribonucleotide excision repair. _EMBO J._ 39, e102309
(2020). Article CAS PubMed Google Scholar * Jaishree, T. N., Wang, A. H. J., van der Marel, G. A. & van Boom, J. H. Structural Influence of RNA incorporation in DNA: quantitative
nuclear magnetic resonance refinement of d(CG)r(CG)d(CG) and d(CG)r(C)d(TAGCG). _Biochemistry_ 32, 4903–4911 (1993). Article CAS PubMed Google Scholar * Egli, M., Usman, N. & Rich,
A. Conformational influence of the ribose 2’-hydroxyl group: crystal structures of DNA-RNA chimeric duplexes. _Biochemistry_ 32, 3221–3237 (1993). Article CAS PubMed Google Scholar *
Derose, E. F. et al. Solution structure of the Dickerson DNA dodecamer containing a single ribonucleotide. _Biochemistry_ 51, 2407–2416 (2012). Article CAS PubMed Google Scholar *
Meroni, A. et al. The incorporation of ribonucleotides induces structural and conformational changes in DNA. _Biophys. J._ 113, 1373–1382 (2017). Article CAS PubMed PubMed Central Google
Scholar * Hovatter, K. R. & Martinson, H. G. Ribonucleotide-induced helical alteration in DNA prevents nucleosome formation. _Proc. Natl Acad. Sci. USA_ 84, 1162–1166 (1987). Article
CAS PubMed PubMed Central Google Scholar * Fu, I., Smith, D. J. & Broyde, S. Rotational and translational positions determine the structural and dynamic impact of a single
ribonucleotide incorporated in the nucleosome. _DNA Repair_ 73, 155–163 (2019). Article CAS PubMed Google Scholar * Lazzaro, F. et al. RNase H and postreplication repair protect cells
from ribonucleotides incorporated in DNA. _Mol. Cell_ 45, 99–110 (2012). Article CAS PubMed PubMed Central Google Scholar * Kim, N. et al. Mutagenic processing of ribonucleotides in DNA
by yeast topoisomerase I. _Science_ 332, 1561–1564 (2011). Article CAS PubMed PubMed Central Google Scholar * Conover, H. N. et al. Stimulation of chromosomal rearrangements by
ribonucleotides. _Genetics_ 201, 951–961 (2015). Article CAS PubMed PubMed Central Google Scholar * Klein, H. L. Genome instabilities arising from ribonucleotides in DNA. _DNA Repair_
56, 26–32 (2017). Article CAS PubMed PubMed Central Google Scholar * Cerritelli, S. M. & Crouch, R. J. Ribonuclease H: the enzymes in eukaryotes. _FEBS J._ 276, 1494–1505 (2009).
Article CAS PubMed Google Scholar * Crow, Y. J. et al. Mutations in genes encoding ribonuclease H2 subunits cause Aicardi-Goutières syndrome and mimic congenital viral brain infection.
_Nat. Genet._ 38, 910–916 (2006). Article CAS PubMed Google Scholar * Pizzi, S. et al. Reduction of hRNase H2 activity in Aicardi-Goutières syndrome cells leads to replication stress and
genome instability. _Hum. Mol. Genet._ 24, 649–658 (2015). Article CAS PubMed Google Scholar * Kind, B. et al. Altered spatio-temporal dynamics of RNase H2 complex assembly at
replication and repair sites in Aicardi-Goutiéres syndrome. _Hum. Mol. Genet._ 23, 5950–5960 (2014). Article CAS PubMed Google Scholar * Giordano, A. M. S. et al. DNA damage contributes
to neurotoxic inflammation in Aicardi-Goutières syndrome astrocytes. _J. Exp. Med._ 219, e20211121 (2022). Article CAS PubMed PubMed Central Google Scholar * Shah, S. P. et al.
Mutational evolution in a lobular breast tumour profiled at single nucleotide resolution. _Nature_ 461, 809–813 (2009). Article CAS PubMed Google Scholar * Williams, K. A. et al. A
systems genetics approach identifies CXCL14, ITGAX, and LPCAT2 as novel aggressive prostate cancer susceptibility genes. _PLoS Genet._ 10, e1004809 (2014). Article PubMed PubMed Central
Google Scholar * Mottaghi-Dastjerdi, N. et al. Identification of novel genes involved in gastric carcinogenesis by suppression subtractive hybridization. _Hum. Exp. Toxicol._ 34, 3–11
(2015). Article CAS PubMed Google Scholar * Dai, B. et al. RNaseH2A is involved in human gliomagenesis through the regulation of cell proliferation and apoptosis. _Oncol. Rep._ 36,
173–180 (2016). Article CAS PubMed Google Scholar * Beyer, U. et al. Rare ADAR and RNASEH2B variants and a type I interferon signature in glioma and prostate carcinoma risk and
tumorigenesis. _Acta Neuropathol._ 134, 905–922 (2017). Article CAS PubMed Google Scholar * Günther, C. et al. Defective removal of ribonucleotides from DNA promotes systemic
autoimmunity. _J. Clin. Invest._ 125, 413–424 (2015). Article PubMed Google Scholar * Clausen, A. R. et al. Tracking replication enzymology in vivo by genome-wide mapping of
ribonucleotide incorporation. _Nat. Struct. Mol. Biol._ 22, 185–191 (2015). Article CAS PubMed PubMed Central Google Scholar * Reijns, M. A. M. et al. Lagging-strand replication shapes
the mutational landscape of the genome. _Nature_ 518, 502–506 (2015). Article CAS PubMed PubMed Central Google Scholar * Daigaku, Y. et al. A global profile of replicative polymerase
usage. _Nat. Struct. Mol. Biol._ 22, 192–198 (2015). Article CAS PubMed PubMed Central Google Scholar * Zatopek, K. M. et al. RADAR-seq: a RAre DAmage and Repair sequencing method for
detecting DNA damage on a genome-wide scale. _DNA Repair_ 80, 36–44 (2019). Article CAS PubMed Google Scholar * Sriramachandran, A. M. et al. Genome-wide nucleotide-resolution mapping of
DNA replication patterns, single-strand breaks, and lesions by GLOE-Seq. _Mol. Cell_ 78, 975–985.e7 (2020). Article CAS PubMed PubMed Central Google Scholar * Deamer, D., Akeson, M.
& Branton, D. Three decades of nanopore sequencing. _Nat. Biotechnol._ 34, 518–524 (2016). Article CAS PubMed PubMed Central Google Scholar * Wang, Y. et al. Nanopore sequencing
technology, bioinformatics and applications. _Nat. Biotechnol._ 39, 1348–1365 (2021). Article CAS PubMed PubMed Central Google Scholar * Lin, B., Hui, J. & Mao, H. Nanopore
technology and its applications in gene sequencing. _Biosensors_ 11, 214 (2021). Article CAS PubMed PubMed Central Google Scholar * Georgieva, D., Liu, Q., Wang, K. & Egli, D.
Detection of base analogs incorporated during DNA replication by nanopore sequencing. _Nucleic Acids Res._ 48, e88–e88 (2020). Article CAS PubMed PubMed Central Google Scholar * Xu, L.
& Seki, M. Recent advances in the detection of base modifications using the Nanopore sequencer. _J. Hum. Genet._ 65, 25–33 (2020). Article CAS PubMed Google Scholar * Müller, C. A.
et al. Capturing the dynamics of genome replication on individual ultra-long nanopore sequence reads. _Nat. Methods_ 16, 429–436 (2019). Article PubMed Google Scholar * Nookaew, I. et al.
Detection and Discrimination of DNA Adducts Differing in Size, Regiochemistry, and Functional Group by Nanopore Sequencing. _Chem. Res. Toxicol._ 33, 2944–2952 (2020). Article CAS PubMed
PubMed Central Google Scholar * Zhao, X. et al. Detection and characterization of single cisplatin adducts on DNA by nanopore sequencing. _ACS Omega_ 6, 17027–17034 (2021). Article CAS
PubMed PubMed Central Google Scholar * Hosseini, M. et al. Deep statistical modelling of nanopore sequencing translocation times reveals latent non-B DNA structures. _Bioinformatics_
39, i242–i251 (2023). Article PubMed PubMed Central Google Scholar * Patel, P. H. & Loeb, L. A. Multiple Amino Acid Substitutions Allow DNA Polymerases to Synthesize RNA. _J. Biol.
Chem._ 275, 40266–40272 (2000). Article CAS PubMed Google Scholar * Liu, H. et al. Accurate detection of m6A RNA modifications in native RNA sequences. _Nat. Commun._ 10, 4079 (2019).
Article PubMed PubMed Central Google Scholar * Gamaarachchi, H. et al. GPU accelerated adaptive banded event alignment for rapid comparative nanopore signal analysis. _BMC Bioinforma._
21, 343 (2020). Article CAS Google Scholar * Stoiber, M. et al. De novo identification of DNA modifications enabled by genome-guided nanopore signal processing. _bioRxiv_
https://doi.org/10.1101/094672 (2017). * Begik, O. et al. Quantitative profiling of pseudouridylation dynamics in native RNAs with nanopore sequencing. _Nat. Biotechnol._ 39, 1278–1291
(2021). Article CAS PubMed Google Scholar * Leger, A. et al. RNA modifications detection by comparative nanopore direct RNA sequencing. _Nat. Commun._ 12, 17 (2021). Article Google
Scholar * Rang, F. J., Kloosterman, W. P. & De Ridder, J. From squiggle to basepair: computational approaches for improving nanopore sequencing read accuracy. _Genome Biol._ 19, 90
(2018). Article PubMed PubMed Central Google Scholar * Teng, H. et al. Chiron: translating nanopore raw signal directly into nucleotide sequence using deep learning. _GigaScience_ 7,
giy037 (2018). Article PubMed PubMed Central Google Scholar * Noakes, M. T. et al. Increasing the accuracy of nanopore DNA sequencing using a time-varying cross membrane voltage. _Nat.
Biotechnol._ 37, 651–656 (2019). Article CAS PubMed PubMed Central Google Scholar * Gamaarachchi, H. et al. Fast nanopore sequencing data analysis with SLOW5. _Nat. Biotechnol._ 40,
1026–1029 (2022). Article CAS PubMed PubMed Central Google Scholar * Pratanwanich, P. N. et al. Identification of differential RNA modifications from nanopore direct RNA sequencing with
xPore. _Nat. Biotechnol._ 39, 1394–1402 (2021). Article CAS PubMed Google Scholar * Stephenson, W. et al. Direct detection of RNA modifications and structure using single-molecule
nanopore sequencing. _Cell Genomics_ 2, 100097 (2022). Article CAS PubMed PubMed Central Google Scholar * Fleming, A. M., Mathewson, N. J., Howpay Manage, S. A. & Burrows, C. J.
Nanopore dwell time analysis permits sequencing and conformational assignment of pseudouridine in SARS-CoV-2. _ACS Cent. Sci._ 7, 1707–1717 (2021). Article CAS PubMed PubMed Central
Google Scholar * Liu, F. T., Ting, K. M. & Zhou, Z.-H. Isolation forest. In _2008 Eighth IEEE International Conference on Data Mining (IEEE)_, pp. 413–422.
https://doi.org/10.1109/ICDM.2008.17 (2008). * Liu, F. T., Ting, K. M. & Zhou, Z.-H. Isolation-based anomaly detection. _ACM Trans. Knowl. Discov. Data_ 6, 1–39 (2012). Article Google
Scholar * Fonzino, A. et al. Unraveling C-to-U RNA editing events from direct RNA sequencing. _RNA Biol._ 21, 1–14 (2024). Article CAS PubMed Google Scholar * Caldecott, K. W. Ribose—an
internal threat to DNA. _Science_ 343, 260–261 (2014). Article CAS PubMed Google Scholar * Su, Y., Egli, M. & Guengerich, F. P. Mechanism of ribonucleotide incorporation by human
DNA polymerase η. _J. Biol. Chem._ 291, 3747–3756 (2016). Article CAS PubMed PubMed Central Google Scholar * Mentegari, E. et al. Ribonucleotide incorporation by human DNA polymerase η
impacts translesion synthesis and RNase H2 activity. _Nucleic Acids Res._ 45, 2600–2614 (2017). CAS PubMed Google Scholar * Gali, V. K. et al. Translesion synthesis DNA polymerase η
exhibits a specific RNA extension activity and a transcription-associated function. _Sci. Rep._ 7, 1–17 (2017). Article CAS Google Scholar * Meroni, A. et al. RNase H activities
counteract a toxic effect of Polymerase η in cells replicating with depleted dNTP pools. _Nucleic Acids Res._ 47, 4612–4623 (2019). Article CAS PubMed PubMed Central Google Scholar *
Li, H. Minimap2: pairwise alignment for nucleotide sequences. _Bioinformatics_ 34, 3094–3100 (2018). Article CAS PubMed PubMed Central Google Scholar * Li, H. et al. The Sequence
Alignment/Map format and SAMtools. _Bioinformatics_ 25, 2078–2079 (2009). Article PubMed PubMed Central Google Scholar * Bonfield, J. K. et al. HTSlib: C library for reading/writing
high-throughput sequencing data. _GigaScience_ 10, giab007 (2021). Article PubMed PubMed Central Google Scholar * Danecek, P. et al. Twelve years of SAMtools and BCFtools. _GigaScience_
10, giab008 (2021). Article PubMed PubMed Central Google Scholar * Simpson, J. T. et al. Detecting DNA cytosine methylation using nanopore sequencing. _Nat. Methods_ 14, 407–410 (2017).
Article CAS PubMed Google Scholar Download references ACKNOWLEDGEMENTS This work was supported by the Associazione Italiana Ricerca sul Cancro—AIRC (IG-21806 to M.M.F.), Ministero
dell’Università e della Ricerca (PRIN2017_2022KJHC7S to M.M.F. and PRIN_2022JA8JY5 to F.L.), National Center for Gene Therapy and Drugs Based on RNA Technology—MUR (Project no. CN_00000041
to G.P.), Authors are also grateful to the following National Research Centers: “High-Performance Computing, Big Data and Quantum Computing” (Project no. CN_00000013 to E.P.); and Extended
Partnerships: MNESYS (Project no. PE_0000006 to G.P.) and Age-It (Project no. PE_00000015 to G.P.). This work was also supported by ELIXIR-IT through the empowering project ELIXIRNextGenIT
(Grant Code IR0000010 to G.P.). Figure 1 was created with Biorender.com. AUTHOR INFORMATION Author notes * These authors contributed equally: Lavinia Grasso, Adriano Fonzino. AUTHORS AND
AFFILIATIONS * Dipartimento di Bioscienze, Università degli Studi di Milano, Via Celoria 26, 20133, Milano, Italy Lavinia Grasso, Federico Lazzaro & Marco Muzi-Falconi * Dipartimento di
Bioscienze, Biotecnologie e Ambiente, Università di Bari A. Moro, Via Orabona 4, 70126, Bari, Italy Adriano Fonzino, Caterina Manzari, Ernesto Picardi, Carmela Gissi & Graziano Pesole *
Center for Genomic Science of IIT@SEMM, Fondazione Istituto Italiano di Tecnologia, Via Adamello 16, 20139, Milano, Italy Tommaso Leonardi * Istituto di Biomembrane, Bioenergetica e
Biotecnologie Molecolari, Consiglio Nazionale delle Ricerche, Via Amendola 122/O, 70126, Bari, Italy Ernesto Picardi, Carmela Gissi & Graziano Pesole Authors * Lavinia Grasso View author
publications You can also search for this author inPubMed Google Scholar * Adriano Fonzino View author publications You can also search for this author inPubMed Google Scholar * Caterina
Manzari View author publications You can also search for this author inPubMed Google Scholar * Tommaso Leonardi View author publications You can also search for this author inPubMed Google
Scholar * Ernesto Picardi View author publications You can also search for this author inPubMed Google Scholar * Carmela Gissi View author publications You can also search for this author
inPubMed Google Scholar * Federico Lazzaro View author publications You can also search for this author inPubMed Google Scholar * Graziano Pesole View author publications You can also search
for this author inPubMed Google Scholar * Marco Muzi-Falconi View author publications You can also search for this author inPubMed Google Scholar CONTRIBUTIONS L.G., C.M. and C.G. conducted
the biological experiments. A.F., T.L. and E.P. conducted the computational analyses. F.L., G.P. and M.M-F. conceived the study and oversaw the research. L.G. and A.F. wrote the first draft
of the paper. All authors contributed to paper reviewing and editing. CORRESPONDING AUTHORS Correspondence to Federico Lazzaro, Graziano Pesole or Marco Muzi-Falconi. ETHICS DECLARATIONS
COMPETING INTERESTS The authors declare no competing interest. PEER REVIEW PEER REVIEW INFORMATION _Communications Biology_ thanks Ganesh N. Pandian and the other, anonymous, reviewer(s) for
their contribution to the peer review of this work. Primary Handling Editors: Tobias Goris. ADDITIONAL INFORMATION PUBLISHER’S NOTE Springer Nature remains neutral with regard to
jurisdictional claims in published maps and institutional affiliations. SUPPLEMENTARY INFORMATION SUPPLEMENTARY INFORMATION DESCRIPTION OF ADDITIONAL SUPPLEMENTARY FILES SUPPLEMENTARY DATA 1
REPORTING SUMMARY RIGHTS AND PERMISSIONS OPEN ACCESS This article is licensed under a Creative Commons Attribution 4.0 International License, which permits use, sharing, adaptation,
distribution and reproduction in any medium or format, as long as you give appropriate credit to the original author(s) and the source, provide a link to the Creative Commons licence, and
indicate if changes were made. The images or other third party material in this article are included in the article’s Creative Commons licence, unless indicated otherwise in a credit line to
the material. If material is not included in the article’s Creative Commons licence and your intended use is not permitted by statutory regulation or exceeds the permitted use, you will
need to obtain permission directly from the copyright holder. To view a copy of this licence, visit http://creativecommons.org/licenses/by/4.0/. Reprints and permissions ABOUT THIS ARTICLE
CITE THIS ARTICLE Grasso, L., Fonzino, A., Manzari, C. _et al._ Detection of ribonucleotides embedded in DNA by Nanopore sequencing. _Commun Biol_ 7, 491 (2024).
https://doi.org/10.1038/s42003-024-06077-w Download citation * Received: 13 March 2023 * Accepted: 20 March 2024 * Published: 23 April 2024 * DOI: https://doi.org/10.1038/s42003-024-06077-w
SHARE THIS ARTICLE Anyone you share the following link with will be able to read this content: Get shareable link Sorry, a shareable link is not currently available for this article. Copy to
clipboard Provided by the Springer Nature SharedIt content-sharing initiative