- Select a language for the TTS:
- UK English Female
- UK English Male
- US English Female
- US English Male
- Australian Female
- Australian Male
- Language selected: (auto detect) - EN
Play all audios:
ABSTRACT Accurate prediction of blood glucose variations in type 2 diabetes (T2D) will facilitate better glycemic control and decrease the occurrence of hypoglycemic episodes as well as the
morbidity and mortality associated with T2D, hence increasing the quality of life of patients. Owing to the complexity of the blood glucose dynamics, it is difficult to design accurate
predictive models in every circumstance, i.e., hypo/normo/hyperglycemic events. We developed deep-learning methods to predict patient-specific blood glucose during various time horizons in
the immediate future using patient-specific every 30-min long glucose measurements by the continuous glucose monitoring (CGM) to predict future glucose levels in 5 min to 1 h. In general,
the major challenges to address are (1) the dataset of each patient is often too small to train a patient-specific deep-learning model, and (2) the dataset is usually highly imbalanced given
that hypo- and hyperglycemic episodes are usually much less common than normoglycemia. We tackle these two challenges using transfer learning and data augmentation, respectively. We
systematically examined three neural network architectures, different loss functions, four transfer-learning strategies, and four data augmentation techniques, including mixup and generative
models. Taken together, utilizing these methodologies we achieved over 95% prediction accuracy and 90% sensitivity for a time period within the clinically useful 1 h prediction horizon that
would allow a patient to react and correct either hypoglycemia and/or hyperglycemia. We have also demonstrated that the same network architecture and transfer-learning methods perform well
for the type 1 diabetes OhioT1DM public dataset. SIMILAR CONTENT BEING VIEWED BY OTHERS MULTI-STEP AHEAD PREDICTIVE MODEL FOR BLOOD GLUCOSE CONCENTRATIONS OF TYPE-1 DIABETIC PATIENTS Article
Open access 21 December 2021 A DEEP LEARNING APPROACH FOR BLOOD GLUCOSE MONITORING AND HYPOGLYCEMIA PREDICTION IN GLYCOGEN STORAGE DISEASE Article Open access 15 April 2025 DATA-DRIVEN
BLOOD GLUCOSE LEVEL PREDICTION IN TYPE 1 DIABETES: A COMPREHENSIVE COMPARATIVE ANALYSIS Article Open access 19 September 2024 INTRODUCTION Type 2 diabetes (T2D) is a multifactorial
progressive chronic metabolic disorder, accounting for approximately 90% of all cases of diabetes1. The prevalence of diabetes has been increasing rapidly over the past few decades2. In
2019, about 463 million adults were living with diabetes, while it is estimated to be 578 and 700 million by 2030 and 2045, respectively3. T2D and hyperglycemia are associated with an
increased risk of vascular and non-vascular complications and premature mortality4,5,6. Furthermore, emerged evidence has also emphasized the importance of avoiding fluctuations in glycemia
in T2D7. Of note, the Advanced Technologies & Treatments for Diabetes (ATTD) consensus recommendations highlight the role of glycemic variability and the time in ranges (including the
time in target range, hyperglycemia, and hypoglycemia) as key metrics for Continuous Glucose Monitoring (CGM)8. The available antidiabetic treatments combined with a near-to-normal glucose
levels approach, indicating the efforts of reducing high glucose levels and normalizing glycated hemoglobin levels in the absence of any contraindications, may lead to a lower frequency of
T2D-related microvascular and macrovascular events9,10. On the other hand, intensified treatment targeting towards an intensive glucose control is associated with a higher risk of
therapy-induced hypoglycemia and severe hypoglycemic events, which pose a potential risk for worsening or developing major macrovascular and microvascular complications, serious neurological
consequences, as well as cardiovascular and all-cause mortality11,12,13,14. Additionally, hypoglycemia is a severe adverse outcome that may negatively impact a patient’s health and
psychological status, leading to poor compliance and treatment adherence13,14. Hypoglycemic events are also associated with a high direct and indirect cost for patients, healthcare systems,
and society14,15. Thus, the accurate prediction of blood glucose variations and, in particular, hypoglycemic events is of paramount importance to avoid potential detrimental complications
and adjust the therapeutic strategy in a more optimized and personalized treatment strategy for patients with T2D. To this end, well developed predictive models with high sensitivity and
accuracy, which are easy to implement, may facilitate better glycemic control, decrease the occurrence of hypoglycemic episodes or related complications and increase the quality of life in
this population. Of note, due to the complexity of the blood glucose dynamics, the design of physiological models that produce an accurate prediction in every circumstance, i.e.,
hypo/normo/hyperglycemic events, is met with substantial restrictions. Recently, machine learning has been shown to be very effective in solving classification and regression problems, and
the ever-growing availability of already collected personal data makes the prediction of diabetic blood glucose through data-driven approaches possible16,17,18. Machine learning-based
data-driven approaches use the individual’s recorded data, and require little understanding of the underlying physiological mechanism. Blood glucose dynamics in patients with type 2 diabetes
are affected by factors such as pancreatic function, insulin levels, carbohydrate intake, history of dysglycemia and the level and extent of physical activity. Models using combinations of
input parameters accounting for these factors have been previously considered19,20. Many different machine-learning methods have also been tested, including traditional machine-learning
methods, e.g., auto-regression with exogenous input (ARX)21, support vector machines (SVM)22, Gaussian process (GP)23, and ensemble methods24, as well as deep-learning approaches, e.g.,
feed-forward neural networks (FNNs), recurrent neural networks (RNNs), and convolutional neural networks (CNNs). For more details of the studies until 2018, we refer the readers to relevant
review papers16,17,18. Owing to its predictive effectiveness, deep learning has quickly become quite effective in blood glucose prediction since 201819,21,25,26,27,28,29,30. Among different
deep-learning approaches, RNNs based on the long short-term memory (LSTM), have been designed for sequence prediction problems and are the most commonly used models19,21,25,26,29. However,
there is no significant advantage observed by using the vanilla LSTM or convolution networks compared to a classic model (e.g., ARX), and in some cases RNNs or CNNs could showcase lower
performance, as shown in a recent benchmarking study21. To achieve better prediction accuracy, more advanced network architectures have recently been developed, e.g., the recurrent
convolutional neural network27, which includes a multi-layer CNN followed by a RNN, and GluNet28 based on the Wavenet architecture first presented in ref. 31. Deep learning usually requires
a large amount of data to train the networks, therefore, they are usually trained by population level rather than individual level data18,27,28. However, due to the variability of blood
glucose dynamics among different patients and the heterogeneity of patient treatment response32, the models trained only by population level data cannot guarantee accurate prediction for
each individual patient. To address the problem of _small dataset_, transfer learning33,34,35,36 can be employed, which stores knowledge gained while solving one problem (i.e., population
data) and then applying it to a different but related problem (i.e., patient-specific data). Transfer learning has been employed in blood glucose prediction very recently19,29,37,38,39, but
in these studies the patient-specific model based on transfer learning performed similarly to the population-based model or other classic machine learning models. In addition to the problem
of small data, another challenge in diabetic blood glucose prediction is the _data imbalance_. In particular, the dataset of normal-level blood glucose measurements (called _majority class_)
is orders-of-magnitude larger than the dataset of blood glucose measurements with specific symptom (called _minority class_), e.g., hypoglycemia. The model trained on the imbalanced dataset
leads to a biased performance, i.e., the accuracy of the minority class is much worse than that of the majority class40. To address the data imbalance issue, various general approaches have
been developed40,41,42, including pre-processing approaches, algorithmic centered approaches, and hybrid approaches, but learning from imbalanced data effectively and efficiently is still
an open problem43. In this study, we tackle both the challenge of small datasets as well as the challenge of imbalanced datasets, by leveraging recent advances in deep learning and
developing new methods for patient-specific prediction of diabetic blood glucose. First, we consider three neural network architectures and compare their performance systematically. These
three representative architectures are RNNs with the GRU cell44, gated convolutional neural networks (CNNs)45, and self-attention networks (SANs)46, all of which show their unique advantages
due to the difference in architecture designs for sequence classification, especially time-dependent sequences. Given the flexible structure of neural networks, we are presented with
numerous ways of fine-tuning in the transfer-learning step. However, as noted in ref. 47, the performance of each fine-tuning technique is task-specific. To the best of our knowledge, there
is no established consensus on the optimal fine-tuning technique for short-term glucose prediction. Hence, we develop four transfer-learning strategies for our glucose prediction task.
Specifically, we examine the performance of these four transfer-learning techniques by comparing the results of predicting hypoglycemia vs. normoglycemia vs. hyperglycemia obtained from RNN,
CNN, and SAN models in the setting of individual-based training. In addition, we consider new pre-processing approaches to address the data imbalance issue, because they are only performed
on training data and can be directly combined with any neural network algorithm. Besides the common approach of re-sampling, where the training data is augmented by repeating existing
samples, we also used other data augmentation techniques to generate synthetic data, including adding random noises and employing the recent techniques of mixup48 and time-series generative
adversarial networks (TimeGAN)49. While mixup has been very popular in computer vision tasks50, TimeGAN is designed specially for time series prediction tasks. In this work, we test the
performance of mixup and TimeGAN for data augmentation in the short-term blood glucose prediction task. To compare the performance of our algorithms with existing literature, we evaluate the
proposed algorithms using a public dataset OhioT1DM51, documenting the CGM history and physiological measurements of 12 patients with type 1 diabetes. We also examine the performance of our
algorithms on a private dataset recording blood glucose data for patients with type 2 diabetes. We include the details of our study design and blood glucose (BG) data collection in the
Materials and Methods section. Taken together, herein we propose a model capable of predicting blood glucose variability in patients with type 2 diabetes with high sensitivity and
specificity for the longest prediction horizon (time period after 30 min of BG collection) possible. More broadly, our combined methodology for tackling the fundamental problems of small and
imbalanced datasets can be transferred to many other biomedical applications for predicting the outcomes of diseases using bio-signals and time-series data, e.g., classification of abnormal
cardiac rhythms using data collected from wearable devices52 or electrocardiogram53, detection of seizure54 and Alzheimer’s disease55 using electroencephalography. RESULTS PATIENT-SPECIFIC
PREDICTION OF BLOOD GLUCOSE According to Cox et al.56, severe hypoglycemia (SH) often follows a specific blood glucose fluctuation pattern that is identifiable from self monitoring blood
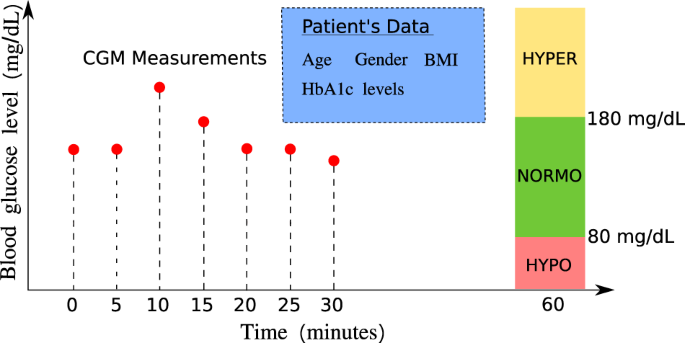
glucose; hence, we consider the 30-min blood glucose as the primary predictor and the future glycemia as the target prediction. In this paper, we consider the following two classification
tasks of diabetic blood glucose, i.e., one classification is “hypoglycemia” vs. “no hypoglycemia” and the other is “hypoglycemia” vs. “normoglycemia” vs. “hyperglycemia”, with the setup
shown in Fig. 1. Specifically, the threshold for hyperglycemia is set to 180 mg/dL, i.e., blood glucose levels higher than 180 mg/dL are labeled with “hyperglycemia”. On the other hand, we
set the threshold for hypoglycemia to be 80 mg/dL, i.e., we label blood glucose levels lower than 80 mg/dL as “hypoglycemia”. Here, unlike the common definition for level 1 hypoglycemia
based on the threshold of 70 mg/dL, we instead choose 80 mg/dL as the hypoglycemia threshold. This is because recent results by Farrell et al.57 have revealed a measurement artifact, i.e.,
that the real-time continuous glucose monitoring (CGM), where we would expect these algorithms to have clinical applicability, underestimates the degree of hypoglycemia by a difference of 10
mg/dL, as shown in Supplementary Fig. 1. DEEP TRANSFER LEARNING FOR SMALL PATIENT-SPECIFIC DATA We compare the performance of three neural network architectures by the averaged prediction
accuracy per capita for these two classification problems. The results in Fig. 2 suggest that as the training data size from the target patient increases, the prediction accuracy of all
models generally increases. We note that CNN models are generally more accurate than RNN models and slightly outperform SAN models with higher mean and smaller standard deviation for
prediction accuracy in both of the classification tasks. The results also suggest that the transfer-learning models (Transfer1 and Transfer2) can sometimes outperform the pre-trained models
in CNN models. We also compared our models with some existing classification methods, i.e., logistic regression, GP, SVM, and FNN in terms of (1) Predicting hypoglycemia vs. no hypoglycemia
(Supplementary Table 1); (2) Predicting hypoglycemia vs. normoglycemia vs. hyperglycemia (Supplementary Table 2) over a prediction horizon of 30 min; (3) Predicting hypoglycemia vs. no
hypoglycemia (Supplementary Table 3); (4) Predicting hypoglycemia vs. normoglycemia vs. hyperglycemia (Supplementary Table 4) over a prediction horizon of 60 min. In both tasks, our models
showed consistent increases in accuracy and the area under the receiver operating characteristic curve (AUROC) given more training data from the target patient and, specifically, better than
those by existing classification methods examined in predicting hypoglycemia vs. normoglycemia vs. hyperglycemia, see Supplementary Tables 1 and 2. Figure 3 shows the sensitivity analysis
of the prediction horizon on the prediction accuracy and Fig. 4 shows the ROC curves (receiver operating characteristic curves) of best models among all the models tested, given the training
data size from the target patient around 1000 data segments. Figure 3a suggests that the sensitivity between different prediction horizons is negligible in predicting hypoglycemia vs. no
hypoglycemia (binary classification), while Fig. 3b shows that the sensitivity between different prediction horizons becomes larger when the time elapse of two prediction horizons is large
in predicting hypoglycemia vs. normoglycemia vs. hyperglycemia (three-class classification). Figure 4 suggests that our best model maintains a high AUROC in both classification tasks for a
range of clinically useful prediction horizons, i.e., 5 min (Fig. 4a, b), 30 min (Fig. 4c, d) and 60 min (Fig. 4e, f). We evaluate the performance of our models on the OhioT1DM dataset, a
de-identified public dataset recording the glucose level, insulin dosage, exercise and other metabolism readings for six patients with type 1 diabetes in the 2018 version and another six
patients with type 1 diabetes in 2020 version51. We demonstrate the performance of our model by evaluating it on the dataset of six patients in the 2020 version. Specifically, the training
data is the union of all the training data of the 12 patients and the testing data of the 6 patients in the 2018 version. We discard any training sequences with one or more missing data
points. The training process of our model is again two-step, i.e., in the first training step, we pretrain the model on the training data excluding the training data of the patient to be
tested; in the second training step, we fine tune the model on the training data of the patient to be tested; finally we test the model on the testing data of the target patient. To make a
fair comparison, we compare our model performance with those using historical blood glucose levels as the only predictor and 30 min as the sampling horizon58,59,60,61. Similarly, all models
are evaluated on 6 patients in the 2020 version, see Table 1. The results in Table 1a suggest that our best model (CNN + Transfer2) outperforms all other models in terms of mean absolute
error (MAE) in both cases of 30 and 60 min prediction horizon. While the root mean squared error (RMSE) of our results are not the best among these five models, they are the second to the
best model, i.e., the model by Bevan et al.59, which reported RMSE of 18.23 for 30 min prediction horizon after imputing missing value with mean value of the training dataset. Bevan et al.
also reported a slightly higher RMSE at 18.82 for 30 min prediction horizon when missing data in the training sequence is discarded, which we believe is very close to our results, given the
same missing data handling strategy. It is standard practice in clinical medicine to use sensitivity to evaluate the value of a test as a screening test and use specificity to evaluate the
value of a test as a confirmatory test. Hence, we further examine our model performance using the regression results for binary classification of hypoglycemia class vs. no hypoglycemia
class. Specifically, we set the threshold of hypoglycemia vs. no hypoglycemia to be 80 mg/dL, i.e., values < 80 mg/dL are denoted as the positive class while greater than that as the
negative class. The results of the binary classification for 30 min prediction horizon in Table 1b suggest that our model is more accurate than that by Bevan et al., i.e., higher accuracy
and F1 score. Compared to the results of Bevan et al., our model shows same specificity and negative predictive value (NPV) but much better sensitivity (almost 10% higher). Hence, our model
provides a better screening test (sensitivity) and equally good confirmatory test (specificity), which is an overall better test and is highly favorable in the clinical setting. IMPROVEMENT
OF SENSITIVITY FOR IMBALANCED DATA In this section, we show further detailed analysis with regression-based models for classification, i.e., we perform regression prediction then convert the
real-valued prediction into class labels, as shown in Fig. 1. We note that our raw BG data is innately real-valued, hence it is natural to investigate the data feature following a
regression approach. Here, we aim to show the effects of different data augmentation methods mainly on the minority dataset. With our previous classification analysis, we set up the
regression model with the following preconditions: the prediction horizon is 20 min if not mentioned otherwise and the hypoglycemia threshold is set to be 80 mg/dL. We will show results
without transfer learning, i.e., we train the models on the dataset, which is the union of other patients’ data except for the target patient and then directly test on the target patient’s
dataset. We focus on comparing the model performance in predicting hypoglycemia vs. no hypoglycemia by converting the real-valued prediction into two labels: one label is “hypoglycemia”,
meaning the prediction is below 80 mg/dL while the other is “no hypoglycemia”, meaning the prediction is above or equal to 80 mg/dL. We also carry out the same conversion on the true BG
values measured by the CGM. With the conversion, we can then compare four classification scores, sensitivity, positive predictive value, specificity, and negative predictive value between
different models. SELECTION OF LOSS FUNCTIONS We tested the performance of four different loss functions, i.e., mean absolute error, relative mean absolute error, mean squared error and
relative mean squared error using the original training dataset without data augmentation. In particular, we examined the performance of models with different loss functions using four
classification metrics, i.e., sensitivity, positive predictive value (PPV), specificity and negative predictive value (NPV). To compute these four classification metrics, the real-valued
blood glucose prediction is categorized into two classes, i.e., “hypoglycemia” (positive class) and “no hypoglycemia” (negative class). Figure 5a shows the comparison of model performance
using different loss functions. The result suggests that the model using _relative mean absolute error_ (REL. MAE) outperforms models using the other three loss functions, because the model
using the relative mean absolute error maintains a balanced high value for each of the aforementioned four metrics. Figure 5b shows the scatter plot of true BG vs. predicted BG also suggests
high prediction accuracy with the points clustering near the diagonal black line indicating the perfect prediction. The red lines divide the whole domain into four rectangular regions,
i.e., the true positive region (TP) denoting that the true BG is “hypoglycemia” and prediction is also “hypoglycemia”; the false-positive region (FP) denoting that the true BG is “no
hypoglycemia” but the prediction is “hypoglycemia”; the false-negative region (FN) denoting that the true BG is “hypoglycemia” but the prediction is “no hypoglycemia”; the true-negative
region (TN) denoting that the true BG is “no hypoglycemia” and the prediction is “no hypoglycemia”. DATA AUGMENTATION In this part, we fix the loss function in our model to be the _relative
mean absolute error_ (REL. MAE) and compare the performance of our model when four different data pre-processing techniques are implemented for data augmentation on the training data of the
minority class and a prediction horizon at 20 min. For this data augmentation method, we repeat the minority samples (the input-output pairs where the output BG is less than 80 mg/dL) in the
training dataset for _k_ folds, i.e., for two-fold oversampling by repeating, we duplicate the minority samples once such that the minority data is doubled in the augmented training
dataset. Hence, for _k_-fold oversampling by repeating, we augment the training data by adding _k_ − 1 copies of the training data labeled as hypoglycemia (output BG < 80 mg/dL) to the
augmented training dataset. Figure 6a shows that oversampling by repeating only improved slightly in the sensitivity when the minority augmentation fold increases, which is different from
the other three augmentation methods. Adding Gaussian white noises to the training dataset has been proved to be an effective way of data augmentation for CNNs27, and specifically for CNNs
using wearable sensor data62. In this part, we tried different levels of Gaussian white noises distinguished by the variance of the noise. In particular, we infused white noises with
variance at 5, 10, 50 mg/dL, respectively, to the input BG data of minority class, whose output BG value is below the hypoglycemia threshold, i.e., there are two copies of minority training
data in the augmented dataset, one is the original copy collected by the CGMs, and the other is a copy generated by infusing Gaussian noises. Figure 6b suggests that increasing the variance
of the infused Gaussian noise will increase the sensitivity of the model. We generated synthetic minority samples using TimeGAN49, by training a TimeGAN using the original minority samples
in our dataset. TimeGAN combines the versatility of the unsupervised GAN approach with the control over conditional temporal dynamics afforded by supervised auto-regressive models, by
leveraging the contributions of the supervised loss and jointly trained embedding network, and hence can generate realistic time-series data. Our trained TimeGAN is validated by the PCA and
T-NSE plots for the original minority samples and synthetic minority samples, see Supplementary Fig. 3. We then compared the performance of models when different folds of synthetic minority
samples were added to augmented training dataset. Figure 6c shows that adding more minority data generated by TimeGAN could also improve model sensitivity but not as monotonically as the
other methods tested. Zhang et al.48 recently introduced mixup to improve the generalization of neural network architectures, by linearly interpolating between samples in the training
dataset using the following formula, $$\tilde{x}=\lambda \ {x}_{i}+(1-\lambda ){x}_{j},\ \tilde{y}=\lambda \ {y}_{i}+(1-\lambda ){y}_{j},$$ (1) where \(\tilde{x},\tilde{y}\) denote generated
input and output, respectively; _λ_ is a hyperparameter following the Beta distribution, Beta(_α_, _α_); _x__i_, _x__j_ denote inputs from two different samples and _y__i_, _y__j_ denote
the corresponding output of those two different samples. We note that in the original mixup algorithm, _y__i_, _y__j_ can be of different class, while in our model we only perform mixup on
the minority class, i.e., _y__i_, _y__j_ satisfy the condition that _y__i_ < 80 and _y__j_ < 80. There have been some attempts to perform data augmentation using mixup in time-series
analysis of biosignals, such as electroencephalogram (EEG) and electrocardiogram (ECG)63, generating virtual biosignals from real biosignals of different types64. While in this work, we
implement mixup for data augmentation on minority class only to alleviate the effect of data imbalance. By _k_-fold mixup, the size of the minority class is increased to _k_ times of its
original size by adding _k_ − 1 copies of synthetic data using mixup for each training epoch. The original mixup algorithm does not include _k_ as a hyperparameter, i.e., in the original
mixup, the original training data is replaced by synthetic data generated by linear interpolation in the beginning of each training epoch. Figure 6d shows that increasing the folds of
minority data by mixup could help improve model sensitivity but the uncertainty in the positive predictive value is relatively larger than other augmentation methods. The hyper-parameter _α_
in the Beta distribution Beta(_α_, _α_) of mixup is a very sensitive parameter controlling the diversity of the synthetic samples, i.e., higher _α_ produces samples more resembling to the
reference real data while lower _α_ introduces samples very different from the reference real data. With _α_ = 1, Beta(1, 1) is equivalent to a uniform random distribution. Here, we compare
the performance of our model given _α_ = 0.4 and _α_ = 2 in twofold mixup, in terms of two classification scores, i.e., positive predictive value (PPV) and sensitivity for the positive class
(the minority class, hypoglycemia samples), and examine the sensitivity of those two classification scores for different prediction horizons. The results for _α_ = 0.4 and _α_ = 2 are shown
in Fig. 7. We note that mixup with either _α_ = 0.4 or _α_ = 2 improves the model sensitivity over different prediction horizons. Specifically, models trained on the training dataset
augmented by mixup show high sensitivity within all the prediction horizons examined while the model without data pre-processing shows decreased sensitivity over longer prediction horizons.
The model trained on the training dataset augmented by mixup _α_ = 0.4 shows different uncertainty in the predictive scores for different prediction horizons; for example, the standard
deviation of sensitivity and PPV for prediction horizon at 15 min are much larger than those for other prediction horizons. However, the model trained on the training dataset augmented by
mixup _α_ = 2 shows similar uncertainty in the predictive scores among different prediction horizons, mainly because samples generated by mixup _α_ = 0.4 are relatively distinct from the
original samples collected while those by mixup _α_ = 2 is similar to the original samples, hence preserves the data patterns. As the prediction horizon increases, the sensitivity of the
model decreases while the PPV increases when training on the raw dataset. However, the models trained on datasets augmented by mixup show high sensitivity and a gradual drop in the PPV,
regardless of the increase in the prediction horizon. The results in Fig. 6 indicate that by adding more training data of minority class, either through duplication or synthesizing, will
increase the model sensitivity but decrease the positive predictive value, i.e., the precision for minority class. Specifically, given the same amount of minority samples in the training
data, the increase in model sensitivity and decrease in precision for minority class is more significant in those with synthetic minority samples, compared to the oversampling by repeating.
These results prove a recent finding that transforms (augmentations), which preserve the labels of the data can improve estimation by enlarging the span of the training data50. In our case,
we preserve the labels of the data by only augmenting the minority training data, which consequently increases the span of minority data, by generating synthetic data using Gaussian noise,
TimeGAN or mixup. Our results also suggest that synthetic minority data (data generated by infusing Gaussian noise, TimeGAN or mixup) could increase the span of minority data much more
significantly than repeating the original minority data. DISCUSSION Type 2 diabetes is considered an epidemic worldwide. Hyperglycemia selectively damages cells that are not able to reduce
glucose transport into the cell, such as capillary endothelial cells in the retina, mesangial cells in the renal glomerulus, and neurons and Schwann cells in peripheral nerves. High
intracellular glucose concentration leads to the exhaustion of the antioxidant pathways, altered regulation of gene transcription and increased expression of pro-inflammatory molecules
resulting in cellular dysfunction and death65. On a clinical level, these cellular changes translate into micro and macrovascular complications of diabetes associated with poor outcomes and
increased mortality66. Current diabetes treatment regimens may decrease the occurrence of complications associated with hyperglycemia, however, they also suppose a risk of extremely low
glucose levels. Hypoglycemia can lead to permanent neurological damages if not treated promptly and increased mortality13. The prediction of blood glucose variations helps to adjust acute
therapeutic measures and food intake in patients with type 2 diabetes. We developed transfer-learning methods to predict “hypoglycemia” vs. “no hypoglycemia” or “hypoglycemia” vs.
“normoglycemia” vs. “hyperglycemia” for patients with type 2 diabetes. We obtained state-of-the-art results by tackling two major challenges associated with the small data size for
individual patients as well as the imbalanced datasets, i.e., small samples for hypoglycemia. To deal with small datasets, we considered three neural network models, including recurrent
neural networks (RNNs), convolutional neural networks (CNNs) and self-attention networks (SANs). We also examined four transfer-learning strategies, which enabled us to train the neural
networks with a small amount of individual’s recorded data. We demonstrated the performance of our methods on the data obtained from 40 patients. We achieved high prediction accuracy for the
task of predicting hypoglycemia vs. no hypoglycemia with accuracy no less than 98% and AUROC greater than 0.9 for all the prediction horizons examined. For the task of predicting
hypoglycemia vs. normoglycemia vs. hyperglycemia, the best model among all tested models achieved high accuracy greater than 89% and AUROC greater than 0.86, for all the prediction horizons
examined (up to 1 h). Our results suggest that as the prediction horizon prolongs, the prediction accuracy, as well as the AUROC decreases, as expected, in both classification tasks. When
comparing the model performance on predicting hypoglycemia vs. no hypoglycemia and predicting hypoglycemia vs. normoglycemia vs. hyperglycemia, our results suggest that the overall
prediction accuracy and AUROC in the task of predicting hypoglycemia vs. no hypoglycemia is always higher than those in the task of predicting hypoglycemia vs. normoglycemia vs.
hyperglycemia. More specifically, statistical significance was observed between two short prediction horizons (5 and 10 min) and the largest prediction horizon (60 min) in the task of
predicting hypoglycemia vs. normoglycemia vs. hyperglycemia. We note that despite of the statistical differences observed among different prediction horizons, the model always maintained
high accuracy. However, a closer examination on our dataset reveals that most of the blood glucose levels are labeled as either normoglycemia or hyperglycemia and hence only very few blood
glucose levels are labeled as hypoglycemia, making hypoglycemia the definite minority class, resulting in models with sensitivity around 77% and positive predictive value around 75% for a
prediction horizon at 20 min. Given the need to detect hypoglycemia more accurately and robustly, data augmentation on the minority class, i.e., augment the hypoglycemia samples in our
training dataset, is an effective way of enforcing the neural networks to learn the underlying patterns of the hypoglycemia data at a finer scale compared to learning on the dataset without
data augmentation. Our tests suggest that data augmentation on the minority class using synthetic data (not oversampling by repeating) increases the model sensitivity in detecting
hypoglycemia, from more than 80% to less than 96% depending on the specific augmentation method for a prediction horizon at 20 min. This allows early treatment intervention and prevention of
potential hypoglycemic events and hence is a significant improvement preferred in clinical diagnosis given the fatal consequences of hypoglycemia for patients with serious complications
caused by type 2 diabetes. However, given the imbalance nature of our dataset, the increased sensitivity, i.e., the recall of the minority class, observed from models trained on the
augmented dataset also comes with a decrease in the positive predictive value, i.e., the precision of the minority class. Although the trade-off between the precision and recall for
imbalanced datasets is a commonly observed dilemma, with minority data augmentation of different folds, we could still achieve a good balance between those two metrics such that they are
acceptable in practical scenarios. Despite the high accuracy and a few training data demanded by our method, there are some limitations to current work. Different from other physiologically
derived approaches, this method is purely data-driven with no physiological knowledge, and performs prediction merely based on the blood glucose history. It is recognized that data-driven
methods are double-edged swords. On one side, data-driven methods relieve physicians from exhausting all possible combinations of physiological inputs given large samples or data. On the
other side, it is not an easy task to incorporate domain knowledge to data-driven methods, especially in neural network-based models. In our study, we identify nutritional intake, exercise
or stress conditions in dysglycemia prediction as the domain knowledge, the appropriate incorporation of which could possibly improve the model accuracy. Hence, we will propose the
development of physiologics-informed neural network models in our future work. This and similar methods in the future are expected to have important clinical implications in terms of
preventing and avoiding this potentially lethal complication, e.g., through alerts generated directly to the patient or by linking the prediction algorithms to the programmable insulin
pumps. To summarize, we proposed a new method for predicting hypoglycemia vs. no hypoglycemia and predicting hypoglycemia vs. normoglycemia vs. hyperglycemia, and the method shows remarkable
performance characterized by high prediction accuracy and AUROC as well as other metrics, including specificity and sensitivity. In particular, a combined approach of transfer learning and
data augmentation for imbalanced data can be proved a very powerful new framework for short term predictions for type 2 diabetes. Here, we focused on time periods up to 60 min, with a
notable sensitivity and positive predictive value of the model observed during the first 15 and 30 min. We believe that accurate hypoglycemia prediction over this period of time offers the
most in terms of having potential warning signs and preventing adverse events by hypoglycemia. By incorporating transfer learning, this method could provide patient-specific results in both
predicting hypoglycemia vs. no hypoglycemia and predicting hypoglycemia vs. normoglycemia vs. hyperglycemia with relatively few patient-specific training blood glucose samples. For example,
in our case, we used 1000 time segments, equivalently 83 h long, from the target patient. METHODS DATASET The use of blood glucose (BG) history of patients with T2D in this study were
approved by the institutional review board (IRB) of the Beth Israel Deaconess Medical Center. Informed consents were obtained from all human participants. The BG level was measured every 5
min by a Continuous Glucose Monitoring System. We analyzed data obtained from 40 outpatients with diabetes (19 males; age 65 ± 8 years; BMI at 30 ± 5; with a mean HbA1c level at 7.33%), who
contributed a mean of 130.6 mg/dL blood glucose level through CGM (BG ranging from 40 to 400 mg/dL). Individuals were eligible for inclusion if they were adults with a diagnosis of T2D
patients using CGM. We present the blood glucose history of four selected patients in Supplementary Fig. 2. Ten patients (25% of the participants) were treated with insulin while 27 (67.5%
of the participants) were receiving oral or (non-insulin) injectable antidiabetic drugs. The rest of the patients (3 patients, 7.5% of the participants) were treated without oral nor insulin
medications. We identified all level 1 hypoglycemic (BG level <80 mg/dL) and hyperglycemic (BG level >180 mg/dL) episodes from the CGM recordings. To facilitate the network training,
the BG levels were scaled by 0.0167, and we applied a smoothing step on the BG measurements to remove any large spikes that may be caused by patient movement, as suggested in ref. 68. An
overview of the dataset used in this work can be found in Table 2. PREDICTORS AND OUTCOME The primary outcome of interest in this study is the BG values in the future, e.g., 5 min to 1 hr
later. We take the BG measured in 30 min (7 BG values) as one input data segment and predict the future BG level after a prediction horizon, a time period from the most recent CGM
measurement in the input BG values, as shown in Fig. 1. NEURAL NETWORK ARCHITECTURES We developed new deep-learning methods for patient-specific blood glucose level prediction. We considered
three different neural network architectures, including recurrent neural networks (RNNs)44,69, gated convolutional neural networks (CNNs)45, and self-attention networks (SAN)46, as well as
three different transfer-learning strategies. We also implemented Gaussian process regression (GP), fully connected feedforward neural networks (FNNs), and support vector machine (SVM) as
the baseline models. We implement GP and SVM with the sklearn library70. For GP, we use a combined kernel consisting of a constant kernel, a radial basis function kernel and a white noise
kernel. For SVM, we use the default hyperparameters. For FNN, we use a 10-neuron-width, 3-layer-depth network. The detailed hyperparameters of the baseline models are optimized via grid
search and can be found in the released code repository. To tackle the important issue of data imbalance, we tested four different data augmentation methods, i.e., oversampling by repeating,
infusing Gaussian noises, TimeGAN and mixup, on the minority class. The dominant deep learning method used for sequence learning is the RNN, which is a class of neural networks that allow
previous outputs to be used as the inputs of the current step. The cell units in RNNs are usually chosen as long short-term memory units (LSTMs)69 and gated recurrent units (GRUs)44, which
deal with the vanishing gradient problem encountered by traditional RNNs. In addition to RNNs, CNNs and self-attention networks were proposed recently for time series forecasting, and
achieved better performance than RNNs for certain tasks. In the gated CNNs, one-dimensional (1-D) convolutional kernels create hierarchical representations over the input time series, in
which nearby BG measurements interact at lower layers while distant BG measurements interact at higher layers. The mechanism of attention was first proposed in ref. 71 for machine
translation, and it has been shown that the network architecture based solely on self-attention mechanism can also be used successfully to compute a representation of the sequence46.
Self-attention is an attention mechanism to compute a representation of the sequence by relating different positions of a sequence. In the RNNs, the input sequence is fed into the network
sequentially, while in CNNs and self-attention networks, the input sequence is fed into the network simultaneously, and thus an embedding of the position of input elements is required45. For
the hyperparameters in the networks, e.g., the depth and width, we perform a grid search to obtain an optimal set of hyperparameters, see Table 3 for more details. The details of the
network architectures used in this study are shown in Fig. 8. TRANSFER LEARNING To address the difficulty of obtaining a sufficient large dataset for each patient, we implemented transfer
learning33,34,35,36 on the three aforementioned neural network architectures. In transfer learning, the training procedure of neural networks includes two steps: first, we pre-train the
networks on other patients’ data by excluding the data from the target patient, and then we further fine-tune the network on one part of the target patient’s data, i.e., re-train the network
on the training data of the target patient’s blood glucose history. Finally, we test the network on the rest of the data from the target patient. Two commonly used further-training
approaches are based on initialization and feature extraction72. In the initialization approach, the entire network is trained, while in the feature extraction approach the last few fully
connected layers are trained from a random initialization while other layers remain unchanged. In this study, in addition to these two approaches, we consider a third approach by combining
these two approaches, i.e., the last few fully connected layers are further trained while other layers remain unchanged. The details of the four transfer learning methods can be found in
Fig. 8 and Table 3. IMBALANCED DATA Imbalanced data has been an ubiquitous issue in many fields, causing most methods to yield erroneous predictions strongly biasing towards the majority
class. To reduce the hazardous effect of imbalanced data, we can improve the method with various techniques: (i) modifying the imbalanced data set by some mechanisms such as oversampling or
undersampling or both to provide a balanced distribution; (ii) designing problem-specific cost matrices to describe the costs for misclassifying any particular data example; (iii) using
boosting methods73,74. Here, we tested several methods for data augmentation on the training data of the minority class only, i.e., oversampling by repeating, adding Gaussian white noises to
the input data, generating synthetic minority samples using TimeGAN49 and mixup48, respectively. We compared the performance of these preprocessing techniques in terms of four
classification metrics, i.e., sensitivity, positive predictive value, specificity and negative predictive value. MODEL VALIDATION For model validation, if the networks are trained on
multiple patients, then we used a Leave-one-out cross-validation (LOOCV), i.e., we randomly selected the dataset of one patient to be the test dataset and used the dataset of the remaining
patients to train the model. The outcome variables indicate whether or not hypoglycemia or hyperglycemia occurred. The model performance is measured in terms of the prediction accuracy,
which is defined as follows, $$\,\text{Accuracy}\,=\frac{{\mathrm{TP}}+{\mathrm{FN}}}{{\mathrm{TP}}+{\mathrm{FN}}+{\mathrm{TN}}+{\mathrm{FP}}},$$ (2) and the area under the receiver
operating characteristic curve (AUROC). To calibrate the data augmentation effect on the imbalanced dataset, we computed four classification metrics, sensitivity, positive predictive value
(PPV), specificity and negative predictive value (NPV) from the following formulas: $$\begin{array}{ll}\,\text{Sensitivity}\,&=\frac{{\mathrm{TP}}}{{\mathrm{TP}}+{\mathrm{FN}}},\
{\mathrm{PPV}}=\frac{{\mathrm{TP}}}{{\mathrm{TP}}+{\mathrm{FP}}},\\ \,\text{Specificity}\,&=\frac{{\mathrm{TN}}}{{\mathrm{TN}}+{\mathrm{FP}}},\
{\mathrm{NPV}}=\frac{{\mathrm{TN}}}{{\mathrm{TN}}+{\mathrm{FN}}}.\end{array}$$ (3) where TP denotes the number of true positives, FP denotes that of false positives, TN denotes the number of
true negatives, and FN denotes that of false negatives. REPORTING SUMMARY Further information on research design is available in the Nature Research Reporting Summary linked to this
article. DATA AVAILABILITY The dataset used in the current study provided by Beth Israel Deaconess Medical Center (BIDMC) is not publicly available, due to reasonable privacy and security
concerns. The data is not easily redistributable to researchers other than those engaged in the Institutional Review Board-approved research collaborations with Beth Israel Deaconess Medical
Center (BIDMC). CODE AVAILABILITY The code is available on a GitHub repository: https://github.com/yixiangD/AccurateBG. REFERENCES * Zimmet, P., Alberti, K. & Shaw, J. Global and
societal implications of the diabetes epidemic. _Nature_ 414, 782–787 (2001). Article CAS PubMed Google Scholar * Whiting, D. R., Guariguata, L., Weil, C. & Shaw, J. IDF diabetes
atlas: global estimates of the prevalence of diabetes for 2011 and 2030. _Diabetes Res. Clin. Pract._ 94, 311–321 (2011). Article PubMed Google Scholar * Saeedi, P. et al. Global and
regional diabetes prevalence estimates for 2019 and projections for 2030 and 2045: Results from the international diabetes federation diabetes atlas, 9th edition. _Diabetes Res. Clin.
Pract._ 157, 107843 (2019). Article PubMed Google Scholar * Emerging Risk Factors Collaboration; Collaboration et al. Diabetes mellitus, fasting blood glucose concentration, and risk of
vascular disease: a collaborative meta-analysis of 102 prospective studies. _Lancet_ 375, 2215–2222 (2010). * Tancredi, M. et al. Excess mortality among persons with type 2 diabetes. _N.
Engl. J. Med._ 373, 1720–1732 (2015). Article CAS PubMed Google Scholar * Collaboration, E. R. F. Diabetes mellitus, fasting glucose, and risk of cause-specific death. _N. Engl. J. Med._
364, 829–841 (2011). Article Google Scholar * Gorst, C. et al. Long-term glycemic variability and risk of adverse outcomes: a systematic review and meta-analysis. _Diabetes Care_ 38,
2354–2369 (2015). Article CAS PubMed Google Scholar * Danne, T. et al. International consensus on use of continuous glucose monitoring. _Diabetes Care_ 40, 1631–1640 (2017). Article
PubMed PubMed Central Google Scholar * Holman, R. R., Paul, S. K., Bethel, M. A., Matthews, D. R. & Neil, H. A. W. 10-year follow-up of intensive glucose control in type 2 diabetes.
_N. Engl. J. Med._ 359, 1577–1589 (2008). Article CAS PubMed Google Scholar * Hayward, R. A. et al. Follow-up of glycemic control and cardiovascular outcomes in type 2 diabetes. _N.
Engl. J. Med._ 372, 2197–2206 (2015). Article CAS PubMed Google Scholar * Action to Control Cardiovascular Risk in Diabetes Study Group, et al. Effects of intensive glucose lowering in
type 2 diabetes. _N. Engl. J. Med_. 358, 2545–2559 (2008). * Zoungas, S. et al. Severe hypoglycemia and risks of vascular events and death. _N. Engl. J. Med._ 363, 1410–1418 (2010). Article
CAS PubMed Google Scholar * Cryer, P. E., Davis, S. N. & Shamoon, H. Hypoglycemia in diabetes. _Diabetes Care_ 26, 1902–1912 (2003). Article CAS PubMed Google Scholar * Unger,
J. Uncovering undetected hypoglycemic events. _Diabetes Metab. Syndr. Obes.: Targets Ther._ 5, 57 (2012). Article CAS Google Scholar * Boulin, M., Diaby, V. & Tannenbaum, C.
Preventing unnecessary costs of drug-induced hypoglycemia in older adults with type 2 diabetes in the united states and canada. _PLoS ONE_ 11, e0162951 (2016). Article PubMed PubMed
Central CAS Google Scholar * Oviedo, S., Vehí, J., Calm, R. & Armengol, J. A review of personalized blood glucose prediction strategies for T1DM patients. _Int. J. Numer. Method
Biomed. Eng._ 33, e2833 (2017). Article Google Scholar * Kavakiotis, I. et al. Machine learning and data mining methods in diabetes research. _Comput. Struct. Biotechnol. J._ 15, 104–116
(2017). Article PubMed PubMed Central Google Scholar * Woldaregay, A. Z. et al. Data-driven modeling and prediction of blood glucose dynamics: Machine learning applications in type 1
diabetes. _Artif. Intell. Med._ 98, 109–134 (2019). Article PubMed Google Scholar * Faruqui, S. H. A. et al. Development of a deep learning model for dynamic forecasting of blood glucose
level for type 2 diabetes mellitus: secondary analysis of a randomized controlled trial. _JMIR mHealth and uHealth_ 7, e14452 (2019). Article PubMed PubMed Central Google Scholar *
Contreras, I., Oviedo, S., Vettoretti, M., Visentin, R. & Vehí, J. Personalized blood glucose prediction: a hybrid approach using grammatical evolution and physiological models. _PLoS
ONE_ 12, e0187754 (2017). Article PubMed PubMed Central CAS Google Scholar * Xie, J. & Wang, Q. Benchmarking machine learning algorithms on blood glucose prediction for type 1
diabetes in comparison with classical time-series models. _IEEE. Trans. Biomed. Eng._ 67, 3101–3124 (2020). Article PubMed Google Scholar * Sudharsan, B., Peeples, M. & Shomali, M.
Hypoglycemia prediction using machine learning models for patients with type 2 diabetes. _J. Diabetes Sci. Technol._ 9, 86–90 (2014). Article PubMed PubMed Central Google Scholar *
Tomczak, J. M. Gaussian process regression with categorical inputs for predicting the blood glucose level. In _International Conference on Systems Science_, 98–108 (Springer, 2016). *
Mueller, L. et al. Application of machine learning models to evaluate hypoglycemia risk in type 2 diabetes. _Diabetes Ther._ 11, 681–699 (2020). Article CAS PubMed PubMed Central Google
Scholar * Aliberti, A. et al. A multi-patient data-driven approach to blood glucose prediction. _IEEE Access_ 7, 69311–69325 (2019). Article Google Scholar * Massaro, A., Maritati, V.,
Giannone, D., Convertini, D. & Galiano, A. LSTM DSS automatism and dataset optimization for diabetes prediction. _Appl. Sci._ 9, 3532 (2019). Article Google Scholar * Li, K., Daniels,
J., Liu, C., Herrero-Vinas, P. & Georgiou, P. Convolutional recurrent neural networks for glucose prediction. _IEEE J. Biomed. Health Inform._ 24, 603–613 (2019). Article PubMed Google
Scholar * Li, K., Liu, C., Zhu, T., Herrero, P. & Georgiou, P. Glunet: A deep learning framework for accurate glucose forecasting. _IEEE J. Biomed. Health Inform._ 24, 414–423 (2019).
Article PubMed Google Scholar * Mohebbi, A. et al. Short term blood glucose prediction based on continuous glucose monitoring data. _2020 42nd Annual International Conference of the IEEE
Engineering in Medicine & Biology Society (EMBC)_ 5140–5145 (IEEE, 2020). * Misra-Hebert, A. D. et al. Natural language processing improves detection of nonsevere hypoglycemia in medical
records versus coding alone in patients with type 2 diabetes but does not improve prediction of severe hypoglycemia events: An analysis using the electronic medical record in a large health
system. _Diabetes Care_ 43, 1937–1940 (2020). Article PubMed PubMed Central Google Scholar * van den Oord, A. et al. WaveNet: a generative model for raw audio. _9th ISCA Speech
Synthesis Workshop_ 125. * Wang, Y., Fu, H. & Zeng, D. Learning optimal personalized treatment rules in consideration of benefit and risk: with an application to treating type 2 diabetes
patients with insulin therapies. _J. Am. Stat. Assoc._ 113, 1–13 (2018). Article PubMed CAS Google Scholar * Pan, S. J. & Yang, Q. A survey on transfer learning. _IEEE Trans. Knowl.
Data Eng._ 22, 1345–1359 (2009). Article Google Scholar * Weiss, K., Khoshgoftaar, T. M. & Wang, D. A survey of transfer learning. _J. Big Data_ 3, 9 (2016). Article Google Scholar
* Tan, C. et al. A survey on deep transfer learning. In _International Conference on Artificial Neural Networks_, 270–279 (Springer, 2018). * Zhuang, F. et al. A comprehensive survey on
transfer learning. _Proc. IEEE_ 109, 43–76 (2020). Article Google Scholar * Zhu, T., Li, K., Herrero, P., Chen, J. & Georgiou, P. in _A Deep Learning Algorithm for Personalized Blood
Glucose Prediction_. 64–78 (KHD@ IJCAI, 2018). * De Bois, M., El Yacoubi, M. A. & Ammi, M. Adversarial multi-source transfer learning in healthcare: application to glucose prediction for
diabetic people. _Comput. Meth. Prog. Biomed._ 199, 105874 (2021). Article Google Scholar * Mirshekarian, S., Shen, H., Bunescu, R. & Marling, C. Lstms and neural attention models for
blood glucose prediction: Comparative experiments on real and synthetic data. In _2019 41st Annual International Conference of the IEEE Engineering in Medicine and Biology Society (EMBC)_,
706–712 (IEEE, 2019). * Kaur, H., Pannu, H. S. & Malhi, A. K. A systematic review on imbalanced data challenges in machine learning: applications and solutions. _ACM Comput. Surv._ 52,
1–36 (2019). Google Scholar * Haixiang, G. et al. Learning from class-imbalanced data: review of methods and applications. _Expert Syst. Appl._ 73, 220–239 (2017). Article Google Scholar
* Fernández, A. et al. _Learning from Imbalanced Data Sets_ (Springer, 2018). * Krawczyk, B. Learning from imbalanced data: open challenges and future directions. _Prog. Artif. Intell._ 5,
221–232 (2016). Article Google Scholar * Chung, J., Gulcehre, C., Cho, K. & Bengio, Y. Empirical evaluation of gated recurrent neural networks on sequence modeling. _NIPS 2014 Workshop
on Deep Learning, December 2014_ (2014). * Gehring, J., Auli, M., Grangier, D., Yarats, D. & Dauphin, Y. N. Convolutional sequence to sequence learning. In _Proceedings of the 34th
International Conference on Machine Learning_, 1243–1252 (Sydney, Australia. 2017). * Vaswani, A. et al. Attention is all you need. _Advances in neural information processing systems_
5998–6008 (2017). * Guo, Y. et al. Spottune: transfer learning through adaptive fine-tuning. In _Proceedings of the IEEE/CVF Conference on Computer Vision and Pattern Recognition_, 4805–4814
(The Computer Vision Foundation, Long Beach, CA, USA. 2019). * Zhang, H., Cisse, M., Dauphin, Y. N. & Lopez-Paz, D. Mixup: beyond empirical risk minimization. In _International
Conference on Learning Representations_ (Proceedings of Machine Learning Research, Stockholmsmässan, Stockholm, Sweden. 2018). * Yoon, J., Jarrett, D. & van der Schaar, M. Time-series
generative adversarial networks. _33rd Conference on Neural Information Processing Systems_ _(NeurIPS 2019)_ 5508–5518 (Vancouver, Canada, 2019). * Wu, S., Zhang, H., Valiant, G. & Re,
C. the generalization effects of linear transformations in data augmentation. _International Conference on Machine Learning_ 10410–10420 (PMLR, 2020). * Marling, C. & Bunescu, R. _The
ohiot1dm Dataset for Blood Glucose Level Prediction: Update 2020_. (KHD@ IJCAI, 2020). * Torres-Soto, J. & Ashley, E. A. Multi-task deep learning for cardiac rhythm detection in wearable
devices. _NPJ Digital Med._ 3, 1–8 (2020). Article Google Scholar * Rajpurkar, P., Hannun, A. Y., Haghpanahi, M., Bourn, C. & Ng, A. Y. Cardiologist-level arrhythmia detection with
convolutional neural networks. Preprint at https://arxiv.org/abs/1707.01836arXiv (2017). * Acharya, U. R., Oh, S. L., Hagiwara, Y., Tan, J. H. & Adeli, H. Deep convolutional neural
network for the automated detection and diagnosis of seizure using eeg signals. _Comput. Biol. Med._ 100, 270–278 (2018). Article PubMed Google Scholar * Kim, D. & Kim, K. Detection
of early stage alzheimer’s disease using eeg relative power with deep neural network. In _2018 40th Annual International Conference of the IEEE Engineering in Medicine and Biology Society
(EMBC)_, 352–355 (IEEE, Honolulu, HI, USA. 2018). * Cox, D. J., Gonder-Frederick, L., Ritterband, L., Clarke, W. & Kovatchev, B. P. Prediction of severe hypoglycemia. _Diabetes Care_ 30,
1370–1373 (2007). Article PubMed Google Scholar * Farrell, C. M., McNeilly, A. D., Hapca, S. M. & McCrimmon, R. J. Real-time continuous glucose monitoring during a
hyperinsulinemic-hypoglycemic clamp significantly underestimates the degree of hypoglycemia. _Diabetes Care_ 43, e142–e143 (2020). Article PubMed PubMed Central Google Scholar * Khadem,
H., Nemat, H., Elliott, J. & Benaissa, M. In (eds Bach, K., Bunescu, R., Marling, C. & Wiratunga, N.) _Knowledge Discovery in Healthcare Data 2020_, Vol. 2675, 152–156 (CEUR Workshop
Proceedings, 2020). * Bevan, R. & Coenen, F. In (eds Bach, K., Bunescu, R., Marling, C. & Wiratunga, N.) _Knowledge Discovery in Healthcare Data 2020_, Vol. 2675, 100–104 (CEUR
Workshop Proceedings, 2020). * Joedicke, D. et al. In (eds Bach, K., Bunescu, R., Marling, C. & Wiratunga, N.) _Knowledge Discovery in Healthcare Data 2020_, Vol. 2675, 147–151 (CEUR
Workshop Proceedings, 2020). * Ma, N. et al. In (eds Bach, K., Bunescu, R., Marling, C. & Wiratunga, N.) _Knowledge Discovery in Healthcare Data 2020_, Vol. 2675, 157–161 (CEUR Workshop
Proceedings, 2020). * Um, T. T. et al. Data augmentation of wearable sensor data for parkinson’s disease monitoring using convolutional neural networks. In _Proceedings of the 19th ACM
International Conference on Multimodal Interaction_, ICMI ’17, 216-220 (Association for Computing Machinery, New York, NY, USA, 2017). * Cheng, J. Y., Goh, H., Dogrusoz, K., Tuzel, O. &
Azemi, E. Subject-aware contrastive learning for biosignals. Preprint at https://arxiv.org/abs/2007.04871 (2020). * Abedin, A., Ehsanpour, M., Shi, Q., Rezatofighi, H. & Ranasinghe, D.
C. Attend and discriminate: beyond the state-of-the-art for human activity recognition using wearable sensors. Preprint at https://arxiv.org/abs/2007.07172arXiv (2020). * Brownlee, M. The
pathobiology of diabetic complications: a unifying mechanism. _Diabetes_ 54, 1615–1625 (2005). Article CAS PubMed Google Scholar * Forbes, J. M. & Cooper, M. E. Mechanisms of
diabetic complications. _Physiol. Rev._ 93, 137–188 (2013). Article CAS PubMed Google Scholar * Mirshekarian, S., Bunescu, R., Marling, C. & Schwartz, F. Using LSTMs to learn
physiological models of blood glucose behavior. In _2017 39th Annual International Conference of the IEEE Engineering in Medicine and Biology Society (EMBC)_, 2887–2891 (International
Convention Center (ICC), Jeju Island, Korea, 2017). * Mhaskar, H. N., Pereverzyev, S. V. & van der Walt, M. D. A deep learning approach to diabetic blood glucose prediction. _Front.
Appl. Math. Stat._ 3, 14 (2017). Article Google Scholar * Hochreiter, S. & Schmidhuber, J. Long short-term memory. _Neural Comp._ 9, 1735–1780 (1997). Article CAS Google Scholar *
Pedregosa, F. et al. Scikit-learn: Machine learning in Python. _J. Mach. Learn. Res._ 12, 2825–2830 (2011). Google Scholar * Bahdanau, D., Cho, K. & Bengio, Y. Neural machine
translation by jointly learning to align and translate. _3rd International Conference on Learning Representations, ICLR 2015; Conference date: 07-05-2015 through 09-05-2015_ (2015). * Gupta,
P., Malhotra, P., Narwariya, J., Vig, L. & Shroff, G. Transfer learning for clinical time series analysis using deep neural networks. _J. Healthc. Inform. Res._ 4, 112–137 (2020).
Article PubMed Google Scholar * Sun, Y., Kamel, M. S., Wong, A. K. & Wang, Y. Cost-sensitive boosting for classification of imbalanced data. _Pattern Recognit._ 40, 3358–3378 (2007).
Article Google Scholar * He, H. & Garcia, E. A. Learning from imbalanced data. _IEEE Trans. Knowl. Data Eng._ 21, 1263–1284 (2009). Article Google Scholar Download references
ACKNOWLEDGEMENTS We would like to thank Reviewer 1 for suggesting the public dataset OhioT1DM for re-evaluation of our work. G.E.K. would like to acknowledge support by NIH U01HL142518 and
R01HL154150. C.S.M. would like to acknowledge support by NIH DK081913. C.S.M. and V.N. would like to acknowledge support by NIA 1R01-AG-0287601. AUTHOR INFORMATION Author notes * These
authors contributed equally: Yixiang Deng, Lu Lu. AUTHORS AND AFFILIATIONS * School of Engineering, Brown University, Providence, RI, 02912, USA Yixiang Deng & George Em Karniadakis *
Department of Chemical and Biomolecular Engineering, University of Pennsylvania, Philadelphia, PA, 19104, USA Lu Lu * Department of Medicine, Beth Israel Deaconess Medical Center, Harvard
Medical School, Boston, MA, 02215, USA Laura Aponte, Angeliki M. Angelidi, Vera Novak & Christos S. Mantzoros * Division of Applied Mathematics, Brown University, Providence, RI, 02912,
USA George Em Karniadakis * VA Boston Healthcare System, Harvard Medical School, Boston, MA, 02215, USA Christos S. Mantzoros Authors * Yixiang Deng View author publications You can also
search for this author inPubMed Google Scholar * Lu Lu View author publications You can also search for this author inPubMed Google Scholar * Laura Aponte View author publications You can
also search for this author inPubMed Google Scholar * Angeliki M. Angelidi View author publications You can also search for this author inPubMed Google Scholar * Vera Novak View author
publications You can also search for this author inPubMed Google Scholar * George Em Karniadakis View author publications You can also search for this author inPubMed Google Scholar *
Christos S. Mantzoros View author publications You can also search for this author inPubMed Google Scholar CONTRIBUTIONS G.E.K. and C.S.M. supervised the work and formulated the problem.
Y.D., L.L., C.S.M. and G.E.K. developed the model. Y.D. implemented the computer code. Y.D. and L.L. performed computations. A.M.A., L.A., V.N., C.S.M. contributed the patient data analyzed
herein. Y.D., L.L., C.S.M. and G.E.K. analyzed data. Y.D., L.L., A.M.A., L.A., V.N., C.S.M. and G.E.K. wrote the paper. Y.D. and L.L. contributed equally to this work. CORRESPONDING AUTHORS
Correspondence to George Em Karniadakis or Christos S. Mantzoros. ETHICS DECLARATIONS COMPETING INTERESTS The authors declare no competing interests. ADDITIONAL INFORMATION PUBLISHER’S NOTE
Springer Nature remains neutral with regard to jurisdictional claims in published maps and institutional affiliations. SUPPLEMENTARY INFORMATION SUPPLEMENTAL MATERIAL REPORTING SUMMARY
RIGHTS AND PERMISSIONS OPEN ACCESS This article is licensed under a Creative Commons Attribution 4.0 International License, which permits use, sharing, adaptation, distribution and
reproduction in any medium or format, as long as you give appropriate credit to the original author(s) and the source, provide a link to the Creative Commons license, and indicate if changes
were made. The images or other third party material in this article are included in the article’s Creative Commons license, unless indicated otherwise in a credit line to the material. If
material is not included in the article’s Creative Commons license and your intended use is not permitted by statutory regulation or exceeds the permitted use, you will need to obtain
permission directly from the copyright holder. To view a copy of this license, visit http://creativecommons.org/licenses/by/4.0/. Reprints and permissions ABOUT THIS ARTICLE CITE THIS
ARTICLE Deng, Y., Lu, L., Aponte, L. _et al._ Deep transfer learning and data augmentation improve glucose levels prediction in type 2 diabetes patients. _npj Digit. Med._ 4, 109 (2021).
https://doi.org/10.1038/s41746-021-00480-x Download citation * Received: 18 January 2021 * Accepted: 21 June 2021 * Published: 14 July 2021 * DOI: https://doi.org/10.1038/s41746-021-00480-x
SHARE THIS ARTICLE Anyone you share the following link with will be able to read this content: Get shareable link Sorry, a shareable link is not currently available for this article. Copy to
clipboard Provided by the Springer Nature SharedIt content-sharing initiative