- Select a language for the TTS:
- UK English Female
- UK English Male
- US English Female
- US English Male
- Australian Female
- Australian Male
- Language selected: (auto detect) - EN
Play all audios:
An understanding of the molecular features associated with prostate cancer progression (PCa) and resistance to hormonal therapy is crucial for the identification of new targets that can be
utilized to treat advanced disease and prolong patient survival. The glycome, which encompasses all sugar polymers (glycans) synthesized by cells, has remained relatively unexplored in the
context of advanced PCa despite the fact that glycans have great potential value as biomarkers and therapeutic targets due to their high density on the cell surface. Using imaging mass
spectrometry (IMS), we profiled the N-linked glycans in tumor tissue derived from 131 patients representing the major disease states of PCa to identify glycosylation changes associated with
loss of tumor cell differentiation, disease remission, therapy resistance and disease recurrence, as well as neuroendocrine (NE) differentiation which is a major mechanism for therapy
failure. Our results indicate significant changes to the glycosylation patterns in various stages of PCa, notably a decrease in tri- and tetraantennary glycans correlating with disease
remission, a subsequent increase in these structures with the transition to therapy-resistant PCa, and downregulation of complex N-glycans correlating with NE differentiation. Furthermore,
both nonglucosylated and monoglucosylated mannose 9 demonstrate aberrant upregulation in therapy-resistant PCa which may be useful therapeutic targets as these structures are not normally
presented in healthy tissue. Our findings characterize changes to the tumor glycome that occur with hormonal therapy and the development of castration-resistant PCa (CRPC), identifying
several glycan markers and signatures which may be useful for diagnostic or therapeutic purposes.
Prostate Cancer (PCa) is the most common non-cutaneous malignancy and a leading cause of cancer-related mortality in men over the age of 501. Early stage, organ confined PCa has a high cure
rate but some patients will experience disease recurrence after radical treatment2 which requires hormonal therapy to inhibit androgen receptor (AR) activity3,4. AR-targeted treatment is
initially effective but inevitably leads to the development of castration resistant PCa (CRPC)4. Approximately 20% of CRPC is histologically classified as small cell neuroendocrine carcinoma
(SCNC, also known as CRPC-NE) which is highly lethal5.
Many studies have sought to profile the molecular changes associated with PCa progression, therapy resistance, and NE differentiation5,6,7,8,9, most of which have focused on changes in the
genome, transcriptome, proteome, epigenome, and metabolome. In contrast, the glycome, which comprises all of the sugar polymers (glycans) synthesized by cells, has remained relatively
unexplored in many cancer settings including PCa despite the fact that aberrant glycosylation is a well-known hallmark of cancer10 and the prostate is a major secretor of glycoproteins11. So
far, studies on the PCa tumor glycome12,13,14 have only evaluated early stage disease or, in the setting of CRPC, changes in the serum glycome15,16, mostly because advanced PCa tissue is
usually not available because the tissue is rarely biopsied or resected at this stage of the disease. Unfortunately, changes in the serum glycome are not necessarily tumor derived as
systemic hormonal therapy has effects on many tissue types. Therefore, there remains an urgent, unmet need, to study changes to the PCa tumor glycome in order to better define the biology of
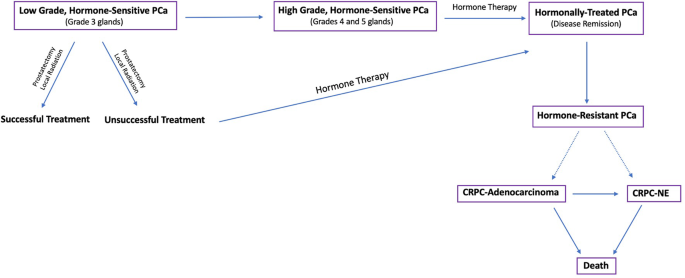
disease progression (Fig. 1) and discover better diagnostic markers and therapeutic targets.
Flow diagram depicting the progression and treatment of PCa from low grade, hormone-sensitive PCa to late stage, hormone-resistant tumors.
The development of N-glycan imaging mass spectrometry in 2013 (IMS)17,18 has provided great advance to the field of glycobiology19,20,21,22,23,24,25 and allows glycans to be profiled
directly on formalin-fixed, paraffin-embedded (FFPE) tissue specimens from patients. This approach allows tumor regions to be annotated and glycans to be studied within these pure tumor
regions without interfering signals from the surrounding stroma and benign tissue enabling the discovery of tumor-specific changes and molecular targets17,26. In this study, we used a
combination of tissue microarray (TMA) and whole-slide cases to profile tumor regions derived from 131 patients, including hormone-sensitive PCa (n = 84 patients), hormonally-treated PCa (n
= 37 patients), CRPC-adenocarcinoma (n = 5 patients), and CRPC-NE (n = 5 patients). In addition to studying glycosylation changes throughout the disease spectrum from early,
hormone-sensitive to late, therapy-resistant tumors, we compared histologically heterogeneous tumors (low-grade vs. high-grade, adenocarcinoma vs. SCNC) to determine glycosylation changes
associated with tumor heterogeneity within the same patients. Our studies seek to model the glycobiology of advanced, therapy-resistant PCa utilizing IMS for accomplishing such a task. In
this process, we discovered novel molecular mechanisms and glycan biomarkers associated with commonly used hormonal therapy as well as therapy resistance, nominating potential therapeutic
targets that may benefit patients who have exhausted currently available therapeutic options.
In early-stage, hormone-sensitive PCa, the biologic behavior is determined by the degree of glandular differentiation, pathologically known as Gleason patterns (or Gleason grades)27. To
determine glycosylation changes associated with tumor behavior, we surveyed four patients with hormone-sensitive adenocarcinoma that had discrete, well-circumscribed regions within each
tumor representing either well-differentiated glands (Gleason pattern 3) or poorly-differentiated glands (Gleason patterns 4 and 5).
Multiple regions from each tumor representing different tumor grades were selected for glycome profiling (Fig. 2a and Supplementary Fig. 2). We first performed a statistical comparison (see
Methods) of all detected glycans between well-differentiated tumor regions (n = 40) and poorly-differentiated tumor regions (n = 25) across all patients. Interestingly, only 2/150 glycans
detected by IMS (Gal3Fuc2Man3GlcNAc6 (2361.8560 m/z) and Gal3Fuc1Neu5Ac1Man3GlcNAc6 (2528.8833 m/z)) demonstrated a statistically significant change (Fig. 2b, c), with both structures
downregulated in poorly-differentiated tumor regions. In order to account for correlation within each patient, we built a multi-level model (mixed effects model) with individual patients
considered to be a random effect. Both 2361.8560 m/z and 2528.8833 m/z remained highly significant (p = 6.57 × 10⁻⁵ and 1.1 × 10⁻⁵, respectively) indicating that loss of these structures is
associated with loss of gland differentiation in early stage PCa.
Both structures are triantennary glycans containing bisecting N-acetylglucosamine (GlcNAc) and core fucose, with 2361.8560 m/z containing an outer arm fucose and 2528.8844 m/z containing a
terminal sialic acid. Importantly, their loss of abundance in combination predicted poorly-differentiated tumor regions (AUC = 0.7700) (Fig. 2d). The surprisingly low number of significantly
changed glycans suggests that there is either a very minimal change in N-glycosylation with loss of gland differentiation or that there is a high degree of interpatient variability with
these two glycans representing the most consistent change across all patients studied. Indeed, intratumoral analysis of each patient tumor demonstrated a high degree of variability. Both
patients 1 and 4 demonstrated minimal change detectable by T-test with Patient 1 demonstrating a high degree of upregulation of two hybrid structures (1136.3964 m/z and 1282.4543 m/z) and a
core fucosylated paucimannose structure (1079.3749 m/z) (Supplementary Fig. 3). Alternatively, Patients 2 and 3 exhibited highly significant change between well-differentiated and
poorly-differentiated tumor regions. Patient 2 demonstrated 25/150 glycans showing significant change, with 24 structures upregulated and 1 hybrid structure (1460.5020 m/z) downregulated
(Supplementary Fig. 3) in poorly-differentiated regions. In this patient, the vast majority of glycans upregulated were tri- and tetraantennary glycans containing core fucose, with the
majority of upregulated triantennary glycans also containing bisecting N-acetylglucosamine (GlcNAc) (Supplementary Fig. 3). In Patient 3, 83/150 glycans demonstrated significant change, with
30 structures upregulated and 53 structures downregulated in poorly-differentiated tumor regions (Supplementary Fig. 3). Upregulated glycans consisted mostly of hybrid and complex type
glycans, with a higher proportion of biantennary structures (Supplementary Fig. 3). Downregulated glycans were mostly tri- and tetraantennary structures, with most triantennary glycans
containing bisecting GlcNAc, an opposite trend to what was observed with patient 2 (Supplementary Fig. 3).
In conclusion, both Gal3Fuc2Man3GlcNAc6 (2361.8560 m/z) and Gal3Fuc1Neu5Ac1Man3GlcNAc6 (2528.8833 m/z) demonstrate consistently lower abundance in poorly-differentiated tumor regions across
all patients tested. This experiment also demonstrates a high degree of interpatient variability when comparing glycans associated with loss of gland differentiation, both in regards to the
amount of glycosylation affected and the specific classes of structures affected.
a Table demonstrating the number of annotated well-differentiated and poorly differentiated tumor regions for each patient. b Volcano plot comparison of all glycans in annotated
well-differentiated tumor regions (n = 40) and annotated poorly differentiated tumor regions (n = 25) with 2361.8560 m/z and 2528.8833 m/z showing statistical significance between the two
groups. c Scatter plot comparison of Gal3Fuc2Man3GlcNAc6 and Gal3Fuc1Neu5Ac1Man3GlcNAc6 between all well differentiated (n = 40) and poorly differentiated (n = 25) tumor regions. Statistics
performed between each group by multiple, unpaired t test with p