- Select a language for the TTS:
- UK English Female
- UK English Male
- US English Female
- US English Male
- Australian Female
- Australian Male
- Language selected: (auto detect) - EN
Play all audios:
ABSTRACT This study quantifies the influence of the pattern of sea surface temperature change in the tropical Pacific on tropical cyclone hazard. After downscaling a climate model with an
“El Niño-like” forced response, it is found that the “El Niño-like” pattern of warming induces an “El Niño-like” change to tropical cyclone hazard. The magnitude of hazard change owing to
the “El Niño-like” pattern of warming is estimated to be around the same order of magnitude as that driven by the forced response that does not project onto the same pattern of warming,
highlighting the sensitivity of local tropical cyclone hazard to the pattern of warming. Given the uncertainty around the future pattern of Pacific warming, a storyline with a “La Niña-like”
pattern of warming, of similar magnitude to the observations, is created. In this scenario, near-term tropical cyclone hazard over coastal Asia and the Atlantic basin significantly
increases. SIMILAR CONTENT BEING VIEWED BY OTHERS WARMING-INDUCED CONTRACTION OF TROPICAL CONVECTION DELAYS AND REDUCES TROPICAL CYCLONE FORMATION Article Open access 07 October 2023 SHIFTS
OF FUTURE TROPICAL CYCLONE GENESIS DATE IN NORTH ATLANTIC AND NORTH PACIFIC BASINS: AN ENSEMBLE MODELING INVESTIGATION Article Open access 14 May 2025 SUBSEASONAL CONTROLS OF U.S.
LANDFALLING TROPICAL CYCLONES Article Open access 10 August 2022 INTRODUCTION Tropical cyclones (TCs) bring about extreme winds, rain, and storm surge to coastal locations, and are
responsible for billions of dollars of damage per year1. Research has shown that TC hazard, and consequently damage, will increase with anthropogenic emissions, threatening prone coastal
communities1,2,3. Communities that are resilient to hazards up to the 1-in-100-year event, for instance, would be at risk if the 1-in-150-year event increases in frequency to the
1-in-75-year event. Thus, it is important to understand how local TC hazard changes with anthropogenic emissions, so that community leaders can make informed decisions with regards to local
climate adaptation. Recent research has shown a large discrepancy between the historical observed and modeled patterns of warming in the tropical Pacific. While climate models simulate a
_decrease_ in the equatorial zonal SST gradient with warming, observations have shown a notable _increase_ in the equatorial zonal SST gradient over the recent half-century4,5,6. Preliminary
studies have suggested that there may be great sensitivity of the projected TC response to whether climate models have a future “El Niño-like” response (i.e., reduced equatorial zonal SST
gradient), or a “La Niña-like” response (i.e., increased equatorial zonal SST gradient)7. Given that many aspects of TC behavior have been found to be modulated by the El Niño-Southern
Oscillation (ENSO), which strongly modifies the tropical Pacific zonal SST gradient8,9,10,11, it is important to understand how, and to what degree, TC hazard will respond to patterns of
warming that change the mean-state equatorial zonal SST gradient. At present, there is a large degree of uncertainty surrounding the response of the tropical Pacific to anthropogenic
emissions12. In this study, we aim to understand how TC hazard responds to natural and forced patterns of warming. Here, natural patterns of warming are defined as those occurring through
natural variability, while forced patterns of warming are those occurring through anthropogenic forcing. First, we confirm that SST patterns arising through natural variability - namely ENSO
- can significantly modulate TC hazard. Second, we decompose future TC hazard changes into that owing to the forced response of the tropical Pacific zonal SST gradient, and that owing to
the forced response that is orthogonal to trends in the tropical Pacific zonal SST gradient. We show that the former can be comparable in magnitude to the latter, suggesting that regional
patterns of SST change could play a major role in determining TC hazard in a changing climate. RESULTS TROPICAL CYCLONE DOWNSCALING We use output from the pre-industrial control (PI-control)
run of the Community Earth System Model version 2 (CESM2), as well as output from the first 10 ensemble members of the CESM2 Large Ensemble Community Project (LENS2)13. CESM2-LENS2
simulations cover the time period of 1850-2100, using historical forcing and SSP370 future radiative forcing, following CMIP6 protocol14. CESM2-LENS2 is run at a nominal 1° horizontal
resolution, which is inadequate to properly resolve the most intense TCs15. Thus, we use the open-source TC downscaling model of Lin et al. (2023)16 to downscale CESM2-LENS2 and generate a
large event set of synthetic TCs (Methods). On a high level, the downscaling model works by randomly seeding weak vortices in space and time, evolving their track using the
beta-and-advection model17, and simulating their intensity using a statistical-physical intensity model18. We also downscale the ERA5 reanalysis from 1979–202319 to benchmark with
observations (Methods). We focus on the boreal summer TC season, though our methods can be easily applied to the Austral TC season. To diagnose the ENSO state and magnitude, we use the
July-August-September-October (JASO) averaged Niño3.4 index20 (“Methods”). We also use the JASO-averaged east minus west (E-W) index to quantify the equatorial zonal SST gradient6
(“Methods”). This index measures the SST difference between the equatorial eastern and western Pacific, and is highly correlated with Niño-3.4 in both HadISST (_r_ = 0.90) and the CESM2
PI-control runs (_r_ = 0.78). The E-W index is computed with respect to the E-W index climatology over the PI-control run. In this study, we focus on wind hazards at a fixed point in space.
While this can be estimated by resolving the full wind field of each synthetic TC and interpolating the TC-induced wind hazard at each fixed point, it is not straightforward to compare the
modeled wind hazard with observations. Instead, we follow21, estimating the return period of local TC wind hazard by obtaining the intensity of all storms that pass within 100 km of a
particular point of interest. This method allows for an easier comparison between models and observations, as TC intensity is better observed than point-wise wind speed. However, evaluating
local TC hazards requires a large sample set, and thus this approach depends heavily on the computationally inexpensive TC downscaling model. We use the USA best-track estimates of intensity
in the IBTrACS observational dataset (1979–2023) to benchmark the model’s estimates of TC wind hazard22. THE INFLUENCE OF INTERNAL VARIABILITY ON TROPICAL CYCLONE HAZARD To begin, we first
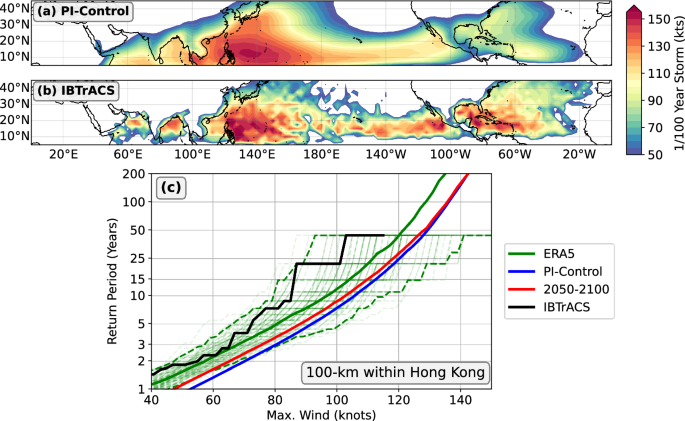
qualitatively compare TC hazard, as represented among the downscaled events in CESM2-PI, with that estimated from the observations. Figure 1a, shows the intensity of the 1-in-100-year storm
in the CESM2 PI-control period, while the intensity of the strongest storm within 100-km of a point in IBTrACS is shown in Fig. 1b. The overall structure of observed TC hazard is
qualitatively reproduced by the CESM2 PI-control downscaling, though there is a negative bias in the Atlantic and Eastern Pacific basins. Next, we turn to our metric of local TC hazard and
show that the downscaling model can reasonably reproduce local TC hazard as estimated from the observations. Figure 1c shows the return period curve for the maximum intensity of TCs that
pass within 100 km within Hong Kong. We observe that TC wind hazard, as represented by the ERA5 downscaled tracks, is relatively similar to that estimated from IBTrACS. In order to account
for sampling error in the historical events, we sub-sample the total ERA5 event set to the same size as the number of TCs in the observations, as shown in the green curves in Fig. 1c. This
exercise shows that the modeled TC hazard is reasonable when considering sampling error, though the downscaling model likely has an intensity or frequency bias at Hong Kong. Finally, we
compare the TC wind hazard inferred from the CESM2 PI-control downscaled tracks. The modeled TC wind hazard is slightly larger than that in ERA5, which could be owing to model biases in both
the steering flow and thermodynamic environment. How is TC wind hazard modulated by internal variability? We henceforth focus on ENSO, as it is the most dominant tropical mode of internal
variability. However, there are a few modes of natural variability that have been proposed to modulate TC behavior across the globe, such as Pacific Decadal Variability23 or the Pacific
Meridional Mode24,25. However, it is infeasible to condition the local return period hazard on the phase of ENSO using historical observations or observation-based data sets (i.e., best
track or reanalysis) alone, due to the small sample size of the historical observations/reanalyzes. In contrast, the 1000-year PI-control run allows us to calculate TC hazard, conditioning
on the phase of ENSO, without significantly sacrificing sample size (see Methods). Figure 2a–d shows the spatial pattern of the frequency of the 1-in-100-year storm separated into ENSO
states. During strong La Niña events, the hazard in the West Pacific and North Atlantic increases, and vice-versa during strong El Niño events. We observe that the downscaling model applied
to the CESM2 PI-control period qualitatively reproduces the observed relationship between TC activity and ENSO8,11,26,27. As can be inferred from Fig. 2a–d, the state of ENSO significantly
modulates the local TC wind hazard. As shown in Fig. 2e, during neutral ENSO years, the 1-in-100-year storm at Hong Kong has an intensity of approximately 135-knots, while during strong La
Niña events and strong El Niño events, a 135-knot storm has a return period of around 30 years and 300 years, respectively, around an order of magnitude modulation of the TC wind hazard. One
caveat here is that in the downscaled tracks, the TC frequency in the West Pacific depends on the ENSO state; this relationship is not found in the observations (Fig. S6). However, only a
portion of the total wind hazard modulation by ENSO is controlled by TC frequency (Fig. S1). Thus, these results are robust to model biases in the sensitivity of TC frequency to ENSO state.
These results show that ENSO, which generates SST patterns as a consequence of internal atmosphere-ocean dynamics, plays a significant role in modulating local TC hazards. Would a long-term
forced trend of the tropical Pacific towards an “El Niño-like” or “La Niña-like” mean-state consequently alter future TC wind hazard similarly? THE INFLUENCE OF WARMING PATTERNS ON TROPICAL
CYCLONE HAZARD How is local TC hazard projected to change at the end of the 21st century? Figure 1c shows that at Hong Kong, the 2050–2100 TC hazard barely changes from that during
pre-industrial conditions. This result is not unique to Hong Kong–the total hazard is modeled to _decrease_ in many regions with global warming (Fig. 3a), despite increases in the potential
intensity (Fig. S4). In our downscaling projections, there is very little change to the global TC frequency between the pre-industrial and the 2050–2100 periods (Fig. S2). Thus, at least in
this model, the decrease in TC hazard in spite of global warming cannot be purely due to a decrease in TC frequency. There is, however, significant uncertainty in global frequency when one
considers multiple models28,29. It turns out that a large fraction of TC hazard change is linked to the modeled pattern of warming in the Pacific. In CESM2-LENS2, there is an “El Niño-like”
trend in response to anthropogenic emissions; the SST gradient between the West and East Pacific decreases by around 1 K through 2050–2100 (Fig. S5). In order to understand how the SST
pattern trend affects TC hazard projections, we decompose changes in the total future TC wind hazard, Δ_H_total, into: $$\Delta {H}_{{\rm{total}}}=\Delta {H}_{P}+\Delta {H}_{\not P}$$ (1)
where Δ_H__P_ and Δ_H__/P_ are the hazard changes between the pre-industrial period and 2050–2100 that are, respectively, attributable, and not attributable, to changes in the equatorial
Pacific zonal SST gradient. Given Δ_H_total and Δ_H__/P_, we can infer Δ_H__P_ using Eq. (1). We estimate Δ_H__/P_ by calculating the return period curve of TC hazard only during years where
the E-W index falls under a small, fixed range of values. For example, Fig. 3b shows the spatial pattern of Δ_H__/P_, conditioning on the E-W index range of [−0.5, 0.5], which constrains
the event set to those during years where the E-W index is close to its climatological value under pre-industrial conditions. The results are not sensitive to the exact range used, as long
as the range is small and sufficiently sampled in both pre-industrial and future climates (Fig. S3). We observe that Δ_H__/P_ is positive in most of the West Pacific basin, with a more
complicated multi-signed pattern in the Atlantic basin. The spatial pattern of Δ_H__P_ is shown in Fig. 3c, using Eq. (1). By construction, the pattern of Δ_H__P_ bears a strong resemblance
to that of El Niño (Fig. 2d), namely that the intensity of the 1-in-100-year storm reduces over the Northwest Pacific and Atlantic regions. These results suggest that the modeled Pacific SST
pattern of warming induces a change to the pattern of TC hazard that strongly resembles that which is induced by El Niño. Comparing Fig. 3b and c, we also observe that Δ_H__P_ is generally
around the same order of magnitude as Δ_H__/P_. In fact, in many regions along coastal Asia, the former is larger in magnitude (and opposite in sign) than the latter. In other words, in
these regions, the SST pattern effect could act to offset increases to TC hazard owing to other factors (such as a global increase in potential intensity). Of course, the magnitude of
Δ_H__P_ will depend on the strength of the trend in the equatorial zonal SST gradient, and this has a wide range across the available ensemble climate models, both over the historical period
and in the future6,12,30. In addition, while the CESM2-LENS2 downscaling shows no significant change in TC frequency with warming (Fig. S2), an increase or decrease in TC frequency would
respectively amplify or reduce the TC hazard change not attributable to the patterns of warming. It is also important to stress that the pattern of Δ_H__P_ (Fig. 3c) looks like an ENSO
signal by construction. However, the pattern of Δ_H__/P_ (Fig. 3b) is not subject to the same constraints. A STORYLINE APPROACH TO FUTURE WARMING PATTERNS There is compelling evidence
emerging in recent studies that shows that the “El Niño-like" pattern of warming in climate models may be incorrect5,31,32. This implies that projections of regional tropical cyclone
activity may be incorrect as well. To understand how an increase in the equatorial Pacific zonal SST gradient affects near-term TC hazard, we use the storyline approach, in which one works
through the detailed consequences of a specific, plausible climate trajectory without trying to estimate its probability33. We define near-term as the period between 2020–2060 and assume
that the change in the storyline’s E-W index, or \({\text{EW}}^{{\prime} }\), follows the observed linear trend from 1960-2020 (≈ −0.13 K per decade), and then either (1) stops at 2020 and
stays the same, or (2) continues through 2060. To construct the TC hazard response under the “La Niña-like” storyline, we assume that the TC hazard change per degree of _increase_ in the
CESM2 E-W index can be used to predict the TC hazard change per degree of _decrease_ in the storyline E-W index. The TC hazard change in the storyline is thus obtained by normalizing Δ_H__p_
by the magnitude of the decrease in the E-W index (in the CESM2 simulations), and multiplying it by the desired storyline change in the E-W index. In other words, given a return period of
_n_ years, we take the 2060-2100 TC hazard change attributable to the E-W index (Fig. 3c, for _n_ = 100 years), and normalize it by \(\overline{EW}\), or the 2060–2100 average value of the
E-W index in CESM2-LENS2. 2060–2100 is chosen since the signal in the E-W index change is the largest in that time period (Fig. S5). The local TC hazard change that is not associated with
changes in the E-W is kept the same. Thus, the total hazard change is assumed to follow the form: $$\Delta {H}_{{\rm{total}}}(n,t)={\text{EW}}^{{\prime} }(t)\frac{\Delta
{H}_{P}(n)}{\overline{EW}}+\Delta {H}_{\not P}(n,t)$$ (2) where _t_ is time. Note that \({\text{EW}}^{{\prime} }\) is negative (increase in the E-W temperature gradient), and
\(\overline{EW}\) is positive (decrease in the E-W temperature gradient). There are a few assumptions and limitations to this approach. First, Eq. (2) explicitly assumes linearity in the
relationship between TC wind hazard and the Pacific zonal SST gradient. We also assume that TC frequency is independent of the assumed storyline. Given the large uncertainty in future TC
frequency, this is the “null hypothesis” approach. The reader is referred to Methods for more details on these assumptions. Figure 4 shows the return period of the pre-industrial
1-in-100-year storm in 2020–2060, under the two scenarios. If the observed E-W trend stops at 2020, the 1-in-100-year storm becomes the 1-in-50-year storm over much of coastal Asia. For
example, the 1-in-100-year storm is estimated to return approximately every 55 years at Manila, Philippines—nearly a 2-fold increase in the hazard from pre-industrial conditions. In
contrast, the Atlantic basin has more of a mixed signal, as Δ_H__P_ owing to a “La Niña-like" trend is opposite-signed of Δ_H__/P_. If the trend further continues through 2060, our
estimates show that in some locations, the 1-in-100-year storm during pre-industrial conditions could return as frequently as every 25 years. At Manila, the continuation of the E-W trend
increases the frequency of the 1-in-100-year storm to every 47 years by 2060. DISCUSSION TC intensity has long been projected to increase with anthropogenic emissions since potential
intensity increases with warming34. Subsequently, TC wind hazard is expected to increase, even if there is no change to the global TC frequency. However, after downscaling CESM2 simulations
under an upper-middle future emissions scenario, we find that the TC wind hazard decreases over much of the Western Pacific and Atlantic basins at the end of the 21st century, despite there
being no change to the global TC frequency. We find that much of this projected decrease in TC wind hazard is attributable to a reduction in the mean equatorial zonal SST gradient pattern,
which induces an “El Niño-like” hazard change—decreased TC hazard in both the Western Pacific and Atlantic basins. Given the discrepancy between historical observed and modeled patterns of
warming in the tropical Pacific, we also use the storyline approach to understand how near-term TC wind hazards in a warming world that has trended and continues towards a “La Niña-like”
state. In this case, TC wind hazard dramatically increases over much of East Asia. These results show that the SST pattern effect significantly contributes to TC wind hazard in a changing
climate. We find that changes in regional SST of around 1.5° have around the same effect on TC wind hazard as more than 4° of tropical-averaged warming (Fig. S5). These results are perhaps
unsurprising given the greater efficiency by which regional SST perturbations modulate TC-related variables, as compared to global SST perturbations, owing to the large deformation radius of
the tropics35,36. In this study, we focused on natural and forced SST patterns in a single model ensemble. As a result, we only used one climate model, one emissions scenario, and one TC
downscaling model. Future work would be prudent to understand the full range of uncertainty using a variety of models. Nevertheless, we argue that warming _patterns_ (and not just the
warming magnitude) are leading order contributors to future TC wind hazard changes. As a result, it remains of paramount importance for future research to uncover the physical processes that
control the pattern of Pacific warming in response to anthropogenic emissions. METHODS We use output from years 500–1499 (1000 years) of the CMIP6 CESM2 PI-control simulation37. We also use
the ensemble members 1–10 of the CESM2-LENS2 project13. The 10 ensemble members are initialized from the PI-control simulations, starting at year 1000, in increments of 20 years (1021,
1041, 1061, etc.). Both the CESM2 PI-control and CESM2-LENS2 simulations have a nominal grid resolution of 1°. We use the open-source TC downscaling model of16, a derivative of the MIT TC
downscaling model38,39, to downscale CESM2-LENS2. The model works by randomly seeding in space and time weak protovortices and then evolves them in time according to the beta-and-advection
model17 and the FAST intensity model18. The downscaling model takes as input monthly-mean vertical profiles of temperature and specific humidity, monthly-mean surface pressure and
sea-surface temperature, and monthly-mean upper- (250-hPa) and lower- (850-hPa) zonal/meridional winds. The covariance between daily-averaged, upper, and lower-level winds, is also required
to generate synthetic time series of environmental winds. To diagnose the ENSO phase in Fig. 2, we use the Niño3.4 index, defined as the average SST in region defined by the box of 5°S-5°N,
and 170°W-120°W20. The reference state used for the index is the entire 1000-year PI-control period. Since ENSO has a positive amplitude bias in CESM2, we define the ENSO phase and magnitude
using percentiles. (1) Strong La Niña, (2) Weak La Niña, (3) Neutral, (4) Weak El Niño, and (5) Strong El Niño are defined using ENSO events with percentiles in the range of 0th–20th,
20th–33rd, 33rd–67th, 67th–80th, and 80th–100th, respectively40. We average the ENSO index over JASO to align with the peak of the western North Pacific TC season. We also use the E-W index,
defined in ref. 6, to quantify the mismatch in warming between the eastern and western Pacific. The E-W index is computed by subtracting the SST in the range [140°E–170°E, 3°S–3°N] from the
SST in the range [170°W-90°W, 3°S-3°E]. The E-W index is also averaged over JASO. While there are obvious differences between the Niño3.4 index and the E-W index, there is a very high
correlation between the JASO-averaged E-W and Niño-3.4 indices, in both HadISST (_r_ = 0.90) and the CESM2 PI-control runs (_r_ = 0.78). Under warming, a reference state is necessary to
define the ENSO phases using the Niño3.4 index, which can be complicated given the time-varying nature of warming. In contrast, the E-W describes the difference in warming between two parts
of the Pacific basin, and a reference state does not need to be defined. There are a few key assumptions in the storyline approach. First, \(E{W}^{{\prime} }(t)\) is assumed to vary linearly
in time, following each storyline (Fig. 4). Second, we assume linearity in the relationship between TC wind hazard and the Pacific zonal SST gradient. In other words, even though
\(\overline{EW}\) (the 2060-2100 average value of the EW index) is only positive (El Niño-like trend) in CESM2, we use its relationship with Δ_H__p_ to project hazard changes under scenarios
where \(E{W}^{{\prime} }\) is negative (La Niña-like trend). This assumption should hold for “small” values of \(E{W}^{{\prime} }\). We do not have a set of climate model simulations that
show an increase in the equatorial zonal SST gradient in the Pacific, and thus cannot confirm whether this assumption is valid. Thirdly, we assume that Δ_H__/P_ does not have a dependence on
the sign of \(E{W}^{{\prime} }\). This assumption is questionable, especially if climate sensitivity depends on the Pacific SST pattern. In addition, we assume that in the “La
Niña-like" storylines, the annual TC frequency in the West Pacific basin remains unchanged from the TC frequency projected by the CESM2-LENS2 downscaling (the assumed TC frequency is
shown in Fig. S2). Again, we cannot confirm how and to what extent TC frequency would change in a “La Niña-like" world. However, uncertainty in global TC frequency is estimated to be on
the order of −20% to 20%28, which, all else being equal, would change the wind hazard by the same amount. In comparison to the storyline scenarios shown in Fig. 4, the TC wind hazard
changes by around 100%. Finally, for each _n_, Δ_H_total is added to the return period curve under pre-industrial conditions, giving a new return period curve with the effects of both
Δ_H__P_ and Δ_H__/P_ included. The return period of the intensity of the 1-in-100-year storm under pre-industrial conditions can then be computed from these new return period curves. DATA
AVAILABILITY The CESM2 model output used in this study is freely available on the high-performance computing cluster at the National Center for Atmospheric Research. Information on how to
access it is located at https://www.cesm.ucar.edu/community-projects/lens2/data-sets. The TC downscaling model is freely available at https://github.com/linjonathan/tropical_cyclone_risk41.
The daily ERA5 data for zonal and meridional winds are available through the C3S Climate Data Store via https://doi.org/10.24381/cds.bd0915c642. The monthly mean ERA5 temperature and
specific humidity are available via https://doi.org/10.24381/cds.6860a57343. The monthly mean ERA5 data for sea-surface temperature and surface pressure fields are available through the C3S
Climate Data Store via https://doi.org/10.24381/cds.f17050d744. The ERA5 reanalysis data are accessible by creating an account with the Climate Data Store service, and usable according to
ECMWF license to use Copernicus products. The IBTrACS dataset is available online at NOAA via https://doi.org/10.25921/82ty-9e1622. The HadISST dataset is available online at
https://www.metoffice.gov.uk/hadobs/hadisst/45. REFERENCES * Mendelsohn, R., Emanuel, K., Chonabayashi, S. & Bakkensen, L. The impact of climate change on global tropical cyclone damage.
_Nat. Clim. Change_ 2, 205–209 (2012). Article Google Scholar * Gori, A., Lin, N., Xi, D. & Emanuel, K. Tropical cyclone climatology change greatly exacerbates US extreme
rainfall–surge hazard. _Nat. Clim. Change_ 12, 171–178 (2022). Article Google Scholar * Sarhadi, A. et al. Climate change contributions to increasing compound flooding risk in New York
City. _Bull. Am. Meteorol. Soc._ 105, E337–E356 (2024). Article Google Scholar * Coats, S. & Karnauskas, K. Are simulated and observed twentieth century tropical Pacific sea surface
temperature trends significant relative to internal variability? _Geophys. Res. Lett._ 44, 9928–9937 (2017). Article Google Scholar * Seager, R. et al. Strengthening tropical Pacific zonal
sea surface temperature gradient consistent with rising greenhouse gases. _Nat. Clim. Change_ 9, 517–522 (2019). Article Google Scholar * Seager, R., Henderson, N. & Cane, M.
Persistent discrepancies between observed and modeled trends in the tropical Pacific Ocean. _J. Clim._ 35, 4571–4584 (2022). Article Google Scholar * Sobel, A. H. et al. Near-term tropical
cyclone risk and coupled earth system model biases. _Proc. Natl. Acad. Sci._ 120, e2209631120 (2023). Article CAS Google Scholar * Chan, J. C. Tropical cyclone activity in the northwest
Pacific in relation to the El Niño/Southern Oscillation phenomenon. _Mon. Weather Rev._ 113, 599–606 (1985). Article Google Scholar * Wang, B. & Chan, J. C. How strong ENSO events
affect tropical storm activity over the Western North Pacific. _J. Clim._ 15, 1643–1658 (2002). Article Google Scholar * Camargo, S. J. & Sobel, A. H. Western North Pacific tropical
cyclone intensity and ENSO. _J. Clim._ 18, 2996–3006 (2005). Article Google Scholar * Camargo, S. J., Emanuel, K. A. & Sobel, A. H. Use of a genesis potential index to diagnose ENSO
effects on tropical cyclone genesis. _J. Clim._ 20, 4819–4834 (2007). Article Google Scholar * Lee, S. et al. On the future zonal contrasts of equatorial Pacific climate: perspectives from
observations, simulations, and theories. _NPJ Clim. Atmos. Sci._ 5, 82 (2022). Article Google Scholar * Rodgers, K. B. et al. Ubiquity of human-induced changes in climate variability.
_Earth Syst. Dyn._ 12, 1393–1411 (2021). Article Google Scholar * O’Neill, B. C. et al. The scenario model intercomparison project (ScenarioMIP) for CMIP6. _Geosci. Model Dev._ 9,
3461–3482 (2016). Article Google Scholar * Davis, C. Resolving tropical cyclone intensity in models. _Geophys. Res. Lett._ 45, 2082–2087 (2018). Article Google Scholar * Lin, J.,
Rousseau-Rizzi, R., Lee, C.-Y. & Sobel, A. An open-source, physics-based, tropical cyclone downscaling model with intensity-dependent steering. _J. Adv. Model. Earth Syst._ 15,
e2023MS003686 (2023). Article Google Scholar * Marks, D. G. The beta and advection model for hurricane track forecasting. NWS Tech. Memo. NWS NMC 70, Available online at
https://repository.library.noaa.gov/view/noaa/7184 (1992). * Emanuel, K. A fast intensity simulator for tropical cyclone risk analysis. _Nat. Hazards_ 88, 779–796 (2017). Article Google
Scholar * Hersbach, H. The ERA5 Atmospheric Reanalysis. In _AGU Fall Meeting Abstracts_ (2016). * Barnston, A. G., Chelliah, M. & Goldenberg, S. B. Documentation of a highly
ENSO-related SST region in the equatorial Pacific. _Atmosphere–Ocean (Canadian Meteorological & Oceanographic Society)_ 35 (1997). * Emanuel, K. & Jagger, T. On estimating hurricane
return periods. _J. Appl. Meteorol. Climatol._ 49, 837–844 (2010). Article Google Scholar * Knapp, K., Diamond, H., Kossin, J., Kruk, M. & Schreck, C. International best track archive
for climate stewardship (IBTrACS) project (Version 4) (2018). * Moon, I.-J., Kim, S.-H., Klotzbach, P. & Chan, J. C. Roles of interbasin frequency changes in the poleward shifts of the
maximum intensity location of tropical cyclones. _Environ. Res. Lett._ 10, 104004 (2015). Article Google Scholar * Chiang, J. C. & Vimont, D. J. Analogous Pacific and Atlantic
meridional modes of tropical atmosphere–ocean variability. _J. Clim._ 17, 4143–4158 (2004). Article Google Scholar * Zhang, W., Vecchi, G. A., Murakami, H., Villarini, G. & Jia, L. The
Pacific meridional mode and the occurrence of tropical cyclones in the Western North Pacific. _J. Clim._ 29, 381–398 (2016). Article CAS Google Scholar * Dong, K. El niño and tropical
cyclone frequency in the Australian region and the Northwest Pacific. _Aust. Met. Mag._ 36, 219–225 (1988). Google Scholar * Chia, H. H. & Ropelewski, C. The interannual variability in
the genesis location of tropical cyclones in the northwest Pacific. _J. Clim._ 15, 2934–2944 (2002). Article Google Scholar * Knutson, T. et al. Tropical cyclones and climate change
assessment: part II: projected response to anthropogenic warming. _Bull. Am. Meteorol. Soc._ 101, E303–E322 (2020). Article Google Scholar * Roberts, M. J. et al. Impact of model
resolution on tropical cyclone simulation using the HighResMIP–PRIMAVERA multimodel ensemble. _J. Clim._ 33, 2557–2583 (2020). Article Google Scholar * Cai, W. et al. Changing El
Niño–Southern oscillation in a warming climate. _Nat. Rev. Earth Environ._ 2, 628–644 (2021). Article Google Scholar * Wills, R. C., Dong, Y., Proistosecu, C., Armour, K. C. &
Battisti, D. S. Systematic climate model biases in the large-scale patterns of recent sea-surface temperature and sea-level pressure change. _Geophys. Res. Lett._ 49, e2022GL100011 (2022).
Article Google Scholar * Zhuo, J.-Y. et al. A more la niña-like response to radiative forcing after flux adjustment in CESM2. _J. Clim._ 1037–1050 (2024). * Shepherd, T. G. et al.
Storylines: an alternative approach to representing uncertainty in physical aspects of climate change. _Clim. Change_ 151, 555–571 (2018). Article Google Scholar * Emanuel, K. The
dependence of hurricane intensity on climate. _Nature_ 326, 483–485 (1987). Article Google Scholar * Ramsay, H. A. & Sobel, A. H. Effects of relative and absolute sea surface
temperature on tropical cyclone potential intensity using a single-column model. _J. Clim._ 24, 183–193 (2011). Article Google Scholar * Emanuel, K. & Sobel, A. Response of tropical
sea surface temperature, precipitation, and tropical cyclone-related variables to changes in global and local forcing. _J. Adv. Model. Earth Syst._ 5, 447–458 (2013). Article Google Scholar
* Danabasoglu, G. et al. The community earth system model version 2 (CESM2). _J. Adv. Model. Earth Syst._ 12, e2019MS001916 (2020). Article Google Scholar * Emanuel, K. Climate and
tropical cyclone activity: a new model downscaling approach. _J. Clim._ 19, 4797–4802 (2006). Article Google Scholar * Emanuel, K., Sundararajan, R. & Williams, J. Hurricanes and
global warming: results from downscaling IPCC AR4 simulations. _Bull. Am. Meteorol. Soc._ 89, 347–368 (2008). Article Google Scholar * Goddard, L. & Dilley, M. El niño: catastrophe or
opportunity. _J. Clim._ 18, 651–665 (2005). Article Google Scholar * Lin, J. linjonathan/tropical_cyclone_risk: Tropical cyclone downscaling, https://doi.org/10.5281/zenodo.7651063 (2023).
* Hersbach, H. et al. ERA5 hourly data on single levels from 1979 to present. https://doi.org/10.24381/cds.bd0915c6 (2018). * Hersbach, H. et al. ERA5 monthly averaged data on pressure
levels from 1979 to present. https://doi.org/10.24381/cds.6860a573 (2019). * Hersbach, H. et al. ERA5 monthly averaged data on single levels from 1979 to present. _Copernicus Climate Change
Service (C3S) Climate Data Store (CDS)_ https://doi.org/10.24381/cds.f17050d7 (2019). * Met Office Hadley Centre. Hadley Centre sea ice and sea surface temperature data set (HadISST) (2024).
Available online: https://www.metoffice.gov.uk/hadobs/hadisst/data/download.html (Accessed on February 7, 2024). Download references ACKNOWLEDGEMENTS J.L. gratefully acknowledges the
support of the National Science Foundation (NSF) through the NSF-AGS Postdoctoral Fellowship, under award number AGS-PRF-2201441. C.Y.L., A.H.S., and S.J.C. also acknowledge support for this
work from NSF, under award number AGS-2217618, and the U.S. Department of Energy (DOE), under award number DE-SC0023333. C.Y.L. and S.J.C. also acknowledge additional support from NSF,
under award number AGS-2043142. AUTHOR INFORMATION Author notes * These authors contributed equally: Chia-Ying Lee, Suzana J. Camargo, Adam H. Sobel, Jing-Yi Zhuo. AUTHORS AND AFFILIATIONS *
Department of Earth and Atmospheric Sciences, Cornell University, Ithaca, NY, USA Jonathan Lin * Lamont-Doherty Earth Observatory, Columbia University, Palisades, NY, USA Jonathan Lin,
Chia-Ying Lee, Suzana J. Camargo, Adam H. Sobel & Jing-Yi Zhuo * Department of Applied Physics and Applied Mathematics, Columbia University, New York, NY, USA Adam H. Sobel Authors *
Jonathan Lin View author publications You can also search for this author inPubMed Google Scholar * Chia-Ying Lee View author publications You can also search for this author inPubMed Google
Scholar * Suzana J. Camargo View author publications You can also search for this author inPubMed Google Scholar * Adam H. Sobel View author publications You can also search for this author
inPubMed Google Scholar * Jing-Yi Zhuo View author publications You can also search for this author inPubMed Google Scholar CONTRIBUTIONS All authors designed research; J.L. performed
research; J.L. analyzed data; and all authors wrote the paper and reviewed the manuscript. CORRESPONDING AUTHOR Correspondence to Jonathan Lin. ETHICS DECLARATIONS COMPETING INTERESTS A.H.S.
serves as an external advisor to Jupiter Intelligence. ADDITIONAL INFORMATION PUBLISHER’S NOTE Springer Nature remains neutral with regard to jurisdictional claims in published maps and
institutional affiliations. SUPPLEMENTARY INFORMATION SUPPLEMENTARY INFORMATION RIGHTS AND PERMISSIONS OPEN ACCESS This article is licensed under a Creative Commons
Attribution-NonCommercial-NoDerivatives 4.0 International License, which permits any non-commercial use, sharing, distribution and reproduction in any medium or format, as long as you give
appropriate credit to the original author(s) and the source, provide a link to the Creative Commons licence, and indicate if you modified the licensed material. You do not have permission
under this licence to share adapted material derived from this article or parts of it. The images or other third party material in this article are included in the article’s Creative Commons
licence, unless indicated otherwise in a credit line to the material. If material is not included in the article’s Creative Commons licence and your intended use is not permitted by
statutory regulation or exceeds the permitted use, you will need to obtain permission directly from the copyright holder. To view a copy of this licence, visit
http://creativecommons.org/licenses/by-nc-nd/4.0/. Reprints and permissions ABOUT THIS ARTICLE CITE THIS ARTICLE Lin, J., Lee, CY., Camargo, S.J. _et al._ The response of tropical cyclone
hazard to natural and forced patterns of warming. _npj Clim Atmos Sci_ 8, 109 (2025). https://doi.org/10.1038/s41612-025-00997-y Download citation * Received: 11 October 2024 * Accepted: 10
March 2025 * Published: 18 March 2025 * DOI: https://doi.org/10.1038/s41612-025-00997-y SHARE THIS ARTICLE Anyone you share the following link with will be able to read this content: Get
shareable link Sorry, a shareable link is not currently available for this article. Copy to clipboard Provided by the Springer Nature SharedIt content-sharing initiative