- Select a language for the TTS:
- UK English Female
- UK English Male
- US English Female
- US English Male
- Australian Female
- Australian Male
- Language selected: (auto detect) - EN
Play all audios:
ABSTRACT During the boreal winter, the El Niño-Southern Oscillation (ENSO) influences the East Asia-western North Pacific (WNP) climate by triggering an anomalous WNP anticyclone (WNPAC).
Analysis of a suite of coupled model projections under symmetric CO2 ramp-up (RU) and ramp-down (RD) scenarios, the results reveal that WNPAC strengthens with increasing CO2 concentrations,
peaks early in the CO2 RD phase, and then gradually weakens without fully returning to its initial state when CO2 concentrations restore. The irreversible recovery of WNPAC is related to
enhanced negative precipitation anomalies in the tropical WNP and positive precipitation anomalies in the equatorial central and eastern Pacific. These changed precipitation anomalies are
primarily driven by the climatological equatorial Pacific El Niño-like warming pattern due to various external and internal feedback processes. Our findings indicate that the irreversible
change of WNPAC to CO2 forcing may hinder the winter monsoon and exacerbate climate risks in the East Asia-WNP region. SIMILAR CONTENT BEING VIEWED BY OTHERS ONGOING INTENSIFICATION OF
ANOMALOUS WESTERN NORTH PACIFIC ANTICYCLONE DURING POST-EL NIÑO SUMMER WITH ACHIEVED CARBON NEUTRALITY Article Open access 20 December 2024 STRENGTHENED IMPACT OF BOREAL WINTER NORTH PACIFIC
OSCILLATION ON ENSO DEVELOPMENT IN WARMING CLIMATE Article Open access 12 March 2024 IRREVERSIBILITY OF WINTER PRECIPITATION OVER THE NORTHEASTERN PACIFIC AND WESTERN NORTH AMERICA AGAINST
CO2 FORCING Article Open access 19 December 2024 INTRODUCTION The El Niño-Southern Oscillation (ENSO) is the dominant mode of interannual climate variability, significantly influencing
global climate by altering atmospheric circulations and establishing teleconnection patterns1,2,3,4,5,6,7. During the El Niño developing fall, an anomalous lower-tropospheric anticyclone
emerges over the western North Pacific (WNP) and can persists into the subsequent summer, known as the western North Pacific anomalous anticyclone (WNPAC)8,9,10,11,12,13. The WNPAC plays a
pivotal role in mediating ENSO’s climatic impact on the East Asia and WNP by modulating monsoon, leading to notable anomalies in temperature and precipitation14,15,16,17,18,19. The
maintenance mechanisms of the WNPAC during El Niño mature winter are primarily governed by convective activity anomalies in both the equatorial central and eastern Pacific (CEP) and the
tropical WNP. According to the Gill model20, ENSO-related positive precipitation anomalies in the equatorial CEP can induce cyclonic circulation anomalies as a Rossby wave response to the
northwest. Anomalous northeastern winds on the western flank of the cyclonic circulation anomalies transport dry air into the tropical WNP, suppressing local convection21, and then the
anomalous WNPAC is triggered as a Rossby wave response to these negative precipitation anomalies8,14. Simultaneously, the northeasterly wind anomalies enhance the northeasterly trade winds,
reinforcing local cold sea surface temperature (SST) anomalies through increased evaporation8. These cold SST anomalies further suppress local convection and strengthen the WNPAC to form
positive thermodynamical feedback. The combined effects of remote forcing from the equatorial CEP and local air-sea interaction in the tropical WNP are supported by numerical
experiments22,23,24. Besides, from the perspective of large-scale zonal circulation adjustment, enhanced convection in the equatorial CEP shift the Walker circulation eastward, resulting in
reduced precipitation anomalies over the tropical WNP22,25,26,27,28,29,30,31, and thereby influencing the WNPAC. Even under global warming scenario, the precipitation anomalies in the
equatorial CEP and the tropical WNP still dominate the variations of the WNPAC during El Niño mature winter32. Since the Industrial Revolution, the rise in anthropogenic Carbon Dioxide (CO2)
concentrations has driven long-term global warming, leading to various climate impacts and an increase in the frequency and severity of extreme weather events33,34,35,36,37,38,39,40,41. To
address these potential threats, the Paris Agreement aims to limit global temperature increases to below 2 °C relative to pre-industrial levels, with efforts to further constrain the rise to
within 1.5 °C. Achieving this goal requires Carbon Dioxide Removal (CDR) methods to reduce atmospheric CO2 concentrations42,43,44,45,46,47,48. Due to its large heat capacity, the ocean
absorbs significant heat during the CO2 ramp-up (RU) phase, and subsequently releases it during the ramp-down (RD) phase through slow oceanic dynamics, thereby influencing global
climate49,50,51. This delayed response induces hysteresis and irreversibility in the global hydrological cycle under CDR scenarios52,53,54,55,56,57. Regional precipitation also exhibits
asymmetric changes, such as in the tropical Pacific56,58, East Asia59, and South Asia55,60. While the direct response of global and regional precipitation to CDR is well-studied, the
response of ENSO-driven tropical Pacific precipitation anomalies has received less attention. Understanding this response is crucial for projecting the variations of the WNPAC. A recent
study indicates that ENSO SST variability shows hysteresis amplification under CDR scenarios, enhancing precipitation anomalies across the equatorial CEP and triggering stronger atmospheric
teleconnections that intensify the WNPAC61. However, this investigation is based on a single model and does not fully address the dynamics driving the changes in precipitation anomalies
across the equatorial CEP. Additionally, the effects of local precipitation anomalies in the tropical WNP on the anomalous anticyclone are not adequately considered. Here, we utilize nine
models from the Coupled Model Intercomparison Project Phase 6 (CMIP6) that conduct idealized CO2 concentration experiments. These experiments involve a gradual increase in CO2 concentrations
from pre-industrial levels at a rate of 1% per year until reaching four times the pre-industrial concentrations over 140 years, followed by a symmetric decrease at the same rate for another
140 years, before stabilizing at the pre-industrial level for 60 years. Despite considerable spread in projection of ENSO SST variability, most models exhibit a strengthened response of
precipitation anomalies to ENSO in the tropical WNP and equatorial CEP, as well as an enhancement of the WNPAC and its climate impacts during the El Niño mature winter when CO2
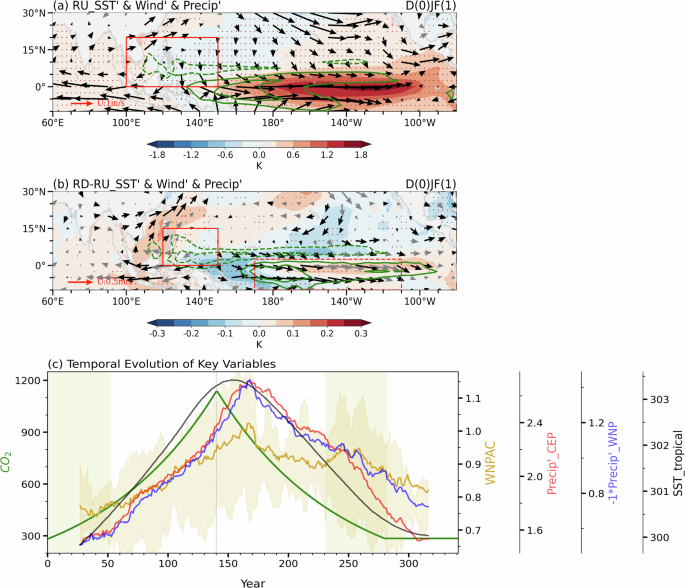
concentrations return to pre-industrial levels. RESULTS ASYMMETRIC RESPONSE OF THE WNPAC The regressed SST anomalies, precipitation anomalies, and 850-hPa wind anomalies during D(0)JF(1)
onto the standardized Niño-3.4 index during the CO2 RU phase in multi-model ensemble (MME) are presented in Fig. 1a. In this research, the El Niño developing year is denoted as 0, and the
subsequent El Niño decaying year is denoted as 1. Most models successfully reproduce the phase-locking feature of El Niño (Fig. S1a), which provides a reliable basis for further analyzing
ENSO and its associated impacts. A notable feature is the hook-like pattern of positive precipitation anomalies across the equatorial CEP, while negative precipitation anomalies dominate the
tropical WNP. As a combined contribution of direct Rossby wave response to the tropical WNP negative precipitation anomalies and remote forcing from the CEP positive precipitation
anomalies8, a fully developed anomalous anticyclone emerges in the WNP. Significant warm SST anomalies are observed in the equatorial CEP, and the tropical WNP region shows the cold SST
anomalies, consistent with previous studies8,21. Most models accurately depict the observational characteristics of SST, precipitation, and wind anomalies during the El Niño mature winter,
supported by consistency tests. However, compared to observations (Fig. S1b), the positive SST anomalies and precipitation anomalies in the equatorial Pacific extend too far westward, and
there is a tendency to underestimate the positive precipitation anomalies in the equatorial central Pacific and the negative precipitation anomalies in the tropical WNP. Consequently, the
simulated WNPAC appears relatively weaker (Fig. 1a and S1b). To investigate whether the WNPAC exhibits an asymmetric response under the CDR scenario, we designate years from 230 to 280 in
the CO2 RD phase as the CO2 RD period, and years from 1 to 51 in the CO2 RU phase with consistent CO2 concentrations as the CO2 RU period. Figure 1b presents the differences in regressed
variable fields between the two periods. The variations in SST anomalies across the equatorial CEP are not significant, indicating that the ENSO intensity remains relatively unchanged,
resembling the patterns observed in global warming scenarios62,63,64,65,66,67. Compared to the SST anomalies, the positive precipitation anomalies in this region are considerably enhanced,
suggesting a southeastward shift of the hook-like positive precipitation pattern, which likely influences the subsequent teleconnection impacts32,63,65. Over the WNP region, there is a
significant intensification of the anomalous anticyclone, accompanied by enhanced local negative precipitation anomalies. The strengthened southwesterlies at northwest flank of WNPAC further
exacerbate the warm temperature and positive precipitation anomalies in the East Asia-WNP region by hindering winter monsoon and transporting more warm and moist air to this area (Fig. S2b,
S2d). Further validation of the robustness of the WNPAC’s asymmetric response under the CDR scenario is performed by calculating the WNPAC intensity throughout the entire phase of CO2
concentrations change. The WNPAC intensity is defined using the area-weighted regional mean of the negative vorticity of the 850-hPa wind anomalies in the WNP region (0°–20°N, 100°–150°E, as
indicated in Fig. 1a). This region well captures the anticyclonic circulation anomalies in each model (figure not shown). As depicted in Fig. 1c, the WNPAC gradually strengthens as CO2
concentrations rise. During the CO2 RD phase, due to the ocean’s thermal inertia49,50,51, the tropical climatological SST continues to increase for about 15 years, while the WNPAC continues
to intensify for additional 25 years after CO2 concentrations’ peak. This overshoot and subsequent slow recovery lead to the WNPAC being stronger during the CO2 RD period compared to the CO2
RU period (Fig. 1b, c). Among the nine models, seven successfully capture the asymmetric characteristics of the WNPAC (Fig. S3). Additionally, an alternative definition by calculating the
regionally averaged eddy geopotential height anomaly at 925-hPa following ref. 32 is applied to calculate the WNPAC intensity, yielding consistent results derived by the regional vorticity
average (Fig. S4). To further validate the robustness of the asymmetric WNPAC response, horizontal distributions of 850-hPa wind and vorticity anomalies over the WNP region are presented,
comparing the differences across nine pairs of periods. These periods span from years 1–51 (230–280) of the RU (RD) phase, with 10-year intervals, to years 81–131 (150–200) (Fig. S5).
Consistency tests indicate that at least seven models simulate the anticyclonic circulation and negative vorticity anomalies in each time period. REASONS FOR THE ASYMMETRIC RESPONSE OF THE
WNPAC The anomalous WNPAC is closely related to the local non-adiabatic cooling, which triggers the anomalous anticyclone as an Rossby wave response. Our findings demonstrate a remarkable
concordance between precipitation anomalies in the tropical WNP and the WNPAC intensity (Fig. 1c), with correlation coefficients consistently exceeding the 90% confidence level in 8 models
(Fig. S6). Similarly, equatorial CEP precipitation anomalies show a strong association with WNPAC intensity in the MME results (Fig. 1c), with that six models exhibit a significant
correlation exceeding the 90% confidence level (Fig. S6). These equatorial CEP precipitation anomalies could influence tropical WNP precipitation anomalies through atmospheric
teleconnections8,21 or the Walker circulation22,25,26,27,28,29,30,31, thereby affecting the strength of the anomalous anticyclone. While ENSO plays a significant role in influencing WNPAC,
its SST variability does not seem to directly affect the intensity of the anticyclone. The correlation coefficients between ENSO SST variability and WNPAC in the nine modes are not
significant, and only one models’ results reach 90% confidence level (Fig. S7). Moreover, consistent with previous conclusion, the projection of ENSO SST variability across the nine models
shows large spread. Therefore, our forthcoming investigation will focus on analyzing the origin of precipitation anomalies in the tropical WNP and equatorial CEP. Predicted changes in
ENSO-driven precipitation anomalies during the CO2 RD relative to the RU period exhibit intensified negative anomalies in the tropical WNP and positive anomalies in the equatorial CEP (Figs.
1b and 2a). These precipitation anomalies are similar to those observed under global warming scenarios, as reported in previous studies29,30,31,68,69,70,71,72. Based on the two-layer
approximated moisture budget equation31, the variation in precipitation anomalies (\(\Delta P^{\prime}\)) can be decomposed into the thermodynamic (\(-\Delta \bar{q}\cdot \omega^ {\prime}\))
and dynamic (\(-\bar{q}\cdot \Delta \omega^{\prime}\)) components. The simplified equation accurately captures the amplitude and spatial distribution of the changes in precipitation
anomalies between the CO2 RD and RU period (Fig. 2a, b). Compared to thermodynamic component (\(-\Delta \bar{q}\cdot \omega ^ {\prime}\)), the dynamic component (\(-\bar{q}\cdot \Delta
\omega ^ {\prime}\)) plays a more dominant role (Fig. 2c, d). The dynamic component is largely controlled by the changes in vertical motion anomalies, confirmed by their resembling spatial
distribution (Fig. 2d). Anomalous ascending and descending motions appear over the equatorial CEP and tropical WNP, respectively, indicating a further weakening of ENSO-induced anomalous
Walker circulation during the CO2 RD period. Given that circulation anomalies are primarily responsible for the precipitation anomalies, further analysis is necessary to determine the
factors driving variations in vertical motion anomalies in the tropical WNP and equatorial CEP. THE INTENSIFIED DESCENDING ANOMALIES IN THE WNP Due to data limitations, a simplified Moist
Static Energy (MSE) equation for 5 models is used to analyze the intensified descending anomalies in the tropical WNP under the CDR scenario. As depicted in Fig. 3, the climatological MSE
advection due to changes in anomalous vertical motion (\(\langle \Delta {\omega }^{{\prime} }\cdot {\partial }_{p}\bar{h}\rangle\)) is primarily balanced by four factors: net MSE flux
anomalies \((\Delta {F^{\prime} }_{{net}})\), anomalous moist enthalpy advection due to changes in horizontal wind fields (\(-\langle \Delta \bar{\vec{u}}\cdot {\nabla }_{h}{s}^{{\prime}
}\rangle\)), anomalous horizontal advection of changed climatological moist enthalpy (\(-\left\langle \vec{u}^{{\prime} }\cdot {\nabla }_{h}\left(\Delta \bar{s}\right)\right\rangle\)), and
climatological vertical advection of the changed anomalous MSE (\(-\langle \bar{\omega }\cdot {\partial }_{p}\left(\Delta {h}^{{\prime} }\right)\rangle\)). The results for each model are
shown in Fig. S8, with four of the five models successfully capturing the negative climatological MSE advection due to changes in anomalous vertical motion (\(\langle \Delta {\omega
}^{{\prime} }\cdot {\partial }_{p}\bar{h}\rangle\)), and the four important contributing factors in the MME generally exhibiting negative values in these four models. Figure S9 illustrates
the spatial distribution of each term in MSE equation during the CO2 RD compared to the RU period, and the above mentioned four terms exhibit negative anomalies in the tropical WNP (Fig.
S9c, S9d, S9g, S9i), aligning with the effects of climatological MSE advection due to changes in anomalous vertical motion (\(\langle \Delta {\omega }^{{\prime} }\cdot {\partial
}_{p}\bar{h}\rangle\); Fig. S9a). To further validate these terms, in addition to quantitatively analyzing the contribution of each term, their temporal evolution characteristics are
provided in Fig. S10. The results reveal consistent overshoots and subsequent delayed recoveries in the four terms (Fig. S10c, S10d, S10g, S10i), indicating their crucial role in driving the
enhanced descending anomalies in the region. These four terms involve different physical processes as external forcing and internal feedback mechanisms. The former drives variations in
precipitation anomalies associated with changes of climatological background fields, while the latter amplifies the precipitation anomalies associated with changes of precipitation-related
variable anomalies as feedback processes. The specific mechanisms are individually analyzed in following subsections. EXTERNAL FORCING In the tropical WNP region, the vertical profile of
anomalous moist enthalpy advection due to changes in horizontal wind fields (\(-\langle \Delta \bar{\vec{u}}\cdot {\nabla }_{h}{s}^{{\prime} }\rangle\)) indicates that the negative anomalies
are primarily due to changes in the lower free troposphere (Fig. S11). Consequently, the spatial distribution of climatological winds and anomalous moist enthalpy at 700-hPa are selected
for analysis. During the CO2 RU period, the tropical WNP is characterized by climatological easterlies, and the distribution of anomalous moist enthalpy exhibits a maximum in the equatorial
CEP (Fig. 4a), where corresponds to the significant SST warming (Fig. 1a). These climatological easterlies transport high anomalous enthalpy towards the tropical WNP, reducing the moist
static stability of the atmospheric column and making this region more susceptible to convection. During the CO2 RD period, the climatological equatorial Pacific SST compared to CO2 RU
period presents an El Niño-like warming pattern54,58,59,60, which enhances convective in the equatorial CEP following a warmer-get-wetter mechanism58,73,74, corresponding with a convergence
of climatological wind fields towards the equatorial CEP region (Fig. 4c). The resultant weakening of the climatological easterly winds in the tropical WNP reduces the transport of high
anomalous moist enthalpy to the tropical WNP (\(-\langle \Delta \bar{\vec{u}}\cdot {\nabla }_{h}{s}^{{\prime} }\rangle \,<\, 0\)), increasing the atmospheric moist static stability and
thereby suppressing convection. Interestingly, the vertical profile of anomalous horizontal advection of changed climatological moist enthalpy (\(-\left\langle \vec{u}^{{\prime} }\cdot
{\nabla }_{h}\left(\Delta \bar{s}\right)\right\rangle\)) reveals that variations are also predominantly concentrated in the lower free troposphere (Fig. S12). Figure 4b illustrates the
spatial distribution of anomalous wind fields and climatological moist enthalpy at 700-hPa during the CO2 RU period. In El Niño mature winter, significant positive SST anomalies in the
equatorial CEP (Fig. 1a) induce anomalous northwesterly winds over the tropical WNP. The climatological moist enthalpy is a function of climatological temperature and specific humidity.
Although the temperature component accounts for 95.95% of total moist enthalpy in the tropical WNP, the analysis indicates that the anomalous horizontal advection of climatological moist
enthalpy is predominantly contributed by the moisture advection, constituting 66.34% of the total effect (figure not shown). The climatological moist enthalpy in the tropical WNP exhibits a
strong meridional gradient, and anomalous northerly winds bring low climatological moist enthalpy air to the region (Fig. 4b), stabilizing the atmospheric column and thus suppressing
convection. This negative moist enthalpy advection is one of the key mechanisms for maintaining the wintertime WNPAC21. During the CO2 RD period, significant increase of climatological moist
enthalpy occurs in the equatorial Pacific (Fig. 4c), enhancing the meridional gradient of the climatological moist enthalpy. Thus, the resultant strengthened negative moist enthalpy
advection (\(-\left\langle \vec{u}^{{\prime} } \cdot {\nabla }_{h}\left(\Delta \bar{s}\right)\right\rangle \,<\, 0\)) over the tropical WNP corresponds to a further reduction of
precipitation in this region. The decomposition of moist enthalpy indicates that the enhanced meridional gradient of changed climatological moist enthalpy is mainly due to changes in
climatological specific humidity, while the contribution of temperature changes is minimal (Fig. S13a and S13b). The climatological equatorial Pacific warming pattern causes increased
convections in the equatorial CEP and decreased convections along their north flank58,75, as shown in Fig. S13c. These changes in convective activities induce changes in the climatological
specific humidity through moisture-convection feedback mechanism76,77, and the pattern correlation between them two reaches 0.68 for the region of 15°S to 15°N, and 60°E to 80°W (Fig. S13b
and S13c). INTERNAL FEEDBACK In the MSE budget analysis, the difference between the CO2 RD and RU period shows that the net MSE flux anomalies (\(\Delta {F^{{\prime} } }_{{net}}\)) play a
dominant role in the enhanced descending anomalies over the tropical WNP (Fig. 3). As shown in Eq. (5), the net MSE flux anomalies (\(\Delta {F^{{\prime} } }_{{net}}\)) includes five
components, with longwave cloud radiative anomalies (\({\Delta R^{{\prime} } }_{{cloud}}\)) contributing the most significant change (Fig. 5a), accounting for 85.1% of changes in net MSE
flux anomalies (\(\Delta {F^{{\prime} } }_{{net}}\)). In contrast, the contributions of clear-sky longwave radiative, net solar radiative, latent heat flux, and sensible heat flux anomalies
are about 18.8%, 0.2%, 7.3%, and 3.2%, respectively (figure not shown). The cloud-related net longwave radiative flux anomalies (\({R^{\prime} }_{{cloud}}\)) in the tropics reflect an
internal positive feedback between atmospheric convection and cloud radiative forcing78,79,80,81, as that pattern correlation between them in the tropical region of 15°S to 15°N, and 60°E to
80°W reaches 0.83 (Figs. 2d and 5a). In the tropical WNP, the further suppression of convection leads to an additional decrease in negative longwave cloud radiative anomalies (\({\Delta
R^{{\prime} } }_{{cloud}}\)), which cool atmospheric column, enhance gross moisture stability, and thereby further inhibit convection21. This convection-cloud radiative positive feedback
amplifies the negative precipitation anomalies but is not the root cause of it. In addition to the convection-cloud radiative feedback, there exists another positive feedback mechanism that
contributes to the negative precipitation anomalies in this region. During the RU period, the minimum MSE anomalies in the tropical WNP appears around 700-hPa (Fig. S14a), indicating an
increase in the gross moist stability of the atmospheric column in the climatological deep convection region (\(-\langle \bar{\omega }\cdot {\partial }_{p}{h}^{{\prime} }\rangle \,<
\,0\)). The vertical structure of these MSE anomalies is primarily controlled by specific humidity anomalies, while the contribution of dry static energy anomalies is relatively minor
(figure not shown). Furthermore, this vertical distribution of specific humidity anomalies is related to moisture-convection feedback, and large-scale descending anomalies in the tropical
WNP lead to a reduction in mid-to-lower free atmospheric level moisture anomalies, as explained by ref. 21. During the CO2 RD period, the vertical profile of MSE anomalies shows a further
reduction around 700-hPa compared to the CO2 RU period (Fig. S14b), mainly due to changes in specific humidity anomalies (Fig. S14d). The pattern correlation between these specific humidity
anomalies and vertical pressure velocity anomalies at 700-hPa in the tropical region of 15°S to 15°N, 60°E to 80°W is approximately 0.67 (Fig. 5b), suggesting an important role for
moisture-convection positive feedback. In the tropical WNP, enhanced descending anomalies further reduce specific humidity anomalies (Fig. 5b), resulting in reduced climatological upward
advection of the anomalous MSE (\(-\langle \bar{\omega }\cdot {\partial }_{p}\left(\Delta {h}^{{\prime} }\right)\rangle \,<\, 0\)) and increased gross moisture stability of the
atmospheric column, thereby suppressing convection. Additionally, there is some enhancement of MSE anomalies at the top of the free troposphere, related to changes in atmospheric temperature
anomalies (Fig. S14c), which to some extent reduces the vertical gradient of MSE anomalies. These changes in atmospheric temperature anomalies are associated with the moist adiabatic
adjustment of tropical convection, meaning that when specific humidity anomalies are confined to the lower free troposphere, atmospheric temperature anomalies in the upper free troposphere
increase correspondingly to maintain tropical moist adiabats5,82,83. THE INTENSIFIED ASCENDING ANOMALIES IN THE CEP The MSE equation for 5 models is also utilized to explore the enhanced
ascending anomalous over the equatorial CEP under CDR scenario (Fig. 6). The climatological MSE advection due to changes in anomalous vertical motion (\(\langle \Delta {\omega }^{{\prime}
}\cdot {\partial }_{p}\bar{h}\rangle\)) is primarily balanced by anomalous vertical advection of the changed climatological MSE (\(-\langle {\omega }^{{\prime} }\cdot {\partial }_{p}(\Delta
\bar{h})\rangle\)), net MSE flux anomalies (\(\Delta {F^{\prime} }_{{net}}\)), climatological moist enthalpy advection due to changes in anomalous horizontal winds (\(-\langle \Delta
\vec{u}^{{\prime} } \cdot {\nabla }_{h}\bar{s}\rangle\)), and anomalous MSE advection due to changes in climatological vertical motion (\(-\langle \Delta \bar{\omega }\cdot {\partial
}_{p}{h}^{{\prime} }\rangle\)). Figure S15 provides the results for each model, showing that all five models successfully capture the positive climatological MSE advection due to changes in
anomalous vertical motion (\(\langle \Delta {\omega }^{{\prime} }\cdot {\partial }_{p}\bar{h}\rangle\)), with the four key contributing factors in the MME generally exhibiting positive
values across these models. The spatial distribution of these four terms exhibit positive anomalies over the equatorial CEP during the CO2 RD relative to the RU period (Fig. S9b, S9c, S9f,
S9h), and their temporal evolution aligns with the climatological MSE advection due to changes in anomalous vertical motion (\(\langle \Delta {\omega }^{{\prime} }\cdot {\partial
}_{p}\bar{h}\rangle\); Fig. S16a, S16b, S16c, S16f, S16h), exhibiting characteristics of overshoot and delayed recovery and indicating their contribution to the strengthened positive
precipitation anomalies over the equatorial CEP. The corresponding physical processes of these four terms from the perspectives of external forcing and internal feedback processes are
examined in the next subsections. EXTERNAL FORCING During the CO2 RU period, the climatological MSE in the equatorial CEP reaches its lowest value at approximately 700-hPa, cooperating with
the ascending anomalies in the lower to mid troposphere to enhance the gross moist stability of the atmospheric column (\(-\langle {\omega }^{{\prime} }\cdot {\partial }_{p}\bar{h}\rangle
\,<\, 0\), Fig. 7a). The difference between the CO2 RD and RU period indicates that the increase in climatological MSE over the equatorial CEP is most pronounced in the lower troposphere
(Fig. 7a) and is associated with climatological equatorial Pacific warming pattern. The equatorial CEP SST warming, on one hand, favors a direct increase in boundary layer moisture, on the
other hand, enhances convection in the area58,75 and thereby increases lower troposphere moisture (Fig. S17c) through the moisture-convection feedback process76,77. The strengthened
climatological moisture primarily contributes to the increase of climatological MSE in the lower free troposphere (Fig. 7a), which aligns with anomalous ascending motion to weaken
atmospheric gross moist stability (\(-\langle {\omega }^{{\prime} }\cdot {\partial }_{p}\left(\Delta \bar{h}\right)\rangle\, >\, 0\)) and thereby promotes convection. Ref. 84 also
demonstrates that this term is the main contributor to the enhanced precipitation over the equatorial CEP under global warming scenario. Additionally, the equatorial CEP SST warming leads to
changes in climatological atmospheric temperature through moist-adiabatic adjustment (Fig. S17b), resulting in a weak positive center of climatological MSE at around 250-hPa (Fig. 7a). This
weak positive center reduces the vertical gradient of the changed climatological MSE and inhibits enhanced convection to some extent. Moreover, anomalous MSE advection due to changes in
climatological vertical motion (\(-\langle \Delta \bar{\omega }\cdot {\partial }_{p}{h}^{{\prime} }\rangle\)) also contributes to the enhancement of precipitation anomalies. The equatorial
western Pacific is a region of deep convection dominated by strong climatological ascending motions, whereas the equatorial eastern Pacific, being the descending branch of the Walker
circulation, experiences climatological descending motions (Fig. 7b). Simultaneously, the vertical distribution of MSE anomalies across the entire equatorial Pacific shows a decrease from
the lower to the upper free troposphere (Fig. S17e). Consequently, in the equatorial eastern Pacific, anomalous MSE transported by descending motions enhance gross moist stability
(\(-\langle \bar{\omega }\cdot {\partial }_{p}{h}^{{\prime} }\rangle \,<\, 0\)) and suppresses convection. During the CO2 RD period, the climatological equatorial Pacific warming pattern
shift the Walker circulation eastward, characterized by enhanced ascending motions in the equatorial CEP and stronger descending motions in the western Pacific (Fig. 7b; ref. 59), consistent
with the conclusions under global warming scenario28,29,85. The anomalous MSE transported by enhanced ascending motions reduce the gross moist stability of the region (\(-\langle \Delta
\bar{\omega }\cdot {\partial }_{p}{h}^{{\prime} }\rangle \,>\, 0\)) and facilitate enhanced convection. INTERNAL FEEDBACK Similar to the conclusions for the tropical WNP, net radiative
flux anomalies (\(\Delta {F^{\prime} }_{{net}}\)) contribute the most to the enhanced ascending anomalies over the equatorial CEP according to MSE budget analysis (Fig. 6). Among the five
components included in the simplified net MSE flux anomalies (\(\Delta {F^{\prime} }_{{net}}\)), changes in longwave cloud radiative forcing anomalies (\({\Delta R^{\prime} }_{{cloud}}\))
are the most significant, accounting for 58.2% of changes in net MSE flux anomalies (\(\Delta {F^{\prime} }_{{net}}\)). Contributions from changes in clear-sky longwave radiative, net solar
radiative, latent heat, and sensible heat flux anomalies are approximately 13.1%, 3.7%, 19.3%, and 5.7%, respectively (figure not shown). In contrast to the tropical WNP, the further
enhancement of convection in the equatorial CEP leads to an additional increase in positive longwave cloud radiative anomalies (\({\Delta R^{\prime} }_{{cloud}}\)), which warm atmospheric
column, reduce gross moisture stability, and thereby further promote convection as a convection-cloud radiative positive feedback (Fig. 5a). Another internal feedback process is related to
climatological moist enthalpy advection due to changes in anomalous horizontal winds (\(-\langle \Delta \vec{u}^{{\prime} } \cdot {\nabla }_{h}\bar{s}\rangle\)), with its positive changes
primarily concentrated in the tropopause and lower free troposphere (Fig. S18). Therefore, 100-hPa and 700-hPa are selected for detailed analysis. At 100-hPa, climatological moist enthalpy
is predominantly influenced by atmospheric temperature due to the very low water vapor content at the level, and it increases from west to east across the equatorial Pacific (Fig. 8a). The
low-value center of climatological moist enthalpy in the equatorial western Pacific is caused by the adiabatic cooling effect of climatological ascending airflows (Fig. 7b). At 700-hPa,
climatological moist enthalpy is affected by both atmospheric temperature and moisture, showing a decrease from west to east across the equatorial Pacific (Fig. 8b), owing to that the high
climatological moist enthalpy is close to the warm pool in the equatorial western Pacific. During the CO2 RU period, the vertical cross-sections of the equatorial wind fields reveal
pronounced anomalous ascending (descending) motions in the equatorial CEP (western Pacific) in response to El Niño, corresponding with anomalous easterlies (westerlies) at upper (lower)
troposphere (Fig. S19a). During the CO2 RD period, the enhanced equatorial CEP convection anomalies further strengthen upper-level easterly wind anomalies (Figs. 8a and S19b) and lower-level
westerly wind anomalies (Figs. 8b and S19b), both of which bring more high climatological moist enthalpy air to the equatorial CEP (\(-\left\langle \Delta \vec{u}^{{\prime} }\cdot {\nabla
}_{h}\bar{s}\right\rangle \,>\, 0\)) and promote convection. Previous study has used this wind-enthalpy-convection positive feedback to explain the formation of negative precipitation
anomalies in the tropical WNP and the subsidence anomalies in the northern flank of the equatorial Pacific21,79. DISCUSSION This study investigates the irreversible response of the anomalous
WNPAC and its climate impacts during the El Niño mature winter to CO2 forcing, as well as the underlying physical mechanisms. The results reveal that the WNPAC progressively strengthens
with increasing CO2 concentrations, reaching its maximum intensity in the first few decades of CO2 RD phase before gradually weakening. However, the anticyclone does not fully return to its
initial state even when the CO2 concentrations are reduced to the pre-industrial level. This overshoot and the subsequent slow recovery of the anomalous WNPAC are primarily due to the
enhanced negative precipitation anomalies in the tropical WNP as a Rossby wave response, and further promoted by the enhanced positive precipitation anomalies in the equatorial CEP through
the adjustments of atmospheric teleconnections and Walker circulation. These changed precipitation anomalies are mainly driven by variations in vertical motion anomalies. The key processes
and mechanisms are summarized in a schematic diagram and explained as follows (Fig. 9). In the tropical WNP, the enhanced negative precipitation anomalies are driven by remote forcing from
the equatorial CEP, and subsequently amplified by local feedback processes. The climatological equatorial Pacific El Niño-like warming pattern weakens the climatological easterlies and
increases the meridional gradient of climatological specific humidity in the lower free troposphere of the tropical WNP. These changes reduce the horizontal transport of high anomalous moist
enthalpy by the climatological easterlies (\(-\left\langle \Delta \bar{\vec{u}}\cdot {\nabla }_{h}{s}^{{\prime} }\right\rangle \,<\, 0\)) and enhance the horizontal transport of low
climatological moist enthalpy by the anomalous northerlies (\(-\left\langle \vec{u}^{{\prime} }\cdot {\nabla }_{h}\left(\Delta \bar{s}\right)\right\rangle \,<\, 0\)), thereby suppressing
convection. The suppressed convection, through convection-cloud radiative feedback, reduces the cloud’s reflection of longwave radiation, leading to a net MSE flux outflow of atmosphere
(\(\Delta {F^{\prime} }_{{net}} \,<\, 0\)). Additionally, suppressed convection reduces specific humidity anomalies in the lower troposphere through moisture-convection feedback
processes, reducing the upward transport of anomalous MSE (\(-\langle \bar{\omega }\cdot {\partial }_{p}\left(\Delta {h}^{{\prime} }\right)\rangle \,<\, 0\)). These two internal feedback
processes enhance the gross moist stability of atmospheric column, further amplifying negative precipitation anomalies. In the equatorial CEP, climatological equatorial Pacific warming
pattern increases the lower free troposphere climatological MSE and climatological precipitation, strengthening upward transport of climatological MSE (\(-\langle {\omega }^{{\prime} }\cdot
{\partial }_{p}(\Delta \bar{h})\rangle \,>\, 0\)) and anomalous MSE (\(-\langle \Delta \bar{\omega }\cdot {\partial }_{p}{h}^{{\prime} }\rangle \,>\, 0\)). Both processes weaken
atmospheric gross moist stability and enhance convection in the region. The enhanced convective anomalies, on one hand, strengthen the input of net radiative flux anomalies (\(\Delta
{F^{\prime} }_{{net}} \,>\, 0\)) to atmosphere through convection-cloud radiation feedback, and on the other hand, drive the low-level horizontal convergent winds and the upper-level
horizontal divergent winds, thereby transporting more high climatological moist enthalpy air to the region (\(-\left\langle \Delta \vec{u}^{{\prime} }\cdot {\nabla }_{h}\bar{s}\right\rangle
\,>\, 0\)). This wind-enthalpy-convection feedback further intensifies the convective anomalies. Under the CDR scenarios, climatological equatorial Pacific warming pattern is primarily
associated with deep ocean warming54,59, which is due to the immense heat capacity and slow ocean dynamical processes49,50,51. The gradual recovery of the Walker circulation plays a mutually
reinforcing role in this warming pattern. This type of warming causes the significant southward shift of the intertropical convergence zone75, and the increase in climatological humidity is
particularly evident over the CEP, indicating its southeastward movement (Fig. 2c). The changes in precipitation anomalies in the equatorial CEP and tropical WNP also exhibit a
southeastward shift (Fig. 1b). However, the relationship between positional shift of climatological humidity and precipitation anomalies, and the corresponding low-level circulation
response, particularly the positional changes of the WNPAC, are not fully discussed in the present study and require further research, as it could impact the spatial distribution of climate
anomalies in East Asia-WNP (Fig. S2b). METHODS THE IDEALIZED CDR PATHWAY This study utilizes data from the CMIP6 1pctCO2 and 1pctCO2-cdr experiments. In the 1pctCO2 experiment, CO2
concentrations increase annually by 1% over 150 years from the pre-industrial levels of 284.7 ppm, quadrupling by year 140 to reach 1138.8 ppm. The 1pctCO2-cdr experiment features symmetric
CO2 removal over 140 years, followed by stabilization at the pre-industrial levels for at least 60 additional years. We use data from the first 140 years of the 1pctCO2 experiment and the
first 200 years of the 1pctCO2-cdr experiment to construct idealized CO2 RU and RD scenarios. In this scenario, CO2 concentrations rise from year 1 to year 140, decline symmetrically from
year 141 to year 280, and stabilize from year 281 to year 340. DATA PREPROCESSING The experiments involve an ensemble of nine climate models: ACCESS-ESM1-5, CanESM5, CAS-ESM2-0, CESM2,
CNRM-ESM2-1, GFDL-ESM4, MIROC-ES2L, NorESM1-LM, and UKESM1-0-LL. All model datasets are initially interpolated onto a standardized 2.5° × 2.5° grid to ensure consistency. To extract
interannual signals and assess variables’ responses to ENSO, an 8-year high-pass filter is applied, removing trends and interdecadal signals. Subsequently, interannual anomalies are
calculated by subtracting the climatological mean for the entire study period. These anomalies are then regressed against the standardized Niño-3.4 index [SST anomalies averaged over
5°S–5°N, 120°–170°W during D(0)JF(1)]. This regression used a 51-year moving window for each model individually, and the results were averaged to create MME, thus minimizing biases from any
single model. Monthly outputs from all nine models are to examine the asymmetric response of the WNPAC and associated precipitation anomalies. However, CAS-ESM2-0, CESM2, NorESM2-LM, and
UKESM1-0-LL are excluded from the MSE budget analysis due to data limitations. Consequently, only five models were used to study the mechanisms driving asymmetric vertical motion anomalies
in the tropical WNP and equatorial CEP. In this study, a significant consensus among the models is identified as being present if at least 70% of the models agreed on the sign of the
anomalies86. Specifically, for cases with 9 models, this threshold corresponds to an agreement among at least 7 models, while for cases with 5 models, an agreement among at least 4 models is
required. Correlation analysis is used, and the confidence level is estimated based on the standard two-tailed Student’s t test. The effective degrees of freedom are considered when
applying the t test. The effective degrees of freedom (\({N}_{{eff}}\)) is estimated using the formula \({N}_{{eff}}=N\cdot (1-{r}_{1}\cdot {r}_{2})/(1+{r}_{1}\cdot {r}_{2})\), where \(N\)
is the sample size, and \({r}_{1}\) and \({r}_{2}\) are the lag-1 autocorrelation coefficients of the time series87. The observational and reanalysis datasets employed in this study are as
follows: (1) the Hadley Centre Global Sea Surface Temperature (HadISST) dataset, (2) the Global Precipitation Climatology Project (GPCP) monthly precipitation dataset, and (3) the National
Centers for Environmental Prediction-Department of Energy (NCEP-DOE) reanalysis. All these datasets span the period from 1981 to 2010 and are interpolated and processed in a manner
consistent with the CMIP6 model outputs. MOISTURE BUDGET DECOMPOSITION The decomposition of the moisture budget simplifies the understanding of rainfall changes by separating thermodynamic
and dynamic components. This approach effectively delineates the spatial patterns of tropical precipitation alterations under both warming and CDR scenarios, as well as elucidates the
interactions between precipitation and atmospheric circulation31,58,60,72. The equation used to describe the ENSO-induced rainfall changes is presented as follows: $$\varDelta {P}^{{\prime}
}\sim -\left(\varDelta \bar{q}\cdot \omega ^{{\prime} } +\bar{q}\cdot \varDelta \omega^{{\prime} }\right)$$ (1) In this formulation, \(\Delta\) signifies the changes observed during the CO2
RD period relative to the CO2 RU period. The prime symbol indicates anomalies attributable to ENSO, and the overbar represents the climatological mean. The variables \(P\), \(q\), and
\(\omega\) correspond to precipitation, surface specific humidity, and 500-hPa vertical pressure velocity [negative (positive) \(\omega\) indicates upward (downward) motion], respectively.
The term \(\varDelta \bar{q}\cdot \omega ^{{\prime} }\) is regarded as the thermodynamic component associated with climatological moisture, while \(\bar{q}\cdot \varDelta \omega ^{{\prime}
}\) is considered as the dynamic component related to circulation anomalies. MSE BUDGET In the tropics, vertical motion is primarily regulated by the MSE budget88. The MSE equation is
expressed as: $${\partial }_{t}{\left\langle s\right\rangle }^{{\prime} }+{\langle \vec{u}\cdot {\nabla }_{h}s\rangle }^{{\prime} }+{\langle \omega \cdot {\partial }_{p}h\rangle }^{{\prime}
}={F^{\prime} }_{{net}}$$ (2) Here, MSE is defined as \(h={c}_{p}T+{L}_{v}q+{gz}\), where \(s={c}_{p}T+{L}_{v}q\) represents moist enthalpy. The terms \(\vec{u}\), \(\omega\), \(q\), \(T\),
and \(z\), and \({F}_{{net}}\) correspond to horizontal wind, vertical pressure velocity, specific humidity, atmospheric temperature, and geopotential height, respectively, while
\({F}_{{net}}\) denote the net MSE flux. The constants \({c}_{p}\), \({L}_{v}\), and \(g\) represent the specific heat at constant pressure, latent heat of vaporization, and acceleration due
to gravity, respectively. It is noted that the time tendency term \({\partial }_{t}{\left\langle s\right\rangle }^{{\prime} }\) is negligible on interannual timescales. According to ref.
84, variations in the MSE equation between CO2 RD and CO2 RU period can be reformulated as: $$\langle \Delta {\omega }^{{\prime} }\cdot {\partial }_{p}\bar{h}\rangle \approx -\langle {\omega
}^{{\prime} }\cdot {\partial }_{p}\left(\Delta \bar{h}\right)\rangle +\varDelta {{F}^{{\prime} }}_{{net}}$$ $$-\langle \Delta \bar{\vec{u}}\cdot {\nabla }_{h}{s}^{{\prime} }\rangle -\langle
\Delta \bar{\vec{u}}\cdot {\nabla }_{h}\left(\Delta {s}^{{\prime} }\right)\rangle$$ $$-\langle \Delta \vec{u}^{{\prime} } \cdot {\nabla }_{h}\bar{s}\rangle -\langle \vec{u}^{{\prime} }
\cdot {\nabla }_{h}\left(\Delta \bar{s}\right)\rangle$$ $$-\langle \Delta \bar{\omega }\cdot {\partial }_{p}{h}^{{\prime} }\rangle -\langle \bar{\omega }\cdot {\partial }_{p}\left(\Delta
{h}^{{\prime} }\right)\rangle +{NL},$$ (3) where \({NL}\) indicates the sum of all nonlinear terms. The net MSE flux, \({{F}^{{\prime} }}_{{net}}\), entering an atmospheric column includes
components from both the top and the surface of the atmosphere: $${F^{\prime} }_{{net}}=({S}_{t}^{\downarrow }-{S}_{t}^{\uparrow }-{R}_{t}^{\uparrow })-\left(-{S}_{s}^{\uparrow
}+{S}_{s}^{\downarrow }-{R}_{s}^{\uparrow }+{R}_{s}^{\downarrow }-{LH}-{SH}\right)$$ (4) The first three terms (\({S}_{t}^{\downarrow }\), \({S}_{t}^{\uparrow }\), \({R}_{t}^{\uparrow }\))
represent radiative fluxes entering an atmospheric column from the top of the atmosphere, including downward shortwave, upward shortwave, and upward longwave radiative fluxes. Conversely,
the subsequent six terms (\({S}_{s}^{\uparrow }\), \({S}_{s}^{\downarrow }\), \({R}_{s}^{\uparrow }\), \({R}_{s}^{\downarrow }\), \({LH}\), \({SH}\)) describe fluxes entering from the
surface, which encompass both shortwave and longwave radiative fluxes in both directions, along with latent and sensible heat fluxes. Positive values in this context denote heating of the
atmosphere. The three longwave radiation terms (\({R}_{t}^{\uparrow }\), \({R}_{s}^{\uparrow }\), \({R}_{s}^{\downarrow }\)) are consolidated and termed as net longwave radiation flux
(\({R}_{{net}}^{{\prime} }\)), which are further subdivided into cloud-related (\({R}_{{cloud}}^{{\prime} }\)) and clear-sky (\({R}_{{clear}}^{{\prime} }\)) components. Similarly, the four
solar radiation terms (\({S}_{t}^{\downarrow }\), \({S}_{t}^{\uparrow },\) \({S}_{s}^{\uparrow }\), \({S}_{s}^{\downarrow }\)) are amalgamated and referred to as net solar radiation flux
(\({S}_{{net}}^{{\prime} }\))21. Thus, the net MSE flux differences between CO2 RD and CO2 RU period are captured by: $${\Delta F^{\prime} }_{{net}}={\Delta R}_{{cloud}}^{{\prime} }+{\Delta
R}_{{clear}}^{{\prime} }+{\Delta S}_{{net}}^{{\prime} }+\Delta {LH}^{\prime} +\Delta {SH}^{\prime}$$ (5) DATA AVAILABILITY The CMIP6 outputs are publicly available online at
https://esgf-node.llnl.gov/projects/cmip6/. The observational and reanalysis data used to evaluate the performance of the models in this study can be accessed from the following sources: the
HadISST dataset at https://www.metoffice.gov.uk/hadobs/hadisst/data/download.html, the GPCP dataset at https://psl.noaa.gov/data/gridded/data.gpcp.html, and the NCEP-DOE reanalysis dataset
at https://psl.noaa.gov/data/gridded/data.ncep.reanalysis2.pressure.html. REFERENCES * Trenberth, K. E., Caron, J. M., Stepaniak, D. P. & Worley, S. Evolution of El Niño-Southern
oscillation and global atmospheric surface temperatures. _J. Geophys. Res. Atmos._ 107, AAC 5-1–AAC 5-17 (2002). Article Google Scholar * McPhaden, M. J., Zebiak, S. E. & Glantz, M. H.
ENSO as an integrating concept in earth science. _Science_ 314, 1740–1745 (2006). Article CAS Google Scholar * Deser, C., Alexander, M. A., Xie, S.-P. & Phillips, A. S. Sea surface
temperature variability: patterns and mechanisms. _Annu. Rev. Mar. Sci._ 2, 115–143 (2010). Article Google Scholar * Tao, W. et al. Asymmetry in summertime atmospheric circulation
anomalies over the northwest Pacific during decaying phase of El Niño and La Niña. _Clim. Dyn._ 49, 2007–2023 (2017). Article Google Scholar * Hu, K., Huang, G., Huang, P., Kosaka, Y.
& Xie, S.-P. Intensification of El Niño-induced atmospheric anomalies under greenhouse warming. _Nat. Geosci._ 14, 377–382 (2021). Article CAS Google Scholar * Wang, Y., Hu, K.,
Huang, G. & Tao, W. Asymmetric impacts of El Niño and La Niña on the Pacific-North American teleconnection pattern: the role of subtropical jet stream. _Environ. Res. Lett._ 16, 114040
(2021). Article Google Scholar * Wang, Y., Hu, K., Huang, G. & Tao, W. The role of nonlinear energy advection in forming asymmetric structure of ENSO teleconnections over the North
Pacific and North America. _Geophys. Res. Lett._ 50, e2023GL105277 (2023). Article Google Scholar * Wang, B., Wu, R. & Fu, X. Pacific-East Asian teleconnection: How does ENSO affect
East Asian climate? _J. Clim._ 13, 1517–1536 (2000). Article Google Scholar * Wang, B., Wu, R. & Li, T. Atmosphere-warm ocean interaction and its impacts on Asian-Australian monsoon
variation. _J. Clim._ 16, 1195–1211 (2003). Article Google Scholar * Wu, R., Hu, Z.-Z. & Kirtman, B. P. Evolution of ENSO-related rainfall anomalies in East Asia. _J. Clim._ 16,
3742–3758 (2003). Article Google Scholar * Chou, C. Establishment of the low-level wind anomalies over the western North Pacific during ENSO development. _J. Clim._ 17, 2195–2212 (2004).
Article Google Scholar * Xie, S.-P. et al. Indian Ocean capacitor effect on Indo-western Pacific climate during the summer following El Niño. _J. Clim._ 22, 730–747 (2009). Article Google
Scholar * Tao, W. et al. Origins of biases in CMIP5 models simulating northwest Pacific summertime atmospheric circulation anomalies during the decaying phase of ENSO. _J. Clim._ 31,
5707–5729 (2018). Article Google Scholar * Zhang, R.-H., Sumi, A. & Kimoto, M. Impact of El Niño on the East Asian monsoon: a diagnostic study ofthe ‘86/87 and ‘91/92 events. _J.
Meteorol. Soc. Jpn. Ser. II_ 74, 49–62 (1996). Article Google Scholar * Gong, H. et al. Diverse influences of ENSO on the East Asian-western Pacific winter climate tied to different ENSO
properties in CMIP5 models. _J. Clim._ 28, 2187–2202 (2015). Article Google Scholar * Xie, S.-P. et al. Indo-western Pacific ocean capacitor and coherent climate anomalies in post-ENSO
summer: a review. _Adv. Atmos. Sci._ 33, 411–432 (2016). Article Google Scholar * Wang, B., Li, J. & He, Q. Variable and robust East Asian monsoon rainfall response to El Niño over the
past 60 years (1957-2016). _Adv. Atmos. Sci._ 34, 1235–1248 (2017). Article Google Scholar * Tao, W., Kong, X., Liu, Y., Wang, Y. & Dong, D. Diversity of Northwest Pacific atmospheric
circulation anomalies during post-ENSO summer. _Front. Environ. Sci._ 10, 1068155 (2022). Article Google Scholar * Wang, Y. et al. Correcting climate model sea surface temperature
simulations with generative adversarial networks: Climatology, interannual variability, and extremes. _Adv. Atmos. Sci._ 41, 1299–1312 (2024). Article Google Scholar * Gill, A. E. Some
simple solutions for heat-induced tropical circulation. _Q. J. R. Meteorol. Soc._ 106, 447–462 (1980). Google Scholar * Wu, B., Zhou, T. & Li, T. Atmospheric dynamic and thermodynamic
processes driving the western North Pacific anomalous anticyclone during El Niño. Part I: maintenance mechanisms. _J. Clim._ 30, 9621–9635 (2017). Article Google Scholar * Lau, N.-C. &
Nath, M. J. Atmosphere-ocean variations in the Indo-Pacific sector during ENSO episodes. _J. Clim._ 16, 3–20 (2003). Article Google Scholar * Gong, H. et al. The climatology and
interannual variability of the East Asian winter monsoon in CMIP5 models. _J. Clim._ 27, 1659–1678 (2014). Article Google Scholar * Jiang, W. et al. Biases and improvements of the
ENSO-East Asian winter monsoon teleconnection in CMIP5 and CMIP6 models. _Clim. Dyn._ 59, 2467–2480 (2022). Article Google Scholar * Lau, N.-C. & Nath, M. J. Impact of ENSO on the
variability of the Asian-Australian monsoons as simulated in GCM experiments. _J. Clim._ 13, 4287–4309 (2000). Article Google Scholar * Ham, Y., Kug, J. & Kang, I. Role of moist energy
advection in formulating anomalous Walker circulation associated with El Niño. _J. Geophys. Res._ 112, D24105 (2007). Google Scholar * Vecchi, G. A. & Soden, B. J. Global warming and
the weakening of the tropical circulation. _J. Clim._ 20, 4316–4340 (2007). Article Google Scholar * Yu, B., Zwiers, F. W., Boer, G. J. & Ting, M. F. Structure and variances of
equatorial zonal circulation in a multimodel ensemble. _Clim. Dyn._ 39, 2403–2419 (2012). Article Google Scholar * Bayr, T., Dommenget, D., Martin, T. & Power, S. B. The eastward shift
of the Walker circulation in response to global warming and its relationship to ENSO variability. _Clim. Dyn._ 43, 2747–2763 (2014). Article Google Scholar * Cai, W. et al. Increasing
frequency of extreme El Niño events due to greenhouse warming. _Nat. Clim. Chang._ 4, 111–116 (2014). Article Google Scholar * Huang, P. & Xie, S.-P. Mechanisms of change in
ENSO-induced tropical Pacific rainfall variability in a warming climate. _Nat. Geosci._ 8, 922–926 (2015). Article CAS Google Scholar * Wang, Y., He, C. & Li, T. Response of the
anomalous western North Pacific anticyclone during El Niño mature winter to global warming. _Clim. Dyn._ 54, 727–740 (2020). Article Google Scholar * Barnett, T. P., Adam, J. C. &
Lettenmaier, D. P. Potential impacts of a warming climate on water availability in snow-dominated regions. _Nature_ 438, 303–309 (2005). Article CAS Google Scholar * Toggweiler, J. R.
& Russell, J. Ocean circulation in a warming climate. _Nature_ 451, 286–288 (2008). Article CAS Google Scholar * Rahmstorf, S. & Coumou, D. Increase of extreme events in a warming
world. _Proc. Natl Acad. Sci. USA_ 108, 17905–17909 (2011). Article CAS Google Scholar * Ma, J., Xie, S.-P. & Kosaka, Y. Mechanisms for tropical tropospheric circulation change in
response to global warming. _J. Clim._ 25, 2979–2994 (2012). Article Google Scholar * Wang, X., Jiang, D. & Lang, X. Future extreme climate changes linked to global warming intensity.
_Sci. Bull._ 62, 1673–1680 (2017). Article Google Scholar * Johnson, N. C., Xie, S.-P., Kosaka, Y. & Li, X. Increasing occurrence of cold and warm extremes during the recent global
warming slowdown. _Nat. Commun._ 9, 1724 (2018). Article Google Scholar * Studholme, J., Fedorov, A. V., Gulev, S. K., Emanuel, K. & Hodges, K. Poleward expansion of tropical cyclone
latitudes in warming climates. _Nat. Geosci._ 15, 14–28 (2022). Article CAS Google Scholar * Kotz, M., Lange, S., Wenz, L. & Levermann, A. Constraining the pattern and magnitude of
projected extreme precipitation change in a multi-model ensemble. _J. Clim._ 37, 97–111 (2023). Article Google Scholar * Tang, H. et al. Human contribution to the risk of 2021 Northwestern
Pacific concurrent marine and terrestrial summer heat. _Bull. Am. Meteorol. Soc._ 104, E673–E679 (2023). Article Google Scholar * Peters, G. P. et al. The challenge to keep global warming
below 2. _Nat. Clim. Chang._ 3, 4–6 (2013). Article Google Scholar * Sanderson, B. M., O’Neill, B. C. & Tebaldi, C. What would it take to achieve the Paris temperature targets?
_Geophys. Res. Lett._ 43, 7133–7142 (2016). Article Google Scholar * Field, C. B. & Mach, K. J. Rightsizing carbon dioxide removal. _Science_ 356, 706–707 (2017). Article CAS Google
Scholar * Keller, D. P. et al. The carbon dioxide removal model intercomparison project (CDRMIP): rationale and experimental protocol for CMIP6. _Geosci. Model Dev._ 11, 1133–1160 (2018).
Article CAS Google Scholar * Luderer, G. et al. Residual fossil CO2 emissions in 1.5-2 °C pathways. _Nat. Clim. Chang._ 8, 626–633 (2018). Article CAS Google Scholar * Rogelj, J.,
Popp, A. & Calvin, K. V. Scenarios towards limiting global mean temperature increase below 1.5 °C. _Nat. Clim. Chang._ 8, 325–332 (2018). Article CAS Google Scholar * Realmonte, G. et
al. An inter-model assessment of the role of direct air capture in deep mitigation pathways. _Nat. Commun._ 10, 3277 (2019). Article CAS Google Scholar * Held, I. M. et al. Probing the
fast and slow components of global warming by returning abruptly to preindustrial forcing. _J. Clim._ 23, 2418–2427 (2010). Article Google Scholar * Long, S.-M., Xie, S.-P., Zheng, X.-T.
& Liu, Q. Fast and slow responses to global warming: sea surface temperature and precipitation patterns. _J. Clim._ 27, 285–299 (2014). Article Google Scholar * Long, S.-M. et al.
Effects of ocean slow response under low warming targets. _J. Clim._ 33, 477–496 (2020). Article Google Scholar * Wu, P., Wood, R., Ridley, J. & Lowe, J. Temporary acceleration of the
hydrological cycle in response to a CO2 rampdown. _Geophys. Res. Lett._ 37, L12705 (2010). Article Google Scholar * Cao, L., Bala, G. & Caldeira, K. Why is there a short‐term increase
in global precipitation in response to diminished CO2 forcing? _Geophys. Res. Lett._ 38, L06703 (2011). Article Google Scholar * Chadwick, R., Wu, P., Good, P. & Andrews, T.
Asymmetries in tropical rainfall and circulation patterns in idealised CO2 removal experiments. _Clim. Dyn._ 40, 295–316 (2013). Article Google Scholar * Wu, P., Ridley, J., Pardaens, A.,
Levine, R. & Lowe, J. The reversibility of CO2 induced climate change. _Clim. Dyn._ 45, 745–754 (2015). Article Google Scholar * Kim, S.-K. et al. Widespread irreversible changes in
surface temperature and precipitation in response to CO2 forcing. _Nat. Clim. Chang._ 12, 834–840 (2022). Article CAS Google Scholar * Song, S.-Y. et al. Climate sensitivity controls
global precipitation hysteresis in a changing CO2 pathway. _npj Clim. Atmos. Sci._ 6, 1–10 (2023). Article Google Scholar * Zhou, S., Huang, P., Xie, S.-P., Huang, G. & Wang, L.
Varying contributions of fast and slow responses cause asymmetric tropical rainfall change between CO2 ramp-up and ramp-down. _Sci. Bull._ 67, 1702–1711 (2022). Article Google Scholar *
Song, S.-Y. et al. Asymmetrical response of summer rainfall in East Asia to CO2 forcing. _Sci. Bull._ 67, 213–222 (2022). Article CAS Google Scholar * Zhang, S., Qu, X., Huang, G. &
Hu, P. Asymmetric response of South Asian summer monsoon rainfall in a carbon dioxide removal scenario. _npj Clim. Atmos. Sci._ 6, 10 (2023). Article Google Scholar * Liu, C. et al.
Hysteresis of the El Niño-Southern Oscillation to CO2 forcing. _Sci. Adv._ 9, eadh8442 (2023). Article CAS Google Scholar * Yeh, S.-W. & Kirtman, B. P. ENSO amplitude changes due to
climate change projections in different coupled models. _J. Clim._ 20, 203–217 (2007). Article Google Scholar * Collins, M. et al. The impact of global warming on the tropical Pacific
Ocean and El Niño. _Nat. Geosci._ 3, 391–397 (2010). Article CAS Google Scholar * Liu, Z. et al. Evolution and forcing mechanisms of El Niño over the past 21,000 years. _Nature_ 515,
550–553 (2014). Article CAS Google Scholar * Cai, W. et al. ENSO and greenhouse warming. _Nat. Clim. Change_ 5, 849–859 (2015). Article Google Scholar * Maher, N., Matei, D., Milinski,
S. & Marotzke, J. ENSO change in climate projections: forced response or internal variability? _Geophys. Res. Lett._ 45, 11,390–11,398 (2018). Article Google Scholar * Zheng, X.-T.,
Hui, C. & Yeh, S.-W. Response of ENSO amplitude to global warming in CESM large ensemble: uncertainty due to internal variability. _Clim. Dyn._ 50, 4019–4035 (2018). Article Google
Scholar * Power, S., Delage, F., Chung, C., Kociuba, G. & Keay, K. Robust twenty-first-century projections of El Niño and related precipitation variability. _Nature_ 502, 541–545
(2013). Article CAS Google Scholar * Chung, C. T. Y., Power, S. B., Arblaster, J. M., Rashid, H. A. & Roff, G. L. Nonlinear precipitation response to El Niño and global warming in the
Indo-Pacific. _Clim. Dyn._ 42, 1837–1856 (2014). Article Google Scholar * Power, S. B., Delage, F. P. D., Chung, C. T. Y., Ye, H. & Murphy, B. F. Humans have already increased the
risk of major disruptions to Pacific rainfall. _Nat. Commun._ 8, 14368 (2017). Article CAS Google Scholar * Yan, Z. et al. Eastward shift and extension of ENSO-induced tropical
precipitation anomalies under global warming. _Sci. Adv._ 6, eaax4177 (2020). Article Google Scholar * Xie, X., Zhou, S., Zhang, J. & Huang, P. The role of background SST changes in
the ENSO-driven rainfall variability revealed from the atmospheric model experiments in CMIP5/6. _Atmo. Res._ 261, 105732 (2021). Article Google Scholar * Huang, P., Chen, D. & Ying,
J. Weakening of the tropical atmospheric circulation response to local sea surface temperature anomalies under global warming. _J. Clim._ 30, 8149–8158 (2017). Article Google Scholar *
Yang, K. et al. Increased variability of the western Pacific subtropical high under greenhouse warming. _Proc. Natl Acad. Sci. USA_ 119, e2120335119 (2022). Article CAS Google Scholar *
Kug, J.-S. et al. Hysteresis of the intertropical convergence zone to CO2 forcing. _Nat. Clim. Change_ 12, 47–53 (2022). Article CAS Google Scholar * Grabowski, W. W. & Moncrieff, M.
W. Moisture-convection feedback in the tropics. _Q. J. R. Meteorol. Soc._ 130, 3081–3104 (2004). Article Google Scholar * Bony, S. & Emanuel, K. A. On the role of moist processes in
tropical intraseasonal variability: cloud-radiation and moisture-convection feedbacks. _J. Atmos. Sci._ 62, 2770–2789 (2005). Article Google Scholar * Bretherton, C. S. & Sobel, A. H.
A simple model of a convectively coupled Walker circulation using the weak temperature gradient approximation. _J. Clim._ 15, 2907–2920 (2002). Article Google Scholar * Su, H. &
Neelin, J. D. Teleconnection mechanisms for tropical Pacific descent anomalies during El Niño. _J. Atmos. Sci._ 59, 2694–2712 (2002). Article Google Scholar * Neelin, J. D. & Su, H.
Moist teleconnection mechanisms for the tropical South American and Atlantic sector. _J. Clim._ 18, 3928–3950 (2005). Article Google Scholar * Lau, W. K. M. & Tao, W.
Precipitation-radiation-circulation feedback processes associated with structural changes of the ITCZ in a warming climate during 1980-2014: an observational portrayal. _J. Clim._ 33,
8737–8749 (2020). Article Google Scholar * Hu, K. et al. Interdecadal variations in ENSO influences on northwest Pacific-East Asian early summertime climate simulated in CMIP5 models. _J.
Clim._ 27, 5982–5998 (2014). Article Google Scholar * Tao, W. et al. Interdecadal modulation of ENSO teleconnections to the Indian Ocean Basin Mode and their relationship under global
warming in CMIP5 models. _Int. J. Climatol._ 35, 391–407 (2015). Article Google Scholar * Sun, N. et al. Amplified tropical Pacific rainfall variability related to background SST warming.
_Clim. Dyn._ 54, 2387–2402 (2020). Article Google Scholar * Tokinaga, H., Xie, S.-P., Deser, C., Kosaka, Y. & Okumura, Y. M. Slowdown of the Walker circulation driven by tropical
Indo-Pacific warming. _Nature_ 491, 439–443 (2012). Article CAS Google Scholar * Power, S. B., Delage, F., Colman, R. & Moise, A. Consensus on twenty-first-century rainfall
projections in climate models more widespread than previously thought. _J. Clim._ 25, 3792–3809 (2012). Article Google Scholar * Bretherton, C. S., Widmann, M., Dymnikov, V. P., Wallace,
J. M. & Bladé, I. The effective number of spatial degrees of freedom of a time-varying field. _J. Clim._ 12, 1990–2009 (1999). Article Google Scholar * Neelin, J. D. & Held, I. M.
Modeling tropical convergence based on the moist static energy budget. _Mon. Weather Rev._ 115, 3–12 (1987). Article Google Scholar Download references ACKNOWLEDGEMENTS We acknowledge the
World Climate Research Program for its coordination and promotion of CMIP6, facilitated by the Working Group on Coupled Modelling. This work is supported by the National Natural Science
Foundation of China (Grant Nos. 42141019, 42261144687, 42475048, 42175049, 42405041 and 42105032). AUTHOR INFORMATION AUTHORS AND AFFILIATIONS * State Key Laboratory of Numerical Modeling
for Atmospheric Sciences and Geophysical Fluid Dynamics, Institute of Atmospheric Physics, Chinese Academy of Sciences, Beijing, China Wen Zhang, Weichen Tao, Gang Huang, Kaiming Hu &
Xia Qu * University of Chinese Academy of Sciences, Beijing, China Wen Zhang & Gang Huang * Laboratory for Regional Oceanography and Numerical Modeling, Qingdao National Laboratory for
Marine Science and Technology, Qingdao, China Gang Huang * Center for Monsoon System Research, Institute of Atmospheric Physics, Chinese Academy of Sciences, Beijing, China Kaiming Hu, Xia
Qu & Hainan Gong * Key Laboratory of Earth System Numerical Modeling and Application, Institute of Atmospheric Physics, Chinese Academy of Sciences, Beijing, China Kaiming Hu, Hainan
Gong & Ya Wang * CSIRO Environment, Hobart, TAS, Australia Kai Yang * Earth System Numerical Simulation Science Center, Institute of Atmospheric Physics, Chinese Academy of Sciences,
Beijing, China Ya Wang Authors * Wen Zhang View author publications You can also search for this author inPubMed Google Scholar * Weichen Tao View author publications You can also search for
this author inPubMed Google Scholar * Gang Huang View author publications You can also search for this author inPubMed Google Scholar * Kaiming Hu View author publications You can also
search for this author inPubMed Google Scholar * Xia Qu View author publications You can also search for this author inPubMed Google Scholar * Hainan Gong View author publications You can
also search for this author inPubMed Google Scholar * Kai Yang View author publications You can also search for this author inPubMed Google Scholar * Ya Wang View author publications You can
also search for this author inPubMed Google Scholar CONTRIBUTIONS W.Z. designed the study, executed the data analyses, and authored the initial manuscript draft. W.T. contributed to the
research design and revised the initial draft. W.T., G.H., K.H., X.Q., H.G., K.Y., and Y.W. participated in critical discussions and contributed to the finalization of the manuscript.
CORRESPONDING AUTHORS Correspondence to Weichen Tao or Gang Huang. ETHICS DECLARATIONS COMPETING INTERESTS The authors declare no competing interests. ADDITIONAL INFORMATION PUBLISHER’S NOTE
Springer Nature remains neutral with regard to jurisdictional claims in published maps and institutional affiliations. SUPPLEMENTARY INFORMATION SUPPLEMENTARY INFORMATION RIGHTS AND
PERMISSIONS OPEN ACCESS This article is licensed under a Creative Commons Attribution-NonCommercial-NoDerivatives 4.0 International License, which permits any non-commercial use, sharing,
distribution and reproduction in any medium or format, as long as you give appropriate credit to the original author(s) and the source, provide a link to the Creative Commons licence, and
indicate if you modified the licensed material. You do not have permission under this licence to share adapted material derived from this article or parts of it. The images or other third
party material in this article are included in the article’s Creative Commons licence, unless indicated otherwise in a credit line to the material. If material is not included in the
article’s Creative Commons licence and your intended use is not permitted by statutory regulation or exceeds the permitted use, you will need to obtain permission directly from the copyright
holder. To view a copy of this licence, visit http://creativecommons.org/licenses/by-nc-nd/4.0/. Reprints and permissions ABOUT THIS ARTICLE CITE THIS ARTICLE Zhang, W., Tao, W., Huang, G.
_et al._ Irreversibility of ENSO impacts on the wintertime anomalous Western North Pacific anticyclone to CO2 forcing. _npj Clim Atmos Sci_ 7, 299 (2024).
https://doi.org/10.1038/s41612-024-00854-4 Download citation * Received: 27 August 2024 * Accepted: 26 November 2024 * Published: 05 December 2024 * DOI:
https://doi.org/10.1038/s41612-024-00854-4 SHARE THIS ARTICLE Anyone you share the following link with will be able to read this content: Get shareable link Sorry, a shareable link is not
currently available for this article. Copy to clipboard Provided by the Springer Nature SharedIt content-sharing initiative