- Select a language for the TTS:
- UK English Female
- UK English Male
- US English Female
- US English Male
- Australian Female
- Australian Male
- Language selected: (auto detect) - EN
Play all audios:
ABSTRACT Research on the impact of foreign direct investment (FDI) on environmental quality has not reached consensus. This paper examines the potential structural break in the relationship
between FDI and the environment from the perspective of economic scale. The results of the panel threshold estimation for 67 countries of different income groups show that the impact of FDI
on carbon emissions shifts from positive to negative at different income level stages, using GDP as the threshold. This conclusion is further verified by the group regression results of the
robustness test. When the GDP per capita is below $541.87, FDI shows a significant positive impact on carbon emissions, and this interval corresponds to a wide range of low-income economies
today, however, when the GDP per capita exceeds $541.87, this positive impact almost disappears. The negative impact of FDI on carbon emissions manifests itself once the GDP per capita
reaches $46515, and the sample countries corresponding to this interval since 2014 are mainly Switzerland, Iceland, Denmark, Sweden, the United States, Singapore, and Australia. Therefore,
we call on countries to raise their income levels so that they can cross the lower threshold and thus take advantage of the emission reduction effect provided by FDI. SIMILAR CONTENT BEING
VIEWED BY OTHERS EMPIRICAL STUDY ON THE RELATIONSHIP BETWEEN ECONOMIC GROWTH AND IMPLIED CARBON EMISSIONS IN WESTERN CHINA’S UNDERTAKING OF INTERNATIONAL INDUSTRIAL TRANSFER Article Open
access 08 October 2024 GLOBALIZATION’S EFFECTS ON SOUTH ASIA’S CARBON EMISSIONS, 1996–2019: A MULTIDIMENSIONAL PANEL DATA PERSPECTIVE VIA FGLS Article Open access 10 September 2024 THE
CARBON EMISSION REDUCTION EFFECT OF GREEN FISCAL POLICY: A QUASI-NATURAL EXPERIMENT Article Open access 02 September 2024 INTRODUCTION According to the latest edition of the United Nations
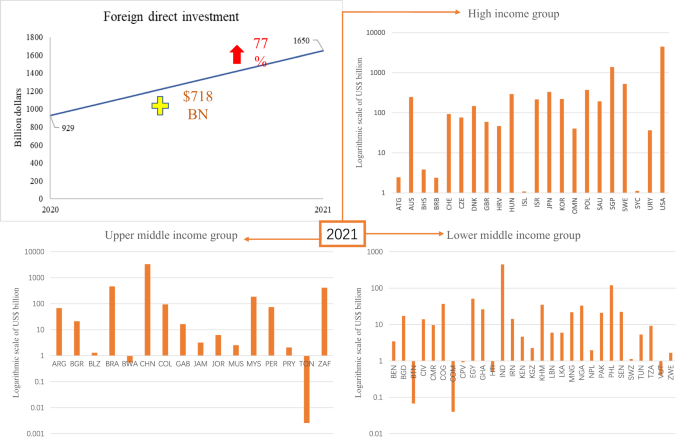
Conference on Trade and Development’s Global Investment Trends Monitor (UNCTAD, 2022), global foreign direct investment (FDI) flows rebound strongly in 2021, rising 77 percent to about $1.65
trillion from $929 billion in 2020, surpassing pre-Pandemic COVID-19 levels. Overall, global FDI flows grow by a total of $718 billion in 2021, with developed economies accounting for
nearly three-quarters of the total. Developing economies, particularly the least developed countries (LDCs), have seen more moderate growth in recovery. Figure 1 shows the change in global
FDI and the comparison of different income groups in 2021. The recovery in FDI flows from developing economies in sectors related to the SDGs remains fragile. Since the opening of the world
economy, FDI, as one of the key components of international transfers in the global economy, has had a significant impact on both developed and developing countries. Scholars have also
conducted a large number of theoretical and empirical studies on this issue. Among them, the representative endogenous growth model theory considers FDI as an important source of know-how,
human capital and technology diffusion, and the productivity brought by these factors can contribute to the economic growth of the host country through FDI inflows (Lucas, 1988; Rebelo,
1991; Iamsiraroj, 2016), at the same time, some early industrial economies with scarce capital and weak environmental regulations such as China India Indonesia South Africa rely mainly on
non-renewable energy technologies such as coal to attract FDI inflows in energy-intensive and carbon-intensive industries (Sarkodie and Strezov, 2019), it is undeniable that FDI inflows have
increased consumption of non-renewable energy and emission of pollutants in some host countries. Thus, while FDI promotes economic growth in host countries, it also poses many challenges to
the environmental quality of host countries. Therefore, the relationship between FDI and environmental quality has been a hot topic of research among scholars. Unfortunately, however, not
only have theoretical studies on FDI and environmental quality failed to reach clear conclusions, but the empirical studies conducted to resolve this contradiction seem to have exacerbated
the disagreement in the study of the relationship between the two. There are two main hypotheses about the relationship between FDI and environment, which seem to be contradictory. The
pollution paradise hypothesis supports that foreign investment causes environmental degradation in host countries, and enterprises in pollution-intensive industries are established in
countries with relatively low environmental standards. This hypothesis has been confirmed by many studies. (Aller et al., 2021) systematically examines the potential determinants of CO2
emissions. The results show that foreign direct investment exacerbates environmental degradation in low-income economies. (Chandrika et al., 2022)’s research confirms that India can be a
potential pollution haven for multinational corporations from high emitting countries. (Malik et al., 2020) argues that in both the long and short term, Pakistan is a pollution haven for
FDI. Another academic view is the pollution halo hypothesis, which proposes that foreign investment brings capital investment and technological development to the host country and therefore
improves environmental quality. Some academics support this hypothesis. (Zubair et al., 2020) finds that FDI inflows reduce Nigeria’s CO2 emissions. (Pazienza, 2019) argues that FDI is a
transfer of technological innovation that allows for a cleaner production model. (Saqib et al., 2023)’s empirical results show a negative correlation between FDI and ecological footprint,
validating the pollution halo hypothesis. To sum up the above views, the relationship between FDI and the environment is not a simple one-way effect, but a complex relationship with multiple
effects combined. Non-linear effects may exist between them. From another perspective, different research objects are one of the sources of conflicting concluding positions, and the
heterogeneity of these objects is mainly reflected in income levels, institutional quality, financial development, and environmental regulation. Income level is an important indicator of the
economic development of a country or region at the macro level. Another study (Shahbaz et al., 2019) on subgroups of countries with different incomes at high and low levels found that the
findings are sensitive to different income groups and regional analysis. So, are differences in social factors such as the quality of income level institutions responsible for the
conflicting findings of these empirical studies? That is, do these macro factors that measure the degree of social development correlate with the relationship between FDI and environmental
quality? A study considering income classification examines the relationship between FDI, economic growth, energy intensity and carbon emissions in countries along the Belt and Road,
revealing the need for policy makers to consider the relationship between various influences that lead to the growth of carbon emissions depending on the income level of different countries
(Abban et al., 2020). Moreover, educated publics in usually high-income countries often protest and demand a clean environment, and they have higher demands and preferences for environmental
quality (Dinda, 2004), a tendency that is also reflected at the level of institutional rules—stricter environmental regulations—in higher-income economies. To address environmental
degradation, some countries at higher income levels have adopted environmental regulations and various measures to reduce the use of fossil fuels. Overall, a country’s income level affects
the stringency of its environmental policies (Copeland, 2013). The above body of evidence suggests that discussing the reasons behind the opposing conclusions of existing studies on the
correlation between FDI and environmental quality from the perspective of income level thresholds helps us to gain insight into the relationship between FDI and environmental quality. In
this context, three research questions are posed: (1) Is there a nonlinear relationship between foreign direct investment and environmental quality? (2) If there is a nonlinear relationship,
is this effect related to income level? (3) Is there heterogeneity in the results across income groups? Based on panel data for 67 selected countries over the period 1990–2019, this study
attempts to address these three key questions. There are three main research contributions. First, the nonlinear relationship between FDI and carbon emissions is portrayed by a nonlinear
approach, which can reflect the nonlinear characteristics and structural breaks between the variables, bridging the gap in the exploration of nonlinear effects in this regard. Secondly, we
conduct regression analysis on mixed data from different income groups around the world with the help of a threshold effect model in order to derive the effect of income level on the
relationship between FDI and environmental quality, so as to propose possible explanations for the different conclusions reached by the above-mentioned empirical studies with different
samples, and thus try to resolve the conflicting findings of existing studies. Finally, by introducing the factors affecting the relationship between FDI and carbon emissions, we analyze the
possible deeper connection between the two opposing classical hypotheses, which provides a more comprehensive and profound understanding of these two hypotheses and the impact of FDI on
environmental quality, and offers a new perspective on the study of their correlation. The following is the organization of the article. The paper is divided into the following parts, the
first part is a background introduction, the second part is a comparative analysis and summary induction of the current literature on FDI and carbon emissions, the third part is a model
setup and methodological rationale, the fourth part is an analysis of the empirical results, and the fifth part is a conclusion. LITERATURE REVIEW The exploration of the theoretical
mechanism of the relationship between FDI and environmental quality has been the focus of scholars’ attention. Initially, Walter, Ingo et al. proposed the pollution haven hypothesis in 1979
(Walter and Ugelow, 1979), that developed countries have strict environmental management regulations and policies, and firms need to pay higher compliance costs for production activities in
these developed countries, therefore, driven by the principle of seeking to maximize profits, firms tend to shift production activities that are harmful to the environment to developing
countries with weaker environmental regulations and more productive resources. This leads to environmental degradation in developing countries. Therefore, the pollution sanctuary hypothesis
assumes that the introduction of FDI will adversely affect the host country’s environment. Although this hypothesis dominates the existing literature, it has been challenged by some,
representative of which are the proposed pollution halo hypothesis and Porter’s hypothesis. Porter et al. argue that strict environmental regulations can induce firms to undertake more
technological innovation, bringing more environmentally friendly and energy efficient production technologies and reducing the harm to environmental quality (Porter, van der Linde (1995)).
And the pollution halo hypothesis argues that the inflow of FDI prompts the spillover of more advanced and environmentally friendly production technologies from developed countries, which
greatly helps the industrial upgrading of host countries, and that FDI from developed countries increases the chances of ecological sustainability in host countries through the transfer of
environmentally sound technologies to developing countries, so they argue that FDI is beneficial to improving the environmental conditions of host countries. In addition, Raman et al.
investigate the validity of the “pollution haven” hypothesis from the perspective of trade in new technologies, and a cross-country analysis of international industrial location patterns
shows that there is no strong correlation between FDI flows to developing countries and the corresponding pollution content of these industries (Letchumanan and Kodama, 2000). And there is
evidence that foreign firms are more environmentally protective compared to their host country counterparts (Eskeland and Harrison, 2003), with some researchers noting that foreign firms
tend to have more advanced and mature management practices and environmentally friendly advanced technologies compared to their domestic counterparts and are therefore more environmentally
sensitive(Zhu et al., 2016). Most subsequent research has centered on the testing of these two contradictory hypotheses. Scholars have empirically tested data from different samples across
the globe to investigate the impact of FDI on environmental quality through linear or non-linear econometric techniques, yielding seemingly contradictory empirical findings. From the results
of the empirical studies, the main studies on the impact of FDI on environmental quality done by scholars so far fall into two main categories. One type of empirical studies is those that
argue that FDI has a positive impact on carbon emissions, and this type of empirical studies supports the existence of the pollution haven hypothesis. The other category is those that argue
that FDI has a negative impact on carbon emissions, and these studies emphasize the validity of the pollution halo hypothesis. Table S9 is an overview of some of the previous studies. The
impact of foreign direct investment on environment can be decomposed into scale effect, technology effect and compound effect. Under the combined action of the three effects, the specific
impact of trade on the environment depends on the game result between the positive and negative effects. The scale effect is the growth driven by FDI, as FDI depletes resources to increase
output, thus causing environmental degradation. The technology effect refers to the advanced management experience and environmentally friendly production technology that FDI brings to the
host country, which is beneficial to the environmental sustainability of the host country. And the combined effect means that the positive impact of FDI on income will cause the host
government and local residents to pay attention to the environmental quality due to the price decrease caused by the economy of scale. The impact of FDI on environmental quality is very
complex, and the impact of FDI on environmental quality dominated by these three effects is also multivariate. The nonlinear approach can capture the structural breaks in the relationship
between the two, reflect the nonlinear characteristics in the real world more comprehensively, and reduce the bias of the estimation results. The study of the impact of FDI and carbon
emissions is more suitable to be done by nonlinear methods. Therefore, Hypothesis 1 of this study is proposed. Hypothesis 1: There is a nonlinear relationship between foreign direct
investment and carbon emissions. In recent years, studies on the relationship between FDI and the environment, for one country or some regions with comparable income levels, have attracted
the interest of most scholars. It can be divided into two categories, one for developed countries and the other for underdeveloped countries. First, in an analysis of countries in the high
or low-middle income group, (Kivyiro and Arminen, 2014) show that the pollution haven hypothesis is validated in Kenya and Zimbabwe in their analysis of carbon emissions and FDI causality in
sub-Saharan Africa, and conversely, the Democratic Republic of Congo and South Africa observe disparate results supporting the pollution halo hypothesis. (Zhu et al., 2016) study the data
of five ASEAN countries from 1981 to 2011. The impact of FDI on medium and high emitting countries is found to be negatively and more pronounced in high emitting countries through panel
quantile regressions, and they point out that FDI can reduce carbon emissions in high emitters, and environmental regulations in ASEAN high emitting countries tend to be more concerned with
environmental quality, and multinational companies wanting to enter these countries need to have more environmentally friendly and cleaner production technologies and innovative management
models than their peer companies in the host countries. (Shekhawat et al., 2022) studies the drivers of carbon emissions in the SAARC region, and the negative elasticity coefficient of FDI
on carbon emissions refutes the “pollution haven hypothesis” of the SAARC region based on the results of FDI and trade openness. (Mahadevan and Sun, 2020) explored the carbon emissions of
China and Belt and Road countries by two-step GMM with robust standard errors. The results show that although Chinese OFDI to low-income countries along the Belt and Road has a pollution
halo effect, it does not have a significant effect on countries in other income groupings, and in a sense country along the Belt and Road do not have a statistically significant effect on
FDI from China. In addition, they point out that there are differences in the results obtained when different carbon emission indicators or FDI calculation criteria are chosen. Also using
two-step GMM, (Ren et al., 2014). find that FDI contributes to carbon emissions in China using sectoral data, which does not support the halo effect hypothesis. However, in contrast,
(Zhaocheng Wang et al., 2022) analyzed the impact of FDI and technological innovation on carbon emissions from high-tech industries in China using quantile regressions, and the results
reveal a negative impact of FDI on carbon emissions, with FDI and technological innovation shaping the energy intensity of high-tech industries, leading to fluctuations in carbon emissions
over time. Also analyzing panel data from China are Yu Zhang et al. and Xiaowei Liu et al., whose empirical tests support the pollution haven hypothesis. The largest inflows of FDI into
China continue to be in high carbon emitting industries such as chemical raw material and chemical product manufacturing, ferrous metal smelting and rolling processing industries. (Zhang and
Zhang, 2018) indicate that FDI inflows cause an increase in carbon emissions in China, and local governments are concerned that implementing policies that restrict FDI to the industries to
which it flows may damage the local economy. (Xiaowei Liu et al., 2021) use the Using estimation techniques that overcome cross-sectional dependence and endogeneity problems, regression
results from the Westerlund panel cointegration test and augmented mean group estimator suggest that renewable energy reduces the positive impact of FDI on increasing carbon emissions. In
addition, when studying FDI and foreign trade in China, (Hao and Liu, 2015) suggested that the impact of FDI on carbon emissions is divided into direct and indirect, with the direct impact
being negative and the indirect impact being positive, and in China the direct impact is dominant, thus the impact of FDI on carbon emissions is negative. Also empirically testing provincial
data in China, (Yiming Liu et al., 2017) compared the direct and indirect impacts of fixed asset investment (FAI) and FDI on environmental quality and the total impact, respectively, and
the study pointed out that FDI improves the efficiency of resource use in the production process, and therefore the direct and indirect impacts on China are reduced pollutant emissions,
which depends on the technology spillover from FDI resulting in The increase in total factor productivity and technology level in China (Yao and Wei, 2007). As one of the world’s largest
emerging economies, India is also the world’s fourth largest emitter of greenhouse gases (Nepal et al., 2021), and some scholars have selected India’s panel data of technological innovation,
FDI, trade openness, energy use, and economic growth from 1985 to 2017 to construct a vector error correction model, which reveals the existence of negative correlation between FDI and CO2
emissions in the long run and a unidirectional causal relationship from FDI to carbon emissions (Zameer et al., 2020). In the long run, FDI reduces the consumption of non-renewable energy
sources and in lieu of that, the adoption of energy efficient technologies by FDI is essential to reduce carbon emissions in India (Nepal et al., 2021). Therefore, they reject the existence
of the Indian pollution haven hypothesis. A study conducted regression analysis for China India Singapore data for 1980–2020 found that although FDI and capital accumulation have a
significant positive effect on economic growth, FDI has a very significant positive effect on carbon emissions. In addition, the results of the cross product term of FDI and renewable energy
consumption suggest that renewable energy can mitigate the contribution of FDI to carbon emissions, which may be due to the introduction of more advanced and environmentally friendly
production technologies in the countries by FDI(Luo et al., 2022). Some studies have shown that the impact of FDI on carbon emissions in Pakistan is substantial (Ali et al., 2021). (Malik et
al., 2020) used ARDL and nonlinear ARDL covariance methods to analyze the symmetric and asymmetric effects of oil prices as well as FDI on carbon emissions in Pakistan from 1971–2014. In
terms of FDI, Pakistan’s mining and quarrying industry is the main attraction for foreign investors, which not only increases energy consumption, but also exacerbates environmental
degradation, a finding that supports the pollution haven hypothesis. The findings of another study on Pakistani data from 1975 to 2016 also support the pollution haven hypothesis (Naz et
al., 2019). (Rafique et al., 2020) conclude from AMG estimation and DH causality test on economic and social related data of BRICS countries for 1990–2017 that FDI, technological innovation
and financial development in BRICS countries have negative and statistically significant long-term association with carbon emissions. This finding supports the pollution halo hypothesis. The
inflow of FDI makes BRICS countries to increase the likelihood of environmental sustainability to a great extent. Second, some studies on developed economies in the high-income group do not
reach a consensus either. (Nguyen et al., 2021) select data for G6 countries from 1978 to 2014, and evidence from empirical models suggests that FDI has a weak and negative effect on carbon
emissions in G6 countries. Their results enlighten the G6 countries’ governments to accelerate the adjustment to low-carbon investments such as clean energy generation. In addition, (Abid
et al., 2022) conducted FMOLS regression estimation and causality tests on G8 countries (including UK, US, Canada, Germany, France, Italy, Russia, and Japan) data for 1990–2019 found
statistically significant long-run and negative relationships between FDI, financial development, and technological innovation and carbon emissions. Moreover, there is a unidirectional
causal relationship between FDI and carbon emissions, and the pollution halo hypothesis has been tested in the UK, US, Canada, Germany, France, Italy, Russia, and Japan. In addition, the
article points out that developed countries have developed strong pollution control regulations and probably developing countries are accepting this pollution. (Gökmenoğlu and Taspinar,
2016) developed an error correction model to empirically test the data for Turkey from 1974 to 2010, Their findings provide empirical proof of the effectiveness of the PHH. (Rafindadi et
al., 2018) executed a regression analysis for six GCC member countries (GCC-Saudi Arabia, UAE, Qatar, Kuwait, Oman, Bahrain) that are all high-income countries and found that while the scale
effect of FDI during the study period supports the existence of pollution havens in the Gulf countries, the structural effect of FDI significantly reduces the carbon emissions in these
countries. In general, FDI inflows significantly reduced environmental degradation. However, increased energy consumption associated with FDI inflows can lead to increased deterioration. In
contrast to these support the pollution halo hypothesis, (Balsalobre-Lorente et al., 2022) investigated the dynamic association between economic complexity, FDI, renewable energy,
urbanization process and carbon emissions in five countries, Italy, Spain, Ireland, Portugal and Greece from 1992–2019 through DOLS estimator and the results showed that FDI in the long run
The results show that FDI positively affects carbon emissions in the long run, validating the pollution haven hypothesis for these countries. (Shahbaz et al., 2018) empirically test the data
for France from 1955–2006 and show that FDI degrades the environment, supporting the pollution haven hypothesis for France. In addition, ARDL Granger causality analysis shows that FDI has a
feedback effect on carbon emissions. Finally, some scholars have also studied mixed data for countries in the low-income group or for countries in different income groups globally. One
study estimated long-run cointegration on data from 1970 to 2017 for West African countries and their findings validated the pollution haven hypothesis in some West African countries
(Halliru et al., 2021). (Omri et al., 2014) developed a dynamic joint cubic equation system model for global panel data consisting of 54 countries over the period 1990–2011 and grouped
different regions. Empirical tests find evidence of bidirectional causality between FDI inflows and economic growth present in all subgroups (Europe and Central Asia, Latin America and the
Caribbean, and the Middle East, North Africa, and Sub-Saharan Africa), as well as causality between FDI and CO2 for all panels except Europe and North Asia. Another study from dynamic panel
data for 188 countries showed a significant negative effect of FDI on carbon intensity in high-income and low- and middle-income countries (Shao, 2018).A heterogeneity analysis of the
correlation between FDI and environmental degradation in 99 high-, middle-, and low-income countries by (Shahbaz et al., 2015). FMOLS estimation reveals an inverted U-shaped relationship
between FDI and CO2 emissions in global and middle-income panels. In high-income countries FDI however improves the environmental quality. They also point out that FDI policies in industrial
and low-end production sectors in low-income countries can lead to serious environmental unsustainability. The results derived from the weighted and unweighted meta-averages infer that the
environmental impact of FDI is almost zero. After controlling for publication bias and individual heterogeneity, increased FDI is found to reduce emissions. This result provides empirical
test evidence for the pollution halo hypothesis from meta-analysis (Demena and Afesorgbor, 2020). Li et al. argue that in terms of trade structure, trade opening will only increase the
carbon emissions of lower middle income group(Li et al., 2021). In general, countries with similar levels of economic development at the same income level are more likely to draw similar
conclusions, while there are heterogeneities in income levels, environmental regulations, and social governance among different income groups, and the differences between groups may lead to
differences in the direction and magnitude of the effect of FDI on carbon emissions in the study. Therefore, it is necessary to consider other social factors that have an impact on the
relationship between FDI and carbon emissions to further analyze the heterogeneity of the impact of FDI on environmental quality in different economies. Through a review of the above
literature, Hypothesis 2 of this study is proposed. Hypothesis 2: When the income level of the research objects is heterogeneous, the impact of FDI on carbon emissions is different. From the
existing literature on empirical research methods, most scholars use econometric techniques of linear regression analysis to test the statistical impact of FDI on carbon emissions, such as
ARDL, VECM, FMOLS, and panel quantile regression econometric models, but these models cannot reflect the potential nonlinear characteristics between variables, especially when the data are
plagued by structural breaks, and ordinary cointegration estimation techniques do not provide reliable estimates. Recently, some scholars have also verified the nonlinear effects of FDI on
environmental quality using nonlinear methods. However, the exploration of nonlinear relationships is still scarce compared to the large-scale studies of linear relationships(Li et al.,
2022b). Threshold panel regression model is a widely used non-linear panel regression method that allows the effect of the explanatory variable on the explained variable to be divided into
different intervals based on the threshold variable. There are differences in the level of economic development across the globe. It is of great significance to explore the impact of FDI on
carbon emissions by taking income status as the threshold variable. Regression analysis of different income groups can provide robustness tests for the findings of Hypothesis 1 and
Hypothesis 2. Therefore, Hypothesis 3 of this study is proposed. Hypothesis 3: There is heterogeneity in the results of the three income group threshold regressions, supporting the
robustness of the established findings. To verify these three hypotheses, this paper examines the factor that influence the relationship between FDI and carbon emissions for 67 countries at
different income levels across the globe. We develop a nonlinear panel threshold regression (PTR) model to investigate the relationship between FDI and carbon emissions taking into account
the heterogeneity in income levels of the study population, to examine in depth the structural breaks in the relationship between FDI and carbon emissions, and to verify the nonlinear
characteristics caused by potential threshold effects in the relationship between them. MODELS, METHODS AND DATA In this paper, firstly, the effect of FDI on per capita carbon emissions is
initially investigated using a panel data approach. The baseline model is shown below. $$rjCO2_{it} = \alpha _0 + \alpha _1FDI_{it} + X^\prime \beta + \mu _i + \delta _t + \varepsilon _it$$
(1) where i denotes country, t denotes year, rjCO2 denotes per capita CO2 emissions, FDI denotes foreign direct investment, X denotes a set of control variables, _μ__i_ represents individual
effects, _δ__t_ represents time effects, and _ε__it_ is a random error term. However, model (1) cannot explore in depth the potential nonlinear characteristics of the impact of FDI on
carbon emissions and cannot describe the structural changes in the relationship between the two. A series of original papers by Hansen (Hansen, 1999; 2000; 1996) developed a new threshold
regression model. To verify the hypothesis proposed in Section _Literature Review_, this paper constructs the non-linear panel threshold regression model to investigate the effect of FDI on
carbon emissions, using economic development as the threshold variable. The threshold effect is a phenomenon of sudden structural change. It refers to the phenomenon that when one economic
parameter reaches a specific value, it causes a sudden shift to other forms of development to occur in another economic parameter. Income heterogeneity may be a key factor in the paradoxical
impact of FDI on carbon emissions. There are differences in economic development patterns, industrial scale and environmental regulations among countries around the world. There may be
structural differences in the impact of FDI on carbon dioxide emissions among different income groups. Therefore, this paper selects economic development as the threshold variable and
constructs the threshold regression model based on the theory proposed by Hansen. The single threshold model is shown in Eq. (2). $$\begin{array}{l}rjCO2_{it} = \alpha _0 + \alpha _1FDI_{it}
\times I\left( {rjGDP_{it} < \gamma } \right) + \alpha _2FDI_{it}t\\ \qquad\qquad\quad \times \,I\left( {rjGDP_{it} \ge \gamma } \right) + X^\prime \beta + \mu _i + \delta _t +
\varepsilon _{it}\end{array}$$ (2) Considering the possible existence of multiple thresholds, the single-threshold panel regression model was extended to a multi-threshold panel model as
follows. $$\begin{array}{l}rjCO2_{it} = \alpha _0 + \alpha _1FDI_{it} \times 1\left( {rjGDP_{it} < \gamma _1} \right) + \alpha _2FDI_{it}\\ \qquad\qquad\quad\times \,I\left(\gamma _1 \le
rjGDP_{it} < \gamma _2 + \cdots + \alpha _nFDI_{it} \right.\\ \qquad\qquad\quad\times \,I\left( {\gamma _{n - 1} \le rjGDP_{it} < \gamma _n} \right) + \alpha _{n + 1}FDI_{it}\\
\qquad\qquad\quad\times \,I\left( {rjGDP_{it} \ge \gamma _n} \right) + X^\prime \beta + \mu _i + \delta _t + \varepsilon _{it} \left)\right.\end{array}$$ (3) The threshold regression method
allows one variable to be selected as the threshold variable, the regression model to be divided into intervals based on the threshold value searched for, each interval having a different
expression for the regression equation, the other sample values to be grouped according to the interval divided by the threshold value, and the change in coefficients between the different
intervals to be compared after regression. It is an objective method of econometric analysis, and the method has certain advantages in applied research. Firstly, it does not require a given
form of non-linear equation, and the threshold and its number are determined entirely endogenously by the sample data. Secondly, the method provides an asymptotic distribution theory to
establish confidence intervals for the parameters to be estimated, while the bootstrap method can also be applied to estimate the statistical significance of the thresholds. The threshold
model addresses the question of whether there is an inflection point between the explanatory variable and the explained variable, and whether it appears as a segmented function. Moreover,
the use of threshold variables to determine different cut-off points, and thus the use of observations of threshold variables to estimate the appropriate threshold, can effectively avoid the
bias caused by the subjective method of determining cut-off points used by general researchers. In order to investigate the relationship between economic development, foreign direct
investment and carbon emissions, the purpose of this paper is to investigate the impact mechanism of FDI on carbon emissions in the presence of income heterogeneity. Panel threshold
regression model is appropriate and reliable for the non-linear causality study of the three variables in this paper. This paper aims to investigate the mechanism of the non-linear impact of
foreign direct investment on carbon emissions under heterogeneous income levels. We use a panel dataset covering 67 countries worldwide from 1990 to 2019 to explore the dynamic
relationships between economic growth, foreign direct investment, financial development, population size, industrial structure, trade openness and the environment. This paper uses carbon
dioxide emissions as a measure of environmental degradation. In this study, the explanatory variable is carbon dioxide emissions per capita. The threshold variable is GDP per capita; data
are in constant 2010 U.S. dollars. The explanatory variable is foreign direct investment. The control variables include financial development, population size, industry structure and trade
openness. These are all factors that measure the macroeconomic and social development of a country or region, and they are all indicators closely related to environmental quality(Li et al.,
2022a). Some existing literature has confirmed the significance of the relationship between the selected variables and identified them as important factors affecting carbon emissions. The
results of many studies confirm the existence of a long-term relationship between carbon emissions, income, financial development and trade openness (Jalil and Feridun, 2011; Boutabba,
2014). (Acheampong, 2019) and (Chun Jiang and Ma, 2019) believe that financial development is an important factor affecting carbon emissions. (Yang et al., 2022)’s study and (Qiang Wang et
al., 2023b)’s research show that industrial structure upgrading has a significant impact on carbon emissions. On the basis of existing studies, variables are defined in this paper, as shown
in Table 1. Due to the smoothness and availability of data (data for the low-income group do not pass the cointegration test and therefore are not applicable to the modeling analysis), we
chose to study 67 countries from three different income groups: high, upper middle, and lower middle, with the specific grouping list coming from the World Bank, see Table S1 in
supplementary files for more details. The data selected cover the period from 1990 to 2019.These data are from the World Bank (World Bank, 2023). For the very few individual missing data,
the moving average method was used to fill in the missing data. The simple moving average method uses a set of recent historical data to forecast demand for one or more future periods. It is
one of the most common methods used in time series forecasting and is a common interpolation method for dealing with missing data values (Hansun, 2013). It is based on the principle of
finding the arithmetic mean of a number of historical data in the past and using the arithmetic mean as a forecast value for future period. This method is suitable for the processing of a
few individual missing data in this study. EMPIRICAL ANALYSIS BASIC ANALYSIS OF PANEL DATA Considering the effects of mitigating heteroskedasticity and autocorrelation as well as avoiding
pseudo-regressions (Qiang Wang et al., 2023a), we take the logarithmic form of the serial data for each variable for the analysis. Statistical descriptions of each variable are shown in
Table S5 in supplementary files. For GDP per capita, the mean of all observations after removing the logarithm is US$4,115.29, the maximum value is 91,264.11 and the minimum value is 113.37.
The mean value of carbon emissions per capita is 2.1311 metric tons. FDI has a mean value of 1.67% across all countries. The largest standard deviation for population size indicates that
the indicator is more discrete. Industrial structure has the smallest standard deviation, meaning that the values in this group deviate less from the mean. Financial development, foreign
direct investment, carbon emissions per capita and population size show a negative skew, while the data for the other variables show a positive skew. The Jarque-Bera test is a test of the
goodness of fit of the sample data for skewness and kurtosis consistent with a normal distribution. The null hypothesis is rejected for all variables (except for industrial structure) and
the series of these indicators do not satisfy normal distribution. Box line plots of the series of all variables are shown in Fig. 2. The results show that there are some outliers in the
series data. Often the outliers we observe are not as pronounced in their outlier nature as observed for the whole model. The information on the distribution of residuals is used to
determine the merit of the model and whether the residuals are outside the empirical range. For the model as a whole, these very few outliers are not very obvious. Therefore, this study
retains the outliers for the time being, pending a comprehensive analysis in conjunction with the overall model. In the subsequent analysis of the results, we also use a comparative analysis
of the robustness model based on the nature of the characteristics of the series variables. In addition, the outliers observed in the series are very few and the verification with the
actual situation proves the authenticity of these data. Retaining the true values for the regression analysis of the panel data increases the credibility of the study. In the model
calculations in this paper, we delete some discontinuous values and out-of-range values to make the data set a balanced panel. UNIT ROOT TEST AND COINTEGRATION TEST FOR PANEL DATA Before
coefficient estimation, the first and important step is to perform unit root tests on the data to ensure the smoothness of the data used, and this step is also to avoid pseudo-regressions
(Qiang Wang et al., 2023c). There are two main types of unit root tests, the LLC and Breintung methods for homogeneous panel hypotheses and the IPS, ADF-Fisher and PP-Fisher methods for
heterogeneous panel hypotheses. To make the test results more robust and convincing, we use both LLC test, IPS, Fisher-ADF and Fisher-PP tests in this work (Phillips and Perron, 1988;
Maddala and Wu, 1999; Levin et al., 2002; Im et al., 2003), and if the original hypothesis of the existence of unit root is rejected in both tests, we say that this series is stationary, and
vice versa. Considering the heterogeneity between different income groups, we performed group tests on the series of each variable. The results of the unit root test for the data of all
countries and three different income groups, high, upper middle and lower middle, are shown in Table S6 in supplementary files. The table gives the statistics and probability values at level
and at first order difference. The LLC, IPS, ADF and PP tests are performed for each variable at level. The results show that only one variable sequence, FDI, significantly rejects the null
hypothesis of the existence of unit root process, while all other variables fail the significance test. This result is applicable to all countries and the three income groups. Further, it
can be observed that all variable series significantly reject the null hypothesis at the first order difference and all pass the 1% significance level test. Therefore, the data for the
variables can be considered to be stationary for all countries and for the different income groups. Next, the cointegration test of each variable sequence can be carried out. The
cointegration test is used to analyze the long-term equilibrium relationship between variables (Qiang Wang et al., 2023d). We perform Pedroni Residual Cointegration Test (Pedroni, 2001), Kao
Residual Cointegration Test and Johansen Fisher Panel Cointegration Test on the variable series. Kao (Kao, 1999) uses the generalized DF and ADF tests were proposed to test for panel
cointegration. The null hypothesis of this approach is that there is no cointegration relationship and the residuals from static panel regressions are used to construct the statistic. The
Kao cointegration test was developed from the Engle-Granger test, but in the first stage regression, specific intercepts and homogeneity coefficients are assumed to exist between cross
sections. The cointegration test results of all countries panel data are shown in Table S7 in supplementary files. The results of the Pedroni Residual Cointegration Test indicate that the
original hypothesis of no cointegration relationship is rejected at the 1% significance level. Specifically, four of the seven tests (two within-dimension tests i.e., Panel PP-Statistic and
Panel ADF-Statistic and two between-dimension tests i.e., Group PP-Statistic and Group ADF- Statistic) indicate that the variables move together in long-run equilibrium in a model consisting
of a series of these variables. The results of the other two cointegration tests strongly reject the original hypothesis of “no cointegration” at the 1% level and conclude that there is a
cointegration relationship. The cointegration test results of the panel data of the three income groups are shown in Table S2, Table S3 and Table S4 in supplementary files. The variable
sequences of each income group passed the cointegration test. It indicates that there is a stable long-term equilibrium relationship among the variables we selected, such as carbon emission
per capita, FDI, trade openness, and financial development, and the residuals of their equation regressions are smooth. Therefore, the original equation can be directly regressed on this
basis, and the regression results are more accurate at this time. Otherwise, the choice of variables needs to be reconsidered. GLOBAL PANEL DATA ESTIMATION RESULTS To estimate the long-run
relationships between variables, we next model the data for analysis using FMOLS estimation in the linear estimation method and panel threshold model estimation in the nonlinear regression
method, respectively. FULLY MODIFIED ORDINARY LEAST SQUARES ESTIMATION There are endogeneity and serial correlation problems between ordinary least squares (OLS) regression variables, and to
address these problems, we apply FMOLS estimation. This estimation method was proposed by (Phillips and Hansen, 1990) and then further modified by (Pedroni, 2001). It focuses on
nonparametric methods to address serial correlation and endogeneity issues. Therefore, we use the FMOLS technique to test the long-run equilibrium relationship and the estimates of the
baseline model (1) are shown in Table 2. The long-run coefficient of rjGDP is 1.45 and the coefficient of the squared term of rjGDP is −0.18 and both are significant at the 1% level, which
confirms the existence of an inverted U-shaped EKC curve in the development history of these selected countries, as shown in Fig. 3. The economic growth process is accompanied by a shift in
environmental quality deteriorating before improving, which is consistent with the findings of (Balogh and Jámbor, 2017), (Sharif et al., 2019), (Menegaki and Tsagarakis, 2015) and (Bekhet
and Othman, 2018), among others. The long-run elasticity of our variable of interest, FDI, for carbon emissions per capita is 0.02, which indicates that FDI has a boosting effect on carbon
emissions per capita overall, with each 1% increase in FDI corresponding to a 0.02% increase in carbon emissions per capita. And this elasticity coefficient passed the 1% significance level
test, indicating that this FDI has a significant contribution to carbon emissions and that FDI exacerbates climate change and is an important factor in environmental degradation. This is the
same conclusion as (Xiaowei Liu et al., 2021), (Shahbaz et al., 2019) and (Sarkodie et al., 2020) et al. Also, our results support the pollution haven hypothesis (PHH). the elasticity
coefficient of FD with respect to rjCO2 is 0.12 and passes the 1% significance level test, i.e., every 1% increase in FD is accompanied by a 0.125% increase in carbon emissions per capita.
Financial development has a significant contribution to carbon emissions. Through risk diversification and technological progress, financial development promotes economic growth, which in
turn increases energy consumption and carbon emissions (Sadorsky, 2010; 2011). Our results provide a new empirical test evidence that financial development increases carbon emissions,
although no consistent conclusion has been reached in the study of the impact of financial development on carbon emissions (Acheampong, 2019; Acheampong et al., 2020). the elasticity
coefficient of ES on rjCO2 of 0.23 indicates that the larger the share of industry in the economic structure, the more it contributes to carbon emissions, and the coefficient is significant
at the 1% The elasticity coefficient of TP is 0.09 but not significant, indicating that the increase in total population has little contribution to carbon emissions. the elasticity
coefficient of TS is 0.02 but not significant indicating that the positive effect of trade opening on carbon emissions is also negligible. The FMOLS regression results for the high income
group, the upper middle income group and the lower middle income group are presented in Table 3. It can be observed that the EKC hypothesis is confirmed for all three income groups. For each
income group, GDP per capita has a positive effect on carbon emissions and the squared term has a negative effect on carbon emissions. This reflects an inverted U-shaped relationship
between the two. Financial development contributes to environmental degradation for each income group. The role of industrial structure, population size, foreign direct investment and trade
openness on environmental pressures is heterogeneous across income groups, with both positive and negative values of the regression coefficients. PANEL THRESHOLD REGRESSION ESTIMATION Before
conducting regression analysis, the primary concern is to determine whether a threshold effect exists and the number of thresholds that may exist. The original hypothesis of the threshold
test is H0:_α_1 = _α_2. If the original hypothesis holds, it indicates that there is no threshold effect, and vice versa, there is a threshold effect. Estimating the significance of the
threshold can be achieved by the method of bootstrap proposed by Hansen, and if there is a single threshold and thus a double threshold test can be performed. We use the bootstrap self-test
sampling method to calculate the F-statistic and the corresponding _P_ value, and the number of bootstrap self-test samples set in the empirical analysis is 300. Table 4 shows the results of
the threshold effect test. When carbon emission per capita is the explanatory variable, FDI is the core explanatory variable, and GDP per capita is the threshold variable, the _F_ value of
the double threshold effect is 42.92 and passes the 10% significance level test. The next step is to test the authenticity of the threshold estimates. The trend plot of likelihood ratio (LR)
with FDI as the core explanatory variable is shown in Fig. 4. Table 5 shows the two estimated threshold values. The first threshold value is 2.7339 and the second threshold value is 4.6676,
which are each within the 95% confidence interval. Therefore, we can assume that there is a double threshold effect of FDI on carbon emissions with income level as the threshold. The
presence of the threshold value indicates that income level is one of the important factors affecting the relationship between FDI and carbon emissions per capita. We constructed a static
panel threshold regression model with carbon emissions per capita as the explanatory variable, GDP per capita as the threshold variable, FDI as the core explanatory variable, and financial
development, population size, industrial structure and trade openness as the control variables, and the results of the panel threshold estimation are shown in Table 5. GDP per capita divides
the model into three intervals (Fig. 5). When the natural logarithm of GDP per capita is less than the first threshold value of 2.7339 (i.e., GDP per capita is <541.87 dollars), the
elasticity coefficient of FDI on carbon emissions is 0.11 and passes the 1% significance test, indicating that FDI has a significant positive effect on carbon emissions in this interval, and
when each 1% increase in FDI corresponds to a 0.11% increase in carbon emissions per capita. When the natural logarithm of GDP per capita is between 2.7339 and 4.6676 (i.e., GDP per capita
is >541.87 dollars and <46515 dollars), the elasticity coefficient of FDI on carbon emissions is 0.01 and insignificant, so we believe that FDI has almost no substantial effect on
carbon emissions in this interval. When the natural logarithm of GDP per capita is >4.6676 (i.e., GDP per capita is >46515 dollars), the elasticity coefficient of FDI on carbon
emissions is −0.08 and passes the 1% significance test, which indicates that it is different from the first two stages. For every 1% increase in FDI, carbon emissions per capita are
correspondingly reduced by 0.08%. In this interval FDI significantly affects carbon emissions negatively. This illustrates the existence of a non-linear effect of FDI on carbon emissions
with GDP per capita as the threshold. This nonlinear effect can be summarized as FDI significantly promotes carbon emissions when GDP per capita is <541.87 dollars, this positive
promotion effect disappears when GDP per capita exceeds 541.87 dollars and does not reach 46515 dollars, and FDI turns to inhibit carbon emissions when GDP per capita exceeds 46515 dollars.
The effect of FDI on carbon emissions shifts from positive to negative within different stages of GDP per capita. SPATIAL AND TEMPORAL DISTRIBUTION OF DIFFERENT THRESHOLD INTERVALS Based on
the above findings, we carve out the trends of the number of countries in different threshold intervals during 1990–2019 respectively as shown in Fig. 6. Figure 7 shows the values of average
FDI and average rjGDP per year for countries in different threshold intervals in order to better analyze the differences within the different threshold intervals. Figure 8 shows the spatial
heterogeneity of countries within different threshold intervals for 4 years, 1990, 1999, 2009, and 2019. For better understanding, a summary of the country names corresponding to Fig. 8 is
shown in Table S8. As can be seen in Fig. 6, overall, the number of countries between the two thresholds is consistently higher than in the other phases, accounting for about 85% of the
overall sample, and later in the study phase, the number of countries above the second threshold begins to grow from zero and stabilizes at seven, a number that represents about 10% of the
overall sample. The number of countries below the first threshold decreases from the initial 12 (18% of the overall) until the middle of the study phase, when all countries in the sample
have a GDP per capita above the first threshold. Specific analyses are presented below. In 1990, the number of countries with GDP per capita below 541.87 dollars accounted for about 18% of
the overall study population, and the number of countries with GDP per capita between 541.87 dollars and 46515 dollars accounted for about 82%, indicating that the first threshold is
relatively low and most countries can meet this threshold condition, but there are still some countries that are less developed and cannot meet this condition, as can be observed in Fig. 8.
This includes China, India, Kenya, Pakistan, Cambodia, and Ghana. These countries have a GDP per capita of only 332.593 dollars and are at the beginning stage of industrialization. The
number of countries below the first threshold range rises year by year thereafter until it peaks in 1994 and then begins to decline, and although there is a small rebound in 1997 and 1998,
the overall trend is downward. Among these twelve countries, the first with GDP per capita above 541.87 dollars were China, Sri Lanka and Bhutan. It was not until 2010 that the last country
below the first threshold, Nepal, finally entered the second stage with a GDP per capita above 541.87 dollars in that year. The relationship between FDI and carbon emissions in countries
below the first threshold interval is positive, as corroborated by (Bakhsh et al., 2017)’s study on (Solarin et al., 2017)’s study on Ghana. The number of countries between the high and low
thresholds has continued to increase slowly from 55 in fluctuations starting in 1990–60, with new entrants to this range being developing countries such as China, Bhutan, Haiti, and
Pakistan, and those exiting this range being developed countries such as Switzerland, Iceland, Denmark, and the United Kingdom. The average GDP per capita growth of countries in the
two-threshold range is very slow and this average is less than a quarter of the second threshold of 46515 dollars. This indicates that the state between the two thresholds is the norm for
most countries, and the difference between the low and high thresholds is large, so there is a lot of room for development in this, and the positive effect of FDI on carbon emissions is weak
during this period, and the growth of GDP per capita hinders the role of FDI in promoting carbon emissions. This also provides a possibility to explain why some studies have not concluded
the causal relationship between FDI and carbon emissions. In 1995 and 1996, Switzerland showed a GDP per capita above 46515 dollars, but then started to decline again until 2003, when it
again showed a GDP per capita above the second threshold, and has been rising since then. Immediately afterwards, developed countries such as Iceland, Denmark, Sweden, the United States, the
United Kingdom, and Australia also crossed the second threshold (GDP per capita over 46515 dollars), but the arrival of the subprime mortgage crisis in 2008 caused countries to suffer
different degrees of economic recession, especially Australia, the United Kingdom, and Iceland, three countries whose GDP per capita fell below the second threshold again. In the subsequent
period, the number of countries above the second threshold has remained around 7, and this number represents 10% of the number of overall study subjects. These seven countries are
Switzerland, Iceland, Denmark, Sweden, the United States, Singapore, and Australia, as can be seen from Fig. 8. The average GDP per capita in the high threshold range is generally on the
rise and is much higher than the average GDP per capita of the countries in between the two thresholds, with a gap of about six times, and this gap is still growing. According to our
findings, FDI in these countries has a dampening effect on per capita carbon emissions. This shows from the side that the second threshold is relatively high, challenging and difficult for
most of the sample countries, and many countries still have a long way to go in terms of economic development. In addition, the trend of the evolution of the average FDI in different
threshold intervals (Fig. 7) shows that the FDI in the high GDP per capita interval is generally larger than that in the low GDP per capita interval, but this gap is gradually narrowing. The
average FDI within all threshold intervals is in a fluctuating change due to the global economic crisis and market uncertainty. As can be learned from the figure, FDI in developed countries
fell to its lowest point during the study period in 2018, a period when the U.S. implemented tax reforms that caused FDI flows to OECD countries to fall by 23% year-on-year. For carbon
emissions per capita, the trend of average FDI in countries below the first threshold range from 1990 to 1994 at the beginning of the study period is roughly similar to the trend of average
carbon emissions per capita, suggesting that FDI below the first threshold range has a positive effect on carbon emissions. The possible reason is that these developing countries with low
GDP per capita regard FDI as an engine of economic growth and therefore have rather lenient policies and institutions in terms of environmental regulations (Sapkota and Bastola, 2017) as a
way to attract foreign capital inflows. A large number of energy-intensive and pollution-intensive industries have been transferred to these countries, bringing GDP growth along with a large
amount of environmental pollution and degradation. The trend of carbon emissions per capita in countries between the two thresholds does not seem to be practically correlated with the trend
of FDI, which can also indicate that to a certain extent the increase of GDP per capita hinders the promotion of carbon emissions by FDI. The per capita carbon emissions in the higher GDP
per capita range (above the second threshold range) are much larger than those in the other two threshold ranges, and numerically, the per capita carbon emissions in the high threshold range
are about more than twice as large as those in the other two threshold ranges, and the per capita carbon emissions in the high threshold range tend to decrease gradually after 2010. After
2010, we can observe that although FDI above the second threshold interval shows signs of rising, it corresponds to an accelerated decline in per capita carbon emissions during this period,
which justifies part of our conclusion on the threshold effect, i.e., that FDI has a significant dampening effect on carbon emissions at stages above the second threshold. The possible
reason for this is that after reaching a high level of economic development, people’s requirements and concerns about the environment are also greatly increased (Leiter et al., 2011), which
is manifested in policies and regulations that are more inclined to support foreign-owned enterprises that bring green innovations and energy-efficient production technologies, which to a
certain extent promotes the achievement of carbon emission reduction. ROBUSTNESS TESTS Next, we adopt a sub-sample regression to test the robustness of the above findings. Countries in
different income groups have different geographical locations and development histories, which lead to heterogeneity in income levels, economic structures, and population sizes, but
countries in the same income group inevitably have similarities in economic development, social governance, and institutional structures, so we run subgroup regressions based on World Bank
income level groups. The grouped regressions allow us to comprehensively compare the differences in the nonlinear relationship between FDI and carbon emissions among different income groups,
and to investigate the nonlinear mechanism through specific countries to propose a possible plausible explanation for the threshold effect of FDI on carbon emissions. Similar to the global
regression model, the model established by group regression has carbon emissions per capita as the explanatory variable, FDI as the core explanatory variable, GDP per capita as the threshold
variable, and control variables including trade openness, financial development, population size, and industrial structure. Table 6 shows the results of the threshold effect test for each
income group. The F-statistics of the single threshold effect for the high, upper middle and lower middle income groups are 35.19, 70.84 and 72.08, respectively. Combined with the threshold
values and _P_ values shown in the table, we can know that the three regression models for the high, upper middle and lower middle income groups pass the single threshold effect significance
level tests of 10%, 1% and 1%, respectively. It shows that there is a single threshold effect in the regression models for different income groups, and the corresponding threshold values
are 4.5027, 3.0601 and 2.7144, respectively, as shown in Table 6. The corresponding threshold curves, respectively, are shown in Fig. 9. The regression models (3) (4) (5) corresponding to
the high, upper middle and lower middle income groups, respectively, are shown in Table 6. Both model (3) and model (5) respond to the inverted U-shaped relationship between FDI and carbon
emissions under the threshold effect of GDP per capita. The difference is the magnitude of the elasticity coefficients of these two models in different intervals, that is, the degree of
FDI’s impact on carbon emissions. In model (3), the single threshold value is 4.5027, and the corresponding threshold variable per capita GDP is 31819.987. When the per capita GDP is below
31819.987, the elasticity coefficient of FDI is 0.03 and passes the 10% significance level test, indicating that FDI increases carbon emissions at this stage. At GDP per capita above this
threshold, the elasticity coefficient becomes −0.02 but not significant, indicating that the positive effect of FDI on carbon emissions disappears when the GDP per capita of countries in the
high-income group exceeds 31819.987. Instead, it inhibits the increase of carbon emissions, although this negative effect may not be significant. In model (5), the threshold is 2.7144,
which corresponds to a GDP per capita of 518.0837, and the elasticity coefficient of FDI is 0.11 below the threshold and significant at the 1% level, and −0.008 and insignificant above the
threshold. By comparison, the direction of the effect of FDI on carbon emissions is positive in both high income group countries and lower middle income group countries at the stage below
the threshold, but the positive influence is greater in the lower middle income countries. Above the threshold stage, the negative relationship between FDI and carbon emissions is not even
significant. The countries in the lower middle income group mainly include 30 countries that are less developed, such as India, Ghana, Egypt, Pakistan, Nigeria, and the Philippines. These
countries tend to have cheap labor and facilities, weaker environmental regulations, and more lenient policy regulations for high energy-consuming and polluting industries, thus attracting a
large number of pollution-intensive foreign enterprises. In the low-income stage, the local government makes economic profits at the cost of environmental degradation, so the growth of FDI
brings an increase in carbon emissions. This stage also corresponds to the period of the study time from 1990 to 2005, during which most of the studied lower middle income countries have GDP
per capita below the threshold value of 518.0837. According to the results of the group regression, there is a significant positive effect of FDI on carbon emissions in these lower middle
income countries. In model (4), the single threshold is 3.0601, which corresponds to a GDP per capita of 1148.418 dollars, and the elasticity coefficient of FDI on carbon emissions is −0.43
at the stage below this threshold, which may be due to the spillover of cleaner and environmentally friendly production technologies brought by stricter environmental regulations. Above the
threshold stage, the coefficient of FDI is not significant, although it is 0.01. Thus, the role of FDI in improving environmental degradation in these developing countries slowly disappears
as the income level increases. When GDP per capita below 1148.418 dollars, these countries have higher environmental standards and regulations compared to those in the lower middle income
group, which stimulates the need for FDI in these countries to improve their environmental friendliness and use cleaner and more efficient production technologies (Leiter et al., 2011).
Therefore, a possible explanation for the FDI coefficients on carbon emissions during the below-threshold phase is that the increase in FDI during this period leads to a reduction in energy
consumption and pollutant emissions in countries in these emerging markets through technology effects (Bao et al., 2008). This finding supports the pollution halo hypothesis (PHL), which is
the opposite of PHH, and the PHL states that FDI can have a positive impact on the environment through the transfer of environmentally sound production technologies from developed to
developing countries. However, as the income level increases, the gap between these countries and developed countries gradually shrinks, which is not enough to support the emission reduction
effect of FDI on these countries, so the effect of FDI to improve environmental degradation will slowly disappear above the threshold stage. DISCUSSION Reducing carbon emissions is an
urgent issue for policy makers at the current global level. The intensification of global capital flows has added to the difficulty of achieving this goal. Many scholars have conducted
empirical studies to investigate the impact of FDI on environmental pollution, and the current research has focused on the divergence between the pollution haven hypothesis and the pollution
halo hypothesis. We combine a discussion of the existing literature on theoretical mechanisms and a comparative analysis of empirical studies, and conduct an empirical study from the
perspective of the heterogeneity of income levels of the selected research subjects to explore other factors affecting the relationship between FDI and carbon emissions, which helps to
verify whether there is a threshold effect in the relationship between FDI and carbon emissions that leads to a non-linear feature of the correlation between the two. It further investigates
the potential structural break in the relationship between FDI and environmental quality, and to some extent reflects the reasons behind the contradictory positions that appear in the
existing literature, so as to draw a possible deeper connection between these two opposing hypotheses, with a view to providing some help for a more comprehensive and profound understanding
of these two hypotheses and the impact of FDI on environmental quality. This paper focuses on exploring the impact of differences in economic levels on cross-border capital flows and
environmental quality to explain the non-linear relationship between FDI and carbon emissions. 67 countries and three income groups are analyzed for heterogeneous results. The results of the
panel threshold estimation for all countries show a positive to negative shift in the impact of FDI on carbon emissions at different income level stages, using income level as the
threshold. The double threshold effect is significant and the non-linear effect divides the impact of FDI on carbon emissions into three stages with coefficients of 0.1180, 0.0122, −0.0887.
The two estimated thresholds are 2.7339 and 4.6676 respectively. Hypothesis 1 proposed in this paper is tested and there is a non-linear relationship between FDI and carbon emissions. The
growth of GDP per capita changes the relationship between FDI and carbon emissions. Further, the growth of GDP per capita will, to some extent, hinder the positive contribution of FDI to
carbon emissions and change the relationship to a negative one, thus showing the carbon reduction effect of FDI. The emergence of the positive relationship between FDI and carbon emissions
at the lower GDP per capita stage is consistent with the findings of the studies mentioned in the previous section (Menegaki and Tsagarakis, 2015; Bekhet and Othman, 2018; Sharif et al.,
2019), which suggest that FDI accelerates environmental degradation. It is also in line with our previous conclusion derived from FMOLS estimation, which indicates the existence of FDI to
increase carbon emissions. On this basis, the results of the panel threshold model estimation established in our study improve and refine this existing conclusion with a non-linear theory
and form, and the finding that distinguishes it from any previous study is that the relationship between FDI and environmental quality depends to a large extent on the level of income.
Specifically, the effect of FDI on carbon emissions is not always positive, but there is a double threshold effect with the level of economic growth as the threshold, with FDI showing a
significant positive effect on carbon emissions when GDP per capita is below 541.87 dollars, however, this positive effect is minimal when GDP per capita exceeds 541.87 dollars. The negative
effect of FDI on carbon emissions manifests itself once the GDP per capita reaches 46515 dollars. Our study supports the non-linear findings of (Shahbaz et al., 2015), (Yanqing Jiang, 2015)
and (Tang and Tan, 2015) on the relationship between FDI and carbon emissions. (Shahbaz et al., 2015) used data from 99 countries to conclude that the non-linear relationship between FDI
and CO2 emissions has an inverted U-shape, specifically, their study shows that as FDI reaches a threshold level, FDI initially increases carbon emissions and then decreases CO2 emissions.
However, their findings do not explore and explain more about the specific threshold level and the mechanism of action. Our study further quantifies and analyzes the nonlinear relationship
between FDI and carbon emissions when GDP per capita is the threshold variable and will try to explain the possible causal mechanisms behind this finding in the next section of the
heterogeneity analysis. Our panel dataset includes 67 countries from different income groups around the world, which is a broader study compared to the analysis of (Yanqing Jiang, 2015) and
(Tang and Tan, 2015) for a single specific country, and thus our work is more general in comparison. At the same time, the threshold intervals corresponding to the income levels of different
countries at different time periods are very different, and according to our results, the impact of FDI on carbon emissions varies, which to some extent provides a reasonable explanation
for the inability of existing empirical studies to reach consistent conclusions. In other words, the pollution haven hypothesis and the pollution halo hypothesis may exist in the same host
country at different income levels of development, which are not contradictory, but FDI shows opposite effects on environmental pollution at different income levels, so that the effect of
FDI on environmental quality is also related to the exogenous factor of current income level. This conclusion corresponds to Hypothesis 2, that is, the impact of FDI on carbon emissions is
different when the income level of the research objects is heterogeneous. Panel regression analysis of the three income groups is conducted to compare the differences in the nonlinear
relationship between FDI and carbon emissions among different income groups, and a reasonable explanation is proposed for the existence of nonlinear effects caused by economic development as
the threshold variable. It can test the robustness of existing conclusions. The three income groups all show the single threshold effect, and the estimated threshold values have significant
differences. The direction of the effect of FDI on carbon emissions corresponding to the stage above the threshold in the high-income group model and the stage above the second threshold in
the global model, respectively, are negative, which verifies the robustness of the analysis of the conclusion for the high-income group countries. The high-income group model mainly
includes 22 developed countries, including the United States, Japan, Korea, Australia, the United Kingdom, Denmark, and Switzerland. In both global model and high-income group, the per
capita GDP of these developed countries has exceeded the threshold (46515 or 31819.987) after 2005, so the effect of FDI in promoting carbon emission growth cannot be reflected, instead, the
income levels of these countries have crossed the threshold at this stage, and FDI has suppressed carbon emission. The possible reason for this is that developed countries already have
strong pollution control regulations in place(Abid et al., 2022). Our findings are consistent with those of (Alshubiri and Elheddad, 2019) for OECD countries on foreign finance, economic
growth and CO2 emissions nexus, both with inverted U-shaped curves. The income level of the lower middle income countries during 1990–2005 corresponds to the period below the first threshold
in the global model, and the elasticity coefficient of FDI on carbon emissions is also 0.11 and significant at the 1% level according to the global model estimation results. In other words,
the same set of study samples corresponding to different models yields consistent directions and magnitudes of effects, and the consistency of the findings, whether analyzed from the global
or grouped models, fully illustrates the robustness of our regression results. At the same time, this finding supports the pollution haven hypothesis (PHH) (Sapkota and Bastola, 2017;
Solarin and Al-Mulali, 2018). After crossing the threshold, this positive effect ceases to exist. Although the model regression results indicate that FDI inhibits carbon emissions above the
threshold stage, this effect is very weak and insignificant. However, the negative effect of FDI on carbon emissions in the upper middle income group model is very significant and strong.
The estimated threshold value of the upper middle income group is 3.0601. The threshold effect divides the influence of FDI on carbon emissions into two stages with regression coefficients
of −0.43 and 0.01, respectively. The countries in the upper middle income group include 16 developing countries such as China, South Africa, Malaysia, and Argentina, and almost all of them
cross the threshold during the study period except China. Therefore, according to the regression results of the upper middle income group model, FDI has a weak but insignificant contribution
to carbon emissions. While these countries correspond to the stage between the two thresholds in the global model during the study period, according to the regression results of the global
model, the coefficient of FDI on carbon emissions for the countries between the two thresholds is 0.01 and insignificant, both in terms of the direction and magnitude of the effect, which is
highly consistent with the regression results of upper middle income countries. Based on the above findings, Hypothesis 3 is confirmed, that is, the threshold regression results of the
three income groups have heterogeneity, which supports the robustness of the existing conclusions. There are both theoretical and practical implications in this study. Regarding theoretical
aspect, this paper constructs non-linear regression model of FDI-carbon emissions with economic development as the threshold variable. It covers the gap in the existing literature, deepens
the exploration of the non-linear relationship in existing studies in this field, and theoretically enriches the research system in the search for a harmonious development of environment and
economic growth. The model constructed in this paper can provide a theoretical reference for the study of threshold effects in other sample countries. In addition, transforming the model
with variables can be extended to explore the non-linear relationship between other variables. Regarding practical level, this study provides more focused and scientific recommendations for
reconciling the relationship between the use of FDI and the reduction of carbon emissions in different countries. It is of great significance to global sustainable development. CONCLUSION In
this paper, we use a panel data FMOLS regression model and a threshold regression model to develop an empirical analysis of annual data from 1990 to 2019 for 67 countries from the global
high, upper middle, and lower middle income groups. We set carbon emissions of each country as the explanatory variable in the model, the share of net FDI inflows as the core explanatory
variable, and GDP per capita (a measure of income level) as the threshold variable, while economic growth, financial development, population size, industrial structure, and trade openness
are included as control variables in a unified research framework. The results of the unit root test results indicate that all variable series are stationary in the form of first-order
differences. The results of the cointegration test indicate that there is a stable long-run equilibrium relationship between our selected carbon emissions per capita, FDI, trade openness,
financial development and other variables. With the premise of avoiding pseudo-regressions, we first use the FMOLS technique to test the long-run equilibrium relationships and derive the
regression results of the baseline model. The baseline model (1) confirms the existence of an inverted U-shaped EKC curve in the 67 sample countries. Further, the estimation results of the
panel threshold model show that there is a double threshold effect of FDI on carbon emissions with income level as the threshold, with thresholds of 2.7339 and 4.6676 (i.e., GDP per capita
of 541.87 dollars and 46515 dollars), respectively. The finding that distinguishes it from any previous study is that the relationship between FDI and environmental quality depends to a
large extent on income level. The presence of the threshold value indicates that the income level is one of the important factors affecting the relationship between FDI and carbon emissions
per capita. Moreover, the presence of the threshold effect leads to a non-linear effect of FDI on carbon emissions per capita. Specifically, the effect of FDI on carbon emissions is not
always positive, but there is a double threshold effect with the level of income as the threshold, when the GDP per capita is below 541.87 dollars, FDI shows a significant positive effect on
carbon emissions, and the countries corresponding to this interval since the beginning of the study until now include a large number of low-income economies, however, when the GDP per
capita exceeds 541.87 dollars, this positive effect almost disappears, and since 2014 this range corresponds to most of the countries in the sample, including China, Brazil, Peru, and
Pakistan. The negative effect of FDI on carbon emissions manifests itself once the GDP per capita reaches 46515 dollars, and the countries in the sample corresponding to this interval since
2014 are mainly Switzerland, Iceland, Denmark, Sweden, the United States, Singapore, and Australia. Finally, we test the robustness of the study findings by means of grouped regressions on
countries in different income groups. The direction and magnitude of the effect of FDI on carbon emissions are consistent across countries in different income groups, both in the three
single-threshold regression models obtained from the grouped regressions and in the global regression model. Overall, we believe that the seemingly opposing pollution haven hypothesis and
the pollution halo hypothesis are not contradictory, and the relationship between FDI and environmental quality also needs to consider the threshold factor of income level. Based on the
above findings, we propose the following recommendations. On the one hand, to get rid of the negative impact of FDI on the environment, low-income countries need to continuously promote
economic development efforts to raise the income level, so that the income level crosses the lower threshold range to play the emission reduction effect brought by the FDI inflows provided,
in the process of remediation of excessive pollutant emissions, to solve the pollution problem from the perspective of economic development. On the other hand, the lower income level of the
economy in the absorption of FDI inflows while strengthening environmental regulation efforts to improve the threshold of pollutant emissions in industrial transfer, to avoid high energy
consumption, high emissions and high pollution FDI inflows, absorb FDI advanced green production technology to promote the development of their industries to a cleaner and more efficient
direction. At the same time, developed countries also need to ensure that FDI flows to developing countries meet environmental standards and avoid transferring production technologies and
industrial activities that do not comply with environmental regulations in developed countries to developing countries. We call for a shared responsibility between developed and developing
countries to achieve emissions reductions and sustainable development goals. There are still some limitations in this paper. Due to the availability of data, the study period for this paper
is 1990–2019 and the scope of the study is 67 countries. Although the data used is the latest available data to meet the research needs, it is still relatively insufficient. The limited data
result in insufficient sample size. Secondly, in the selection of environmental indicators, this paper focuses only on carbon emissions. Carbon dioxide emissions are the main air pollutant,
and while the study’s findings reflect the factors influencing environmental quality, other pollution indicators or more integrated environmental indicators, such as ecological footprint
indicators, need to be further examined. In future studies, it is necessary to collect and collate more sample data for research. Expanding the research period and objects can make the
conclusion more convincing, so as to make the research results meet the current needs as much as possible. In addition, it is of great significance to select a wider range of environmental
variables for future research. DATA AVAILABILITY The data that support the findings of this study are openly available at
https://dataverse.harvard.edu/dataset.xhtml?persistentId=doi:10.7910/DVN/ZBWUNP&faces-redirect=true. REFERENCES * Abban OJ, Wu J, Mensah IA (2020) Analysis on the nexus amid CO2
emissions, energy intensity, economic growth, and foreign direct investment in Belt and Road economies: does the level of income matter. Environ Sci Pollut Res 27(10):11387–11402.
https://doi.org/10.1007/s11356-020-07685-9 Article CAS Google Scholar * Abid A, Mehmood U, Tariq S, Haq ZU (2022) The effect of technological innovation, FDI, and financial development on
CO2 emission: evidence from the G8 countries. Environ Sci Pollut Res 29(8):11654–11662. https://doi.org/10.1007/s11356-021-15993-x Article CAS Google Scholar * Acheampong AO (2019)
Modelling for insight: Does financial development improve environmental quality. Energy Econ 83:156–179. https://doi.org/10.1016/j.eneco.2019.06.025 Article Google Scholar * Acheampong AO,
Amponsah M, Boateng E (2020) Does financial development mitigate carbon emissions? Evidence from heterogeneous financial economies. Energy Econ 88:104768.
https://doi.org/10.1016/j.eneco.2020.104768 Article Google Scholar * Ali MU, Gong Z, Ali MU, Wu X, Yao C (2021) Fossil energy consumption, economic development, inward FDI impact on CO2
emissions in Pakistan: Testing EKC hypothesis through ARDL model. Int J Finance Econ 26:3210–3221. https://doi.org/10.1002/ijfe.1958 * Aller C, Ductor L, Grechyna D (2021) Robust
determinants of CO2 emissions. Energy Econ 96:105154 Article Google Scholar * Alshubiri F, Elheddad M (2019) Foreign finance, economic growth and CO2 emissions Nexus in OECD countries. Int
J Clim Change Strategies Manag 12(2):161–181 Article Google Scholar * Bakhsh K, Rose S, Ali MF, Ahmad N, Shahbaz M (2017) Economic growth, CO2 emissions, renewable waste and FDI relation
in Pakistan: New evidences from 3SLS. J Environ Manag 196:627–632. https://doi.org/10.1016/j.jenvman.2017.03.029 Article Google Scholar * Balogh JM, Jámbor A (2017) Determinants of CO2
Emission: A Global Evidence. Int J Energy Econ Policy 7(5):217–226 Google Scholar * Balsalobre-Lorente D, Ibáñez-Luzón L, Usman M, Shahbaz M (2022) The environmental Kuznets curve, based on
the economic complexity, and the pollution haven hypothesis in PIIGS countries. Renewable Energy 185:1441–1455. https://doi.org/10.1016/j.renene.2021.10.059 Article CAS Google Scholar *
Bao Q, Chen Y, & Song L (2008) The environmental consequences of foreign direct investment in China. China’s dilemma: Economic growth, the environment and climate change, Asia Pacific
Press: Canberra and The Brookings Institution Press, Washington, DC and Social Sciences. Academic Press, Beijing, p 243–264 * Bekhet HA, Othman NS (2018) The role of renewable energy to
validate dynamic interaction between CO2 emissions and GDP toward sustainable development in Malaysia. Energy Econ 72:47–61. https://doi.org/10.1016/j.eneco.2018.03.028 Article Google
Scholar * Boutabba MA (2014) The impact of financial development, income, energy and trade on carbon emissions: Evidence from the Indian economy. Econ Modelling 40:33–41.
https://doi.org/10.1016/j.econmod.2014.03.005 Article Google Scholar * Chandrika R, Mahesh R, Tripathy N (2022) Is India a pollution haven? Evidence from cross-border mergers and
acquisitions. J Cleaner Product 376:134355 Article Google Scholar * Copeland BR (2013) Trade and the environment. In: Bernhofen D, Falvey R, Greenaway D, Kreickemeier U (eds) Palgrave
handbook of international trade. Palgrave Macmillan, London, UK, p 423–496 * Demena BA, Afesorgbor SK (2020) The effect of FDI on environmental emissions: evidence from a meta-analysis.
Energy Policy 138:111192. https://doi.org/10.1016/j.enpol.2019.111192 Article Google Scholar * Dinda S (2004) Environmental Kuznets Curve Hypothesis: A Survey. Ecol Econ 49(4):431–455.
https://doi.org/10.1016/j.ecolecon.2004.02.011 Article Google Scholar * Eskeland GS, Harrison AE (2003) Moving to greener pastures? Multinationals and the pollution haven hypothesis. J Dev
Econ 70(1):1–23. https://doi.org/10.1016/S0304-3878(02)00084-6 Article Google Scholar * Gökmenoğlu K, Taspinar N (2016) The relationship between CO2 emissions, energy consumption,
economic growth and FDI: the case of Turkey. J Int Trade Econ Dev 25(5):706–723 Article Google Scholar * Halliru AM, Loganathan N, Golam Hassan AA (2021) Does FDI and economic growth harm
environment? Evidence from selected West African countries. Transnatl Corporations Rev 13(2):237–251. https://doi.org/10.1080/19186444.2020.1854005 Article Google Scholar * Hansen BE
(1996) Inference when a nuisance parameter is not identified under the null hypothesis. Econometrica 64(2):413–430 Article MathSciNet MATH Google Scholar * Hansen BE (1999) Threshold
effects in non-dynamic panels: Estimation, testing, and inference. J Econ 93(2):345–368 Article MathSciNet MATH Google Scholar * Hansen BE (2000) Sample splitting and threshold
estimation. Econometrica 68(3):575–603 Article MathSciNet MATH Google Scholar * Hansun S (2013) A new approach of moving average method in time series analysis. Paper presented at the
2013 Conference on New Media Studies (CoNMedia). Tangerang, Indonesia * Hao Y, Liu Y-M (2015) Has the development of FDI and foreign trade contributed to China’s CO2 emissions? An empirical
study with provincial panel data. Nat Hazards 76(2):1079–1091. https://doi.org/10.1007/s11069-014-1534-4 Article MathSciNet Google Scholar * Iamsiraroj S (2016) The foreign direct
investment–economic growth nexus. Int Rev Econ Finance 42:116–133. https://doi.org/10.1016/j.iref.2015.10.044 Article Google Scholar * Im KS, Pesaran MH, Shin Y (2003) Testing for unit
roots in heterogeneous panels. J Econ 115(1):53–74. https://doi.org/10.1016/S0304-4076(03)00092-7 Article MathSciNet MATH Google Scholar * Jalil A, Feridun M (2011) The impact of growth,
energy and financial development on the environment in China: A cointegration analysis. Energy Econ 33(2):284–291. https://doi.org/10.1016/j.eneco.2010.10.003 Article Google Scholar *
Jiang C, Ma X (2019) The Impact of Financial Development on Carbon Emissions: A Global Perspective. Sustainability, 11(19). https://doi.org/10.3390/su11195241 * Jiang Y (2015) Foreign Direct
Investment, Pollution, and the Environmental Quality: A Model with Empirical Evidence From the Chinese Regions. Int Trade J 29(3):212–227. https://doi.org/10.1080/08853908.2014.1001538
Article Google Scholar * Kao C (1999) Spurious regression and residual-based tests for cointegration in panel data. J Econ 90(1):1–44. https://doi.org/10.1016/S0304-4076(98)00023-2 Article
MathSciNet MATH Google Scholar * Kivyiro P, Arminen H (2014) Carbon dioxide emissions, energy consumption, economic growth, and foreign direct investment: Causality analysis for
Sub-Saharan Africa. Energy 74:595–606. https://doi.org/10.1016/j.energy.2014.07.025 Article CAS Google Scholar * Leiter AM, Parolini A, Winner H (2011) Environmental regulation and
investment: Evidence from European industry data. Ecol Econ 70(4):759–770. https://doi.org/10.1016/j.ecolecon.2010.11.013 Article Google Scholar * Letchumanan R, Kodama F (2000)
Reconciling the conflict between the `pollution-haven’ hypothesis and an emerging trajectory of international technology transfer. Res Policy 29(1):59–79.
https://doi.org/10.1016/S0048-7333(99)00033-5 Article Google Scholar * Levin A, Lin C-F, James Chu C-S (2002) Unit root tests in panel data: asymptotic and finite-sample properties. J Econ
108(1):1–24. https://doi.org/10.1016/S0304-4076(01)00098-7 Article MathSciNet MATH Google Scholar * Li R, Li L, Wang Q (2022a) The impact of energy efficiency on carbon emissions:
Evidence from the transportation sector in Chinese 30 provinces. Sustain Cities Soc 82:103880. https://doi.org/10.1016/j.scs.2022.103880 Article Google Scholar * Li R, Wang Q, Liu Y, Jiang
R (2021) Per-capita carbon emissions in 147 countries: The effect of economic, energy, social, and trade structural changes. Sustain Product Consumpt 27:1149–1164.
https://doi.org/10.1016/j.spc.2021.02.031 Article Google Scholar * Li R, Wang X, Wang Q (2022b) Does renewable energy reduce ecological footprint at the expense of economic growth? An
empirical analysis of 120 countries. J Cleaner Product 346:131207. https://doi.org/10.1016/j.jclepro.2022.131207 Article Google Scholar * Liu X, Wahab S, Hussain M, Sun Y, Kirikkaleli D
(2021) China carbon neutrality target: Revisiting FDI-trade-innovation nexus with carbon emissions. J Environ Manag 294:113043. https://doi.org/10.1016/j.jenvman.2021.113043 Article Google
Scholar * Liu Y, Hao Y, Gao Y (2017) The environmental consequences of domestic and foreign investment: Evidence from China. Energy Policy 108:271–280.
https://doi.org/10.1016/j.enpol.2017.05.055 Article Google Scholar * Lucas RE (1988) On the mechanics of economic development. J Monetary Econ 22(1):3–42.
https://doi.org/10.1016/0304-3932(88)90168-7 Article Google Scholar * Luo Y, Guo C, Ali A, Zhang J (2022) A dynamic analysis of the impact of FDI, on economic growth and carbon emission,
evidence from China, India and Singapore. Environ Sci Pollut Res. https://doi.org/10.1007/s11356-022-21546-7 * Maddala GS, Wu S(1999) A Comparative Study of Unit Root Tests with Panel Data
and a New Simple Test. Oxford Bull Econ Stat 61(S1):631–652. https://doi.org/10.1111/1468-0084.0610s1631 Article Google Scholar * Mahadevan R, Sun Y (2020) Effects of foreign direct
investment on carbon emissions: Evidence from China and its Belt and Road countries. J Environ Manag 276:111321. https://doi.org/10.1016/j.jenvman.2020.111321 Article CAS Google Scholar *
Malik MY, Latif K, Khan Z, Butt HD, Hussain M, Nadeem MA (2020) Symmetric and asymmetric impact of oil price, FDI and economic growth on carbon emission in Pakistan: Evidence from ARDL and
non-linear ARDL approach. Sci Total Environ 726:138421. https://doi.org/10.1016/j.scitotenv.2020.138421 Article CAS PubMed ADS Google Scholar * Menegaki AN, Tsagarakis KP (2015) Rich
enough to go renewable, but too early to leave fossil energy. Renewable Sustain Energy Rev 41:1465–1477. https://doi.org/10.1016/j.rser.2014.09.038 Article Google Scholar * Naz S, Sultan
R, Zaman K, Aldakhil AM, Nassani AA, Abro MMQ (2019) Moderating and mediating role of renewable energy consumption, FDI inflows, and economic growth on carbon dioxide emissions: evidence
from robust least square estimator. Environ Sci Pollut Res 26(3):2806–2819. https://doi.org/10.1007/s11356-018-3837-6 Article CAS Google Scholar * Nepal R, Paija N, Tyagi B, Harvie C
(2021) Energy security, economic growth and environmental sustainability in India: Does FDI and trade openness play a role. J Environ Manag 281:111886.
https://doi.org/10.1016/j.jenvman.2020.111886 Article Google Scholar * Nguyen DK, Huynh TLD, Nasir MA (2021) Carbon emissions determinants and forecasting: Evidence from G6 countries. J
Environ Manag 285:111988. https://doi.org/10.1016/j.jenvman.2021.111988 Article CAS Google Scholar * Omri A, Nguyen DK, Rault C (2014) Causal interactions between CO2 emissions, FDI, and
economic growth: Evidence from dynamic simultaneous-equation models. Econ Modelling 42:382–389. https://doi.org/10.1016/j.econmod.2014.07.026 Article Google Scholar * Pazienza P (2019) The
impact of FDI in the OECD manufacturing sector on CO2 emission: Evidence and policy issues. Environ Impact Assess Rev 77:60–68 Article Google Scholar * Pedroni P (2001) Fully modified OLS
for heterogeneous cointegrated panels. In Baltagi BH, Fomby TB, Carter Hill R (eds), Nonstationary Panels, Panel Cointegration, and Dynamic Panels. Emerald Group Publishing Limited, p.
93–130. https://doi.org/10.1016/S0731-9053(00)15004-2 * Phillips PCB, Hansen BE (1990) Statistical Inference in Instrumental Variables Regression with I(1) Processes. Rev Econ Studies
57(1):99–125. https://doi.org/10.2307/2297545 Article MathSciNet MATH Google Scholar * Phillips PCB, Perron P (1988) Testing for a unit root in time series regression. Biometrika
75(2):335–346. https://doi.org/10.1093/biomet/75.2.335 Article MathSciNet MATH Google Scholar * Porter M, van der Linde C (1995) Green and competitive: Ending the stalemate. Harvard
Business Rev 120–134 * Rafindadi AA, Muye IM, Kaita RA (2018) The effects of FDI and energy consumption on environmental pollution in predominantly resource-based economies of the GCC.
Sustain Energy Technol Assess 25:126–137. https://doi.org/10.1016/j.seta.2017.12.008 Article Google Scholar * Rafique MZ, Li Y, Larik AR, Monaheng MP (2020) The effects of FDI,
technological innovation, and financial development on CO2 emissions: evidence from the BRICS countries. Environ Sci Pollut Res 27(19):23899–23913. https://doi.org/10.1007/s11356-020-08715-2
Article CAS Google Scholar * Rebelo S (1991) Long-Run Policy Analysis and Long-Run Growth. J Political Econ 99(3):500–521. https://doi.org/10.1086/261764 Article Google Scholar * Ren
S, Yuan B, Ma X, Chen X (2014) International trade, FDI (foreign direct investment) and embodied CO2 emissions: A case study of Chinas industrial sectors. China Econ Rev 28:123–134.
https://doi.org/10.1016/j.chieco.2014.01.003 Article Google Scholar * Sadorsky P (2010) The impact of financial development on energy consumption in emerging economies. Energy Policy
38(5):2528–2535. https://doi.org/10.1016/j.enpol.2009.12.048 Article Google Scholar * Sadorsky P (2011) Financial development and energy consumption in Central and Eastern European
frontier economies. Energy Policy 39(2):999–1006. https://doi.org/10.1016/j.enpol.2010.11.034 Article Google Scholar * Sapkota P, Bastola U (2017) Foreign direct investment, income, and
environmental pollution in developing countries: Panel data analysis of Latin America. Energy Econ 64:206–212. https://doi.org/10.1016/j.eneco.2017.04.001 Article Google Scholar * Saqib N,
Ozturk I, Usman M, Sharif A, Razzaq A (2023) Pollution Haven or Halo? How European Countries Leverage FDI, Energy, and Human Capital to Alleviate their Ecological Footprint. Gondwana Res
116:136–148 Article ADS Google Scholar * Sarkodie SA, Adams S, Leirvik T (2020) Foreign direct investment and renewable energy in climate change mitigation: Does governance matter. J
Cleaner Product 263:121262. https://doi.org/10.1016/j.jclepro.2020.121262 Article Google Scholar * Sarkodie SA, Strezov V (2019) Effect of foreign direct investments, economic development
and energy consumption on greenhouse gas emissions in developing countries. Sci Total Environ 646:862–871. https://doi.org/10.1016/j.scitotenv.2018.07.365 Article CAS PubMed ADS Google
Scholar * Shahbaz M, Balsalobre-Lorente D, Sinha A (2019) Foreign direct Investment–CO2 emissions nexus in Middle East and North African countries: Importance of biomass energy consumption.
J Cleaner Product 217:603–614. https://doi.org/10.1016/j.jclepro.2019.01.282 Article Google Scholar * Shahbaz M, Nasir MA, Roubaud D (2018) Environmental degradation in France: The
effects of FDI, financial development, and energy innovations. Energy Econ 74:843–857. https://doi.org/10.1016/j.eneco.2018.07.020 Article Google Scholar * Shahbaz M, Nasreen S, Abbas F,
Anis O (2015) Does foreign direct investment impede environmental quality in high-, middle-, and low-income countries. Energy Econ 51:275–287. https://doi.org/10.1016/j.eneco.2015.06.014
Article Google Scholar * Shao Y (2018) Does FDI affect carbon intensity? New evidence from dynamic panel analysis. Int J Clim Change Strategies Manag 10(1):27–42.
https://doi.org/10.1108/IJCCSM-03-2017-0062 Article Google Scholar * Sharif A, Raza SA, Ozturk I, Afshan S (2019) The dynamic relationship of renewable and nonrenewable energy consumption
with carbon emission: A global study with the application of heterogeneous panel estimations. Renewable Energy 133:685–691. https://doi.org/10.1016/j.renene.2018.10.052 Article Google
Scholar * Shekhawat KK, Yadav AK, Sanu MS, Kumar P (2022) Key drivers of consumption-based carbon emissions: empirical evidence from SAARC countries. Environ Sci Pollut Res
29(16):23206–23224. https://doi.org/10.1007/s11356-021-17413-6 Article Google Scholar * Solarin SA, Al-Mulali U (2018) Influence of foreign direct investment on indicators of environmental
degradation. Environ Sci Pollut Res 25(25):24845–24859. https://doi.org/10.1007/s11356-018-2562-5 Article Google Scholar * Solarin SA, Al-Mulali U, Musah I, Ozturk I (2017) Investigating
the pollution haven hypothesis in Ghana: An empirical investigation. Energy 124:706–719. https://doi.org/10.1016/j.energy.2017.02.089 Article Google Scholar * Tang CF, Tan BW (2015) The
impact of energy consumption, income and foreign direct investment on carbon dioxide emissions in Vietnam. Energy 79:447–454. https://doi.org/10.1016/j.energy.2014.11.033 Article Google
Scholar * UNCTAD (2022) ‘World Investment Report 2022’. https://unctad.org/system/files/official-document/wir2022_en.pdf * Walter I, Ugelow JL (1979) Environmental policies in developing
countries. Ambio 8(2/3):102–109 Google Scholar * Wang Q, Li L, Li R (2023a) Uncovering the impact of income inequality and population aging on carbon emission efficiency: An empirical
analysis of 139 countries. Sci Total Environ 857:159508. https://doi.org/10.1016/j.scitotenv.2022.159508 Article CAS PubMed ADS Google Scholar * Wang Q, Wang L, Li R (2023b) Trade
protectionism jeopardizes carbon neutrality–decoupling and breakpoints roles of trade openness. Sustain Product Consumpt 35:201–215 Article CAS Google Scholar * Wang Q, Yang T, Li R
(2023c) Does income inequality reshape the environmental Kuznets curve (EKC) hypothesis? A nonlinear panel data analysis. Environ Res 216:114575. https://doi.org/10.1016/j.envres.2022.114575
Article CAS PubMed Google Scholar * Wang Q, Zhang F, Li R (2023d) Revisiting the environmental kuznets curve hypothesis in 208 counties: The roles of trade openness, human capital,
renewable energy and natural resource rent. Environ Res 216:114637. https://doi.org/10.1016/j.envres.2022.114637 Article CAS PubMed Google Scholar * Wang Z, Gao L, Wei Z, Majeed A, Alam
I (2022) How FDI and technology innovation mitigate CO2 emissions in high-tech industries: evidence from province-level data of China. Environ Sci Pollut Res 29(3):4641–4653.
https://doi.org/10.1007/s11356-021-15946-4 Article CAS Google Scholar * World Bank (2023) World Bank Open Data. https://data.worldbank.org/. Accessed * Yang Y, Wei X, Wei, J & Gao X
(2022) Industrial Structure Upgrading, Green Total Factor Productivity and Carbon Emissions. Sustainability, 14(2). https://doi.org/10.3390/su14021009 * Yao S, Wei K (2007) Economic growth
in the presence of FDI: The perspective of newly industrialising economies. J Comparative Econ 35(1):211–234. https://doi.org/10.1016/j.jce.2006.10.007 Article Google Scholar * Zameer H,
Yasmeen H, Zafar MW, Waheed A, Sinha A (2020) Analyzing the association between innovation, economic growth, and environment: divulging the importance of FDI and trade openness in India.
Environ Sci Pollut Res 27(23):29539–29553. https://doi.org/10.1007/s11356-020-09112-5 Article CAS Google Scholar * Zhang Y, Zhang S (2018) The impacts of GDP, trade structure, exchange
rate and FDI inflows on China’s carbon emissions. Energy Policy 120:347–353. https://doi.org/10.1016/j.enpol.2018.05.056 Article Google Scholar * Zhu H, Duan L, Guo Y, Yu K (2016) The
effects of FDI, economic growth and energy consumption on carbon emissions in ASEAN-5: Evidence from panel quantile regression. Econ Modelling 58:237–248.
https://doi.org/10.1016/j.econmod.2016.05.003 Article Google Scholar * Zubair AO, Samad A-RA, Dankumo AM (2020) Does gross domestic income, trade integration, FDI inflows, GDP, and capital
reduces CO2 emissions? An empirical evidence from Nigeria. Curr Res Environ Sustain 2:100009 Article Google Scholar Download references ACKNOWLEDGEMENTS This work is supported by National
Natural Science Foundation of China (Grant No. 72104246, 71874203). AUTHOR INFORMATION AUTHORS AND AFFILIATIONS * School of Economics and Management, China University of Petroleum (East
China), 266580, Qingdao, People’s Republic of China Qiang Wang, Ting Yang, Rongrong Li & Xiaowei Wang * School of Economics and Management, Xinjiang University, 830046, Wulumuqi,
People’s Republic of China Qiang Wang & Rongrong Li Authors * Qiang Wang View author publications You can also search for this author inPubMed Google Scholar * Ting Yang View author
publications You can also search for this author inPubMed Google Scholar * Rongrong Li View author publications You can also search for this author inPubMed Google Scholar * Xiaowei Wang
View author publications You can also search for this author inPubMed Google Scholar CORRESPONDING AUTHORS Correspondence to Qiang Wang or Rongrong Li. ETHICS DECLARATIONS COMPETING
INTERESTS The authors declare no competing interests. ETHICAL STATEMENTS This article does not contain any studies with human participants performed by any ofthe authors. INFORMED CONSENT
This article does not contain any studies with human participants performed by any ofthe authors. ADDITIONAL INFORMATION PUBLISHER’S NOTE Springer Nature remains neutral with regard to
jurisdictional claims in published maps and institutional affiliations. SUPPLEMENTARY INFORMATION SUPPLEMENTARY TABLE 1–9 RIGHTS AND PERMISSIONS OPEN ACCESS This article is licensed under a
Creative Commons Attribution 4.0 International License, which permits use, sharing, adaptation, distribution and reproduction in any medium or format, as long as you give appropriate credit
to the original author(s) and the source, provide a link to the Creative Commons license, and indicate if changes were made. The images or other third party material in this article are
included in the article’s Creative Commons license, unless indicated otherwise in a credit line to the material. If material is not included in the article’s Creative Commons license and
your intended use is not permitted by statutory regulation or exceeds the permitted use, you will need to obtain permission directly from the copyright holder. To view a copy of this
license, visit http://creativecommons.org/licenses/by/4.0/. Reprints and permissions ABOUT THIS ARTICLE CITE THIS ARTICLE Wang, Q., Yang, T., Li, R. _et al._ Reexamining the impact of
foreign direct investment on carbon emissions: does per capita GDP matter?. _Humanit Soc Sci Commun_ 10, 406 (2023). https://doi.org/10.1057/s41599-023-01895-5 Download citation * Received:
11 December 2022 * Accepted: 27 June 2023 * Published: 12 July 2023 * DOI: https://doi.org/10.1057/s41599-023-01895-5 SHARE THIS ARTICLE Anyone you share the following link with will be able
to read this content: Get shareable link Sorry, a shareable link is not currently available for this article. Copy to clipboard Provided by the Springer Nature SharedIt content-sharing
initiative