- Select a language for the TTS:
- UK English Female
- UK English Male
- US English Female
- US English Male
- Australian Female
- Australian Male
- Language selected: (auto detect) - EN
Play all audios:
ABSTRACT Surveys of fish diversity in complex heterogeneous environments are highly challenging to perform using traditional survey methods. Although environmental DNA (eDNA) metabarcoding
has been effectively used to evaluate fish diversity, studies exploring the spatial and temporal variability of fish communities in mosaic habitats and their connection to water quality
after ecological project implementation are still scarce. Here, we evaluated the changes in water quality and fish assembles using the traditional method and environmental DNA (eDNA)
metabarcoding after Ecological water replenishment (EWR) and the links between fish communities and water quality were established in the Baiyangdian (BYD) ecosystem in the North China
Plain. All water quality variables including TN, NH3-N, CODMn and TP showed a conspicuous improvement pattern, and the number of fish species increased notably after EWR. In addition, 6 more
introduced fish species were recorded when compared with the historical data before the implementation of the EWR project. Furthermore, the species richness showed a highly significant
difference among the four habitats in the summer 2020 and spring 2021 (spring: _P_ = 0.000; summer: _P_ = 0.002), and obvious discrimination of fish communities across two seasons was
observed (_P_ = 0.001) with eDNA metabarcoding. The water quality variables driving the changes of fish communities during the same period varied significantly across different habitats,
while not all showed noticeable discrepancy in driving cross-seasonal fish community changes. Thus, our study highlights that the continuous EWR improves the water quality and fish richness
but potential ecological issues associated with introduced species should be carefully considered after EWR. Our results also confirm that eDNA is a reliable tool for assessing fish
diversity and distinguishing spatiotemporal variability of fish communities in mosaic habitat ecosystems. SIMILAR CONTENT BEING VIEWED BY OTHERS EDNA METABARCODING REVEALS DIFFERENCES IN
FISH DIVERSITY AND COMMUNITY STRUCTURE IN DANJIANG RIVER Article Open access 27 November 2024 EDNA METABARCODING AS A PROMISING CONSERVATION TOOL TO MONITOR FISH DIVERSITY IN BEIJING WATER
SYSTEMS COMPARED WITH GROUND CAGES Article Open access 30 June 2022 QUANTITATIVE ENVIRONMENTAL DNA METABARCODING SHOWS HIGH POTENTIAL AS A NOVEL APPROACH TO QUANTITATIVELY ASSESS FISH
COMMUNITY Article Open access 13 December 2022 INTRODUCTION Fish are an integral component of freshwater ecosystems and play an essential role in the fisheries industry1. Nonetheless, global
fish diversity is under significant threat, predominantly due to anthropogenic disturbance, such as pollution, over-harvesting, and invasion of non-native species2. The extensive loss of
fish diversity highlights the urgent need for fish conservation. These efforts to preserve biodiversity rely essentially on biological monitoring to obtain precise information on species
composition and dynamic distributions of community3,4. Numerous ecological projects have been implemented for the conservation and restoration of ecosystems, with ecological water
replenishment (EWR) being one of the key measures4. Existing studies have shown that EWR can be capable of significantly improving water quality and alleviating eutrophication5,6,7. As a
crucial component of aquatic ecosystems, fish communities are bound to be affected and changed by the implementation of EWR in the receiving waters8,9. Qiu et al.9 investigated the
variations in fish community structure at Tian-e-Zhou Oxbow during the wet and dry phases of Yangtze River replenishment and demonstrated that water replenishment substantially enhanced fish
species richness and biomass9. Notably, during the replenishment period, migratory fish species such as _Hemiculter bleekeri_, which spawn in the mainstem of the Yangtze River, migrated
into Tian-e-Zhou Oxbow, thereby playing a critical role in increasing the biomass of migratory fish in the receiving waters9. In addition, Weng et al.8 demonstrated that appropriate EWR
facilitated fish migration and reproduction, with ensuring that the flow velocity of the entire migration channel meets the requirements for facilitating upstream movement being key to
restoring and enhancing fish diversity8. Furthermore, nutrients, organic pollutants, or natural factors including pH, water depth (DP), water temperature (WT), flow rate and dissolved oxygen
(DO) etc. are key to the changes of fish communities, above which provide more comprehensive information for fish recovery and management10,11. However, previous research has predominantly
focused on the influence of the EWR on water quality or fish assemblages, limited attention was given to the integrated influence of water quality and aquatic organisms, in which the key
factors driving changes in the biotic community remained unidentified. Thus, evaluating the changes of water quality and fish assembles after EWR and finding out the key factors affecting
the fish communities are of paramount importance for the conservation of fish biodiversity. The study of fish diversity, spatiotemporal patterns of fish assemblages, and the interactions
between fish communities and water quality factors has traditionally relied on morphological survey methods (e.g., anchored nets, trawling nets, three-floor hanging nets, and
electrofishing). However, these methods are highly challenging to implement in complex and heterogeneous habitats, including difficulties in identification, sampling challenges, and
insensitivity to low-abundance species, among others12,13. Emerging environmental DNA (eDNA) metabarcoding is a promising and effective method for estimating aquatic biodiversity and
dynamics distributions of community in mosaic habitats. This is due to its non-invasive nature, reliance on no morphological identification, high sensitivity, easily standardizable sampling
methods, and cost-effectiveness1,14. Nowadays, plenty of progress has already been made, and previous researches have mainly focused on estimating fish diversity using eDNA metabarcoding in
a specific habitat (e.g., river, lake or reservoirs; Zou et al.14; Blabolil et al.15), or habitats are relatively independent located adjacent to one another16,17. while numerous natural
ecosystems combine multiple habitat types and distributed in interlace. Therefore, there is an urgent need to address the fish assemblage characteristics using eDNA metabarcoding in mosaic
habitat ecosystems. The Baiyangdian (BYD) ecosystem, which is the most extensive freshwater wetland system on the North China Plain, functions as a vital water regulation hub within the
Daqing River basin18,19. The BYD ecosystem comprises an intricate network of diverse habitats interconnected by canals and ditches, with each individual lake linked through these channels19.
The water inflow into the Baiyangdian (BYD) ecosystem primarily consists of natural rainfall, water supplementation from upstream reservoirs (such as the Wangkuai, Xidayang, and Angezhuang
Reservoirs), and reclaimed water as well as inter-basin water transfers18. There are a total of eight water supply routes in BYD, namely Baigou River, Bao River, Cao River, Fu River, Tang
River, Xiaoyi River, Shulong River and Xiaobai River11. The water level of BYD cannot be well guaranteed from 1981 to 2017, despite the adoption of water replenishment measures; Due to the
serious water shortage problem in North China, BYD was even dry for 5 consecutive years between 1984 and 1988. Since 2018, the projects including the Yellow River Diversion Project, the
Middle Route of the South-to-North Water Diversion Project, Upstream Reservoir Replenishment Project and Reclaimed Water Replenishment Project have continued to provide EWR to BYD, which
ensured the water level of BYD and transformed the habitat18. Before the 5 years (1984–1988) of persistent drought in BYD ecosystem, the fish resources were exceptionally abundant, and its
fish yield had once ranked first among large lakes in China20. After the drought, the species richness of fish in BYD ecosystem sharply decreased, and the abundance of fish declined
significantly12. With the implementation of the EWR project (prior to 2017), environmental conditions gradually improved, and the fish community began to recover slowly21. However, the
species richness of fish remains significantly lower than the levels observed before the drought20,21. As the recovery of fish community is a long-term process, the changes in fish diversity
in BYD ecosystem following the continued EWR (since 2018) warrant further investigation. Additionally, prior studies have primarily focused on the overall fish community of BYD ecosystem,
without clarifying the specific characteristics and differences of fish communities across its interlaced habitats. Thus, this study evaluated the changes in environment and fish community
structures with the traditional method and eDNA metabarcoding after EWR across the complex heterogeneous habitats. The spatiotemporal distributions of fish communities were linked with water
quality factors to finding out the key factors affecting the fish communities. The aims of this study are as follows (i) evaluate the changes in water quality and fish assembles after
continuous EWR. (ii) clarify the connection between water quality parameters and fish assemblage dynamics, and identify the primary water quality factors driving spatiotemporal patterns of
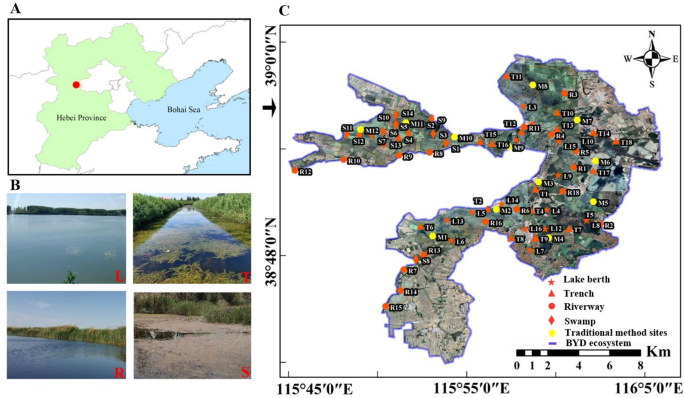
fish. (iii) assess the ability of eDNA metabarcoding for discriminating the spatiotemporal heterogeneity of fish communities within mosaic habitat systems. METHODS STUDY AREA AND SAMPLING
SITES The BYD ecosystem, located in Hebei Province, China, spans coordinates 38° 43′–39° 02′ N and 115° 38′–116° 07′ E, and covers a total area of 366 km219. The structure of the BYD
ecosystem is complex, and multiple habitats distribute crisscrosses. According to geography, physiognomy and ecological function, all of the sampling areas can be subdivided into four
habitats: lake berth (L), trench (T), riverway (R) and swamp (S). The spatiotemporal dynamics of fish diversity using eDNA metabarcoding and water quality variables were censused in August
2020 and March 2021 at 66 sampling sites across the four habitats of BYD ecosystem, in which the number of sampling sites in the L, T, R and S habitat was 16, 18, 18 and 14, respectively
(Fig. 1). The fish communities were investigated using the traditional method at 12 sites for both seasons (Fig. 1). In addition, five sections were set up to monitor the change of water
quality variables in real time after the implementation EWR from 2018 to 2021 (Fig. 1). TRADITIONAL METHOD Samples of the fish were obtained following the technical guidelines for
biodiversity monitoring - inland water fish (HJ 710.7–2014)22. Gillnets and traps were used to collect fish samples for the traditional method23. The gillnets, measuring 50.0 m in length and
1.5 m in height with uniformly stretched mesh sizes of 59.4, 66.6, 73.3, and 166.5 mm, were deployed perpendicularly to the shoreline at suitable locations for 3–4 h, after which the
samples were obtained. Traps, measuring 50.0 m in length and 30 centimeters in diameter, were positioned near aquatic vegetation for a period of 24 h. In addition, some catches were captured
from anglers and fisherfolk in the BYD ecosystem. The fish samples transported to lab at a low temperature (4 °C) within a 4-h timeframe. Fish specimens were morphologically identified
based on ichthyology and references24. EDNA METABARCODING One Liter water sample (from 5 to 10 cm below the surface) per site for eDNA metabarcoding was collected. The field crews wore
sterile gloves to collect and handle samples. The water samples were preserved at a low temperature (4 °C) in sterile plastic containers. The samples were filtered within 2 h using a 0.45 μm
sterile mixed ester membrane provided by JINTENG (Tianjin, China) and a filtration unit supplied by YUZE (Tianjin, China). The filtration volume of the samples was adjusted according to
water turbidity, with each sample being filtered until the filter membrane reached its clogging point. The filtration unit was sterilized with sodium hypochlorite to prevent contamination
between each site. All filtered membranes were kept separately in sterile centrifuge tubes and stored at − 20 °C prior to DNA extraction1. Five replicate samples were gathered from each
sampling location for eDNA metabarcoding. DNA was extracted from filtered membranes with MP FastDNA® Spin Kit provided by MP Biomedicals (California, USA) following instructions of the
manufacturer. To achieve PCR amplification, mitochondrial 16 S rRNA primers Ac16s-F (5’-CCTTTTGCATCATGATTTAGC-3’) and Ac16s-R (5’-CAGGTGGCTGCTTTTAGGC-3’) were utilized25. The amplification
protocol comprised an initial denaturation at 94 °C for 3 min, followed by 45 cycles of denaturation at 94 °C for 30 s, annealing at 60 °C for 30 s, and extension at 72 °C for 30 s. The
process concluded with a final extension at 72 °C for 5 min. The PCR amplification reaction was prepared with the following components: 4 µL 5× TransStart FastPfu Buffer, 2 µL 2.5 mM dNTP
solution, 0.8 µL forward primer at a concentration of 5 µM, 0.8 µL reverse primer at a concentration of 5 µM, 0.4 µL TransStart FastPfu DNA Polymerase, 10 ng template DNA, and ddH2O to
achieve a final volume of 20 µL. The PCR products from the same sample were combined and recovered using 2% agarose gel. Subsequently, the recovered products undergo quantification and
purification. Library construction was carried out using the NEXTFLEX Rapid DNA-Seq Kit from Bioo Scientific (Texas, USA). The sequencing was executed on the Illumina MiSeq platform. The
initial sequencing data were archived in NCBI Sequence Read Archive (SRA) and are associated with BioProject accession number PRJNA565582. These data are available for access via the link:
https://www.ncbi.nlm.nih.gov/sra/PRJNA734376. The accession number of samples ranged from SAMN21400475 to SAMN21401107. The initial sequencing data underwent demultiplexing, followed by
quality filtering with fastp v0.20.0, and was then merged utilizing FLASH v1.2.726. Operational taxonomic units (OTUs) were clustered based on a 97% similarity threshold using the UPARSE
v7.127,28. The taxonomy categories were compared and predicted with the Nucleotide Sequence Database (NT). The species-filtering steps to identify target species for eDNA metabarcoding are
detailed in in Fig. S1. Specifically, non-target species that are typically not classified as fish (such as bacteria and viruses) were removed. The species detected by both traditional
method and eDNA metabarcoding are considered target species. Additionally, Target species include fish identified in previous studies or known to exist in adjacent waters, as well as species
that were not previously recorded but are capable of surviving in the habitat. SAMPLE COLLECTION AND MEASUREMENT OF WATER QUALITY VARIABLES The environmental variables including WT, pH,
dissolved oxygen (DO), DP, Transparency (SD), total nitrogen (TN), ammonia nitrogen (NH3–N), Total phosphorus (TP), Potassium permanganate index (CODMn), and Chemical oxygen demand (CODcr)
were measured in August 2020 and March 2021 at 66 sampling sites across the four habitats of BYD ecosystem. In the field, WT, pH and DO were directly estimated using a YSI Professional Plus
(Pro Plus) Multiparameter water quality sonde from Xylem (Shanghai, China), and the DP was measured by PS-7 fl. portable echo sounder from Hondex (Tokyo, Japan). SD was analyzed with a
Secchi disk (STD, Changsha, China). At each site, 2 L water sample was obtained using water sampler and subsequently stored in hard glass bottle. TN was measured using ultraviolet
spectrophotometry with alkaline potassium persulfate digestion, whereas NH3–N was estimated via Nessler’s reagent colorimetry method29. TP was determined using the ammonium molybdate
spectrophotometry30. CODMn was analyzed using the acidic potassium permanganate method29. CODcr was measured using the dichromate method30. Thirteen sampling sites (approximately 20% sites)
were selected to conduct parallel sample analysis, and the precision was within 10% for TN, NH3–N, TP and CODcr and 20% for CODMn. The water quality variables including TP, NH3–N, CODMn and
TN for the five sections from 2018 to 2021 in real time were monitored by fixed water quality automatic monitoring system (LFWAMS-2010, Changsha, China). STATISTICAL ANALYSES ANALYSIS OF
FISH ASSEMBLAGES AND WATER QUALITY VARIABLES The number of species (species richness) detected through eDNA metabarcoding and traditional methods was calculated and compared based on a
species presence/absence Tables31,32. The percentage of species richness for a group (e.g., Cypriniformes) was determined as the species richness of this group divided by the total species
richness of all groups33,34. The species relative abundances were calculated based on the OTU abundance data33,35. Furthermore, the spatial distribution patterns of fish communities were
evaluated based on β-diversity. Nonmetric multidimensional scaling (NMDS) was employed to graphically represent these patterns with PICANTE package in R version 3.6.336. To assess
differences in the number of species per site at each taxonomic rank between spring 2021 and summer 2020, as well as the species richness and relative abundance of specific groups (e.g.,
Cypriniformes) per site across the two seasons, Mann–Whitney U tests were conducted. Additionally, Mann–Whitney U test was applied to evaluate variation in per water quality variable from
the two seasons37. Further, the discrepancy in water quality parameters and species richness among the four habitats were assessed with Kruskal-Wallis analysis. Additionally, the
permutational multivariate analysis of variance (PERMANOVA) was execute to estimate the differences in fish assemblages among the four habitats and two seasons with the VEGAN package in R v
3.6.338. ANALYSIS OF COMMUNITY-ENVIRONMENT INTERACTIONS The redundancy analysis (RDA) was applied to estimate and visualize the link between the distribution of fish communities and water
quality variables employing VEGAN package in R v 3.6.338. A forward selection procedure was then applied to identify water quality variables that made significant contributions (based on 999
random permutations) to the distribution patterns of fish communities38. A level of _P_ < 0.05 was used to determine statistical significance upon rejecting the null hypothesis. RESULTS
TEMPORAL TRENDS IN WATER QUALITY VARIABLES AND SPECIES RICHNESS AFTER EWR Changes in water replenishment quantity and water quality variables including TN, NH3–N, CODMn and TP after the
implementation EWR from 2018 to 2021 were documented. The water replenishment quantity changed distinctly, in which increased from 3.5 × 10⁹ m3 in 2018 to 13.62 × 10⁹ m3 in 2021. In
addition, all water quality variables exhibited a noticeable improvement pattern, among which TN decreased from 1.88 to 1.18 mg/L, NH3–N decreased from 0.21 to 0.05 mg/L, and CODMn decreased
from 11.33 to 5.39 mg/L from 2018 to 2021(Fig. 2). Additionally, the species richness of fish exhibited a gradual increase (Fig. 2). The species richness identified by traditional method in
summer 2018, 2019 and 2020 were 23, 25 and 31, respectively (the data in 2018 and 2019 from Wang et al.39). Furthermore, 46 fish species were recorded by eDNA metabarcoding, and 59 species
were found with integration of the traditional method and eDNA metabarcoding in summer 2020. COMMUNITY PROFILE OF BAIYANGDIAN ECOSYSTEM IN SUMMER 2020 AND SPRING 2021 SPECIES RICHNESS In
spring, a total of 17,583,710 reads were obtained, with individual sample read counts varying between 16,661 and 74,951 (mean ± _SD_: 54,103 ± 11,989; see Table S1). 44 fish species
belonging to 4 orders, 11 families, and 34 genera were identified using eDNA metabarcoding (Fig. 3A; Table S2). Three introduced species were detected in spring, including _Siniperca
knerii_,_ Micropterus salmoides and Hemiculter tchangi._ In summer, a total of 17,513,599 reads were obtained, with the number of reads from each sample ranging from 25,541 to 96,189 (mean ±
_SD_: 56,862 ± 12,451; Table S1), and 46 fish species from 5 orders, 12 families, and 26 genera were recorded (Fig. 3B; Table S2). Four introduced species were detected in summer, including
_S. knerii_, _Carassius cuvieri_,_ M. salmoides_ and _H. tchangi_. In total, 55 species from 5 orders, 12 families, and 41 genera were detected by eDNA metabarcoding between the two seasons
(Fig. 3C). For the traditional method, 29 fish species from 5 orders, 10 families, and 22 genera were recorded in the spring, whereas 31 fish species from 4 orders, 11 families, and 24
genera were detected in summer (Fig. 3A and B; Table S2). Introduced fish species were absent in spring but two were detected in summer, namely _Cyprinus carpio_ var. _specularis_ and
_Megalobrama amblycephala._ In total, 38 species from 5 orders, 12 families, and 27 genera were identified by the traditional method in two seasons (Fig. 3C). With the combination of the
traditional method and eDNA metabarcoding, 70 fish species were detected from 6 orders, 16 families, and 47 genera from two seasons, 54 species and 59 species are found in spring and summer,
respectively (Fig. 3A–C; Table S2). Compared with the traditional method, eDNA metabarcoding method identified 15, 15 and 17 more fish species in the spring, summer and the two seasons
combined, respectively (51.72%, 48.39% and 44.74% increases in detected taxa, respectively) (Fig. 3). For eDNA metabarcoding, Cypriniformes (39 species), Perciformes (10 species), and
Siluriformes (4 species) were the orders with the highest number of species, accounting for 70.91%, 18.18%, and 7.27%, respectively (Fig. 3D). Similarly, Cypriniformes (24 species),
Perciformes (9 species), and Siluriformes (3 species) accounted for 63.16%, 23.68%, and 7.89% of the traditional method, respectively (Fig. 3E). After the eDNA metabarcoding and traditional
datasets were combined, 6 orders were identified, and Cypriniformes (51 species) and Perciformes (14 species) were the dominant orders, making up 68.57% and 20.00%, respectively (Fig. 3F).
In addition, significant differences were observed in the number of species among the four habitats in the spring (Kruskal–Wallis analysis, x2 = 20.266, _P_ = 0.000) and summer
(Kruskal–Wallis analysis, x2 = 15.361, _P_ = 0.002). The cumulative number of detected species was higher in the T and R habitats, 33 and 36 species in spring, and 41 and 39 species in
summer, whereas 26 and 24 species were detected in spring, and 35 and 37 species were detected in summer in the L and S habitats, respectively (Fig. 4C). Furthermore, comparing the results
in the spring using eDNA metabarcoding, the number of species per site was obviously higher in the summer at the species level (Mann–Whitney U test, _Z_ = -6.365, _P_ = 0.000; Fig. 4A; Fig.
S2). RELATIVE ABUNDANCE In spring, the most abundant species was _Carassius auratus_ and _Pseudorasbora interrupta_ in the L and T habitats, making up 80.70% and 4.54% in the L habitat and
77.04% and 6.84% in the T habitat, respectively, whereas _C. auratus_ (69.99%) and _Acheilognathus chankaensis_ (6.68%) in the R habitat and _C. auratus_ (74.25%) and _Channa argus_ (6.26%)
in the S habitat, respectively (Fig. 5A). The total relative abundance of introduced fish species in spring accounted for 1.71%. In summer, the most abundant species was _C. auratus_ and _C.
argus_ in the T, R, and S habitats, making up 81.34% and 3.14% in the T habitat, 66.77% and 6.04% in the R habitat, and 73.08% and 5.50% in the S habitat, respectively, whereas _C. auratus_
(75.95%) and _Toxabramis swinhonis_ (5.55%; Fig. 5B) in the L habitat. The total relative abundance of introduced fish species in summer was 1.55%. At the order level, in spring,
Cypriniformes was the most dominant order, making up 96.07% in the L habitat, 97.51% in the T habitat, 96.08% in the R habitat, and 90.10% in the S habitat (Fig. 5C). In summer,
Cypriniformes and Perciformes were the most dominant orders, making up 97.41% and 1.65% in the L habitat, 92.69% and 6.62% in the T habitat, 85.97% and 12.99% in the R habitat, and 74.05%
and 24.91% in the S habitat, respectively (Fig. 5D). Moreover, obvious differences were observed in the relative abundance of Cypriniformes, Perciformes, and Cyprinodontiformes between
spring and summer (Mann–Whitney U test, Cypriniformes: _Z_ = -2.862, _P_ = 0.004; Perciformes: _Z_ = -3.161, _P_ = 0.002; Cyprinodontiformes: _Z_ = -4.315, _P_ = 0.000; Fig. 4B) but not
Siluriformes (Mann–Whitney U test, _Z_ = -0.405, _P_ = 0.686, Fig. 4B). In addition, the relative abundance was higher in the T and R habitats, 27.72% and 28.38% in spring, and 28.27% and
26.75% in summer, respectively, whereas those in the L and S habitats were 21.16% and 22.74% in spring and 23.47% and 21.51% in summer, respectively (Fig. 4D). The NMDS ordination revealed
that the species assemblages identified in spring differed among the four habitats (PERMANOVA, F = 1.859, _P_ = 0.017, Fig. 6A) and notably varied in summer (PERMANOVA, F _=_ 3.293, _P_ =
0.001, Fig. 6B). Moreover, the NMDS ordination also indicated that assemblages from two seasons significantly varied (PERMANOVA, F = 288.099, _P_ = 0.001, Fig. 6C). WATER QUALITY VARIABLES
AND KEY VARIABLES DRIVING FISH ASSEMBLAGES IN SUMMER 2020 AND SPRING 2021 In spring 2021, the range of mean in TN, CODMn, and DP were from 0.73 to 3.28 mg/L, 4.03 to 6.62 mg/L, and 1.8 to
3.0 m, respectively, and these variables showed the notably significant difference among the four habitats (Kruskal–Wallis analysis, _P_ < 0.01; Table S3); The range of mean in TP was
from 0.029 to 0.061 mg/L, and there was significant difference among four habitats (Kruskal–Wallis analysis, _P_ < 0.05; Table S3); The range of mean in NH3–N, CODCr, WT, DO, pH, and SD
were from 0.06 to 0.08 mg/L, 19.89 mg/L to 22.98 mg/L, 18.34 °C to 19.68 °C, 7.40 mg/L to 8.92 mg/L, 7.98 to 8.26, and 82 cm to 101 cm, and these variables showed no obvious difference among
the four habitats (Kruskal–Wallis analysis, _P_>0.05; Table S3). Furthermore, 77.80% of the variation in fish communities could be explained by the water quality variables, and the
indicators showing significant differences among habitats (TN, DP, and CODMn) were the key variables driving the distributions of the fish assemblages (TN: F = 4.1769, _P_ = 0.001; DP: F =
3.1971, _P_ = 0.002; CODMn: F = 2.7759, _P_ = 0.024; Fig. 6D). In summer 2020, the range of mean in TN and DP were from 1.43 to 15.38 mg/L and 2.0 to 4.0 m, respectively, and these variables
showed the highly significant difference among four habitats (Kruskal–Wallis analysis, _P_ < 0.01; Table S3); The range of mean in NH3–N and CODMn were from 0.17 to 0.64 mg/L and 4.10
mg/L to 5.92 mg/L, respectively, and these variables showed the obvious difference among the four habitats (Kruskal–Wallis analysis, _P_ < 0.05; Table S3). The range of mean in CODCr, TP,
WT, DO, pH, and SD were from 12.12 to 17.61 mg/L, 0.050 mg/L to 0.085 mg/L, 26.30 °C to 27.46 °C, 2.63 mg/L to 4.77 mg/L, 7.61 to 7.96, and 53 cm to 99 cm, and these variables showed no
significant difference among four habitats (Kruskal–Wallis analysis, _P_>0.05; Table S3). Interestingly, 78.76% of the variation in fish communities could be explained by the water
quality variables, and the key variables driving the distributions of the fish assemblages were also the discrepant indicators among four habitats, including TN, NH3–N, and DP (TN: F =
4.8621, _P_ = 0.003; NH3–N: F = 3.4454, _P_ = 0.003; DP: F = 2.2364, _P_ = 0.041; Fig. 6E). In addition, TN, NH3–N, CODCr, TP, WT, DO, pH, and SD between spring and summer varied
significantly (Mann–Whitney U test, _P_ < 0.01; Table S3), whereas CODMn and DP showed no significant difference between two seasons (Mann–Whitney U test, _P_ > 0.05; Table S4).
Furthermore, 85.69% of the variation in fish assemblages between the two seasons could be explained by the water quality variables, and TN, WT, DP, CODCr, pH, and CODMn were the key
variables driving the distributions of the fish communities across the seasons (TN: F = 6.4988, _P_ = 0.001; WT: F = 4.0287, _P_ = 0.001; DP: F = 3.2939, _P_ = 0.001; CODCr: F = 2.6063, _P_
= 0.003; pH: F = 2.0629, _P_ = 0.026; CODMn: F = 2.0006, _P_ = 0.032; Fig. 6F). DISCUSSION In this study, temporal trends in water quality variables after EWR were analyzed from 2018 to 2021
in the BYD ecosystem. Furthermore, the fish community status was obtained with eDNA metabarcoding and traditional method, spatiotemporal dynamics of fish communities were evaluated using
eDNA metabarcoding, and the relationship between fish assemblages and water quality variables was analyzed within mosaic habitats from BYD ecosystem. Our findings indicated that all water
quality variables exhibited a noticeable improvement pattern, and the fish richness was richer than historical data in the BYD ecosystem. In addition, the fish communities differed
significantly across multiple habitats and seasons, and the spatiotemporal variations in fish communities were closely linked to water quality variables in the BYD ecosystem. THE CHANGES IN
WATER QUALITY AND FISH RICHNESS AFTER EWR In the present study, the water quality variables including TN, NH3–N, CODMn and TP show a conspicuous improvement pattern, among which TN decreased
from 1.88 to 1.18 mg/L, NH3–N decreased from 0.21 to 0.05 mg/L, and CODMn decreased from 11.33 to 5.39 mg/L from 2018 to 2021 (Fig. 2). Additionally, the species richness of fish exhibited
a gradual increase (Fig. 2). The species richness detected with traditional method in summer 2018, 2019 and 2020 were 23, 25 and 31, respectively39. Furthermore, the more species were
recorded by eDNA metabarcoding (46 species), and combination of the traditional method and eDNA metabarcoding (59 species) in summer 2020. Similarly, Yi et al.40 examined the impact of
increased freshwater inflow on estuarine ecosystems during spring, with inflows rising to 3.1 and 4.3 billion m3. Their study found that the cumulative effect on fish communities increased
by 20% and 44%, respectively. Furthermore, introduced species can enhance diversity by successfully establishing population and increasing the overall species richness at both regional and
local levels41. In this study, the traditional method and eDNA metabarcoding identified 2 (_C. carpio_ var. _specularis_ and _M. amblycephala_) and 4 (_S. knerii_, _C. cuvieri_, _M.
salmoides_ and _H. tchangi_) more introduced fish species compared with the historical data1,20,21. While introduced species may contribute to greater species richness, and their total
relative abundance in BYD remains below 2%, their potential ecological impacts should not be overlooked. Ji et al.42 showed that the introduction and establishment of _Hypophthalmichthys
nobilis_ from the Yangtze Basin heightened the likelihood of interspecific competition among fish species, and had undesirable effects on the growth of other fish in Ulungur Lake, China. In
addition, Haupt et al.43 and Wang et al.44 also documented that the introduction and rapid population expansion of _Hypophthalmichthys molitrix_ and _H. nobilis_ posed a serious threat to
native planktivorous fish in the Mississippi River basin, USA. Thus, our findings indicate that the water quality improved and the species richness increased but the potential ecological
problems of the introduced species should be of concern after EWR in the BYD ecosystem. THE LINK BETWEEN WATER QUALITY AND THE DISTRIBUTION OF FISH Finding out the key water quality
variables affecting the fish communities are of great significance for the conservation of fish diversity. In this study, TN, DP and CODMn were the primary factors driving the distribution
patterns of fish assemblages in the spring (Fig. 6D), whereas TN, NH3–N and DP in the summer (Fig. 6E). Interestingly, these key driving factors in the spring and summer were significantly
varied at spatial scales (Table S2). In the same period, although the fish are in different habitats from mosaic habitat ecosystems, the same fish in each habitat are in a unified life
history stage, and the water quality requirements for them are similar45. Additionally, the community composition and growth of food resources in different habitats from mosaic habitats were
similar for the same period, in which the distinct difference of water quality factors may be the key to drive community46. Thus, our study further shows that the water quality factors
driving the changes of fish communities in complex habitats of BYD ecosystem during the same period varied significantly across different habitats. On a temporal scale, nutrients (TN, CODCr,
and CODMn), WT, DP, and pH were the primary variables driving the distributions of fish assemblages across the seasons in this study (Fig. 6F), in which the TN, CODCr, and WT, and pH across
the seasons were distinctly varied while not in CODMn and DP. An increase in nutrient availability in environment supports primary and secondary production, including an increase in fish
abundance, but high concentrations of nutrients could improve the abundance of pollution-tolerant species and limit facultative species15,47. _C. auratus_, a pollution-tolerant species, was
the most dominant species (making up over 70%) in BYD ecosystem and was obviously associated with nutrients11. Thus, the concentration difference in nutrients between the two seasons could
remarkedly affect the fish community distribution, with _C. auratus_ as the absolute dominant species. Furthermore, the reproduction and recruitment of fish were directly affected by WT due
to physiological tolerances and temperature preferences32. Most Cyprinidae (e.g., _C. auratus_ and _C. carpio_) start spawning at approximately 18 °C; in particular, _C. auratus_ spawns at
18 °C (spring) and then enters the rapid growth period48. Lacroix et al.49 demonstrated that pH can affect the egg, fry, parr, and smolt stages of fish, and the abundance distribution of
cyprinids is most likely to the pH level in Halfway Brook. Similarly, Wang et al.29 established the relationship between fish communities detected by traditional method and water quality
variables (altitude, DO, WT, SD, DP, pH and turbidity), and indicated that WT, DP and pH were the key factors driving the distributions of the fish community across the seasons. Accordingly,
Hu et al.50 investigated fish diversity and established the relationship between fish diversity and water quality changes in the Huixian Wetland across seasons and demonstrated that WT, pH,
and nutrients were the main driving factors for the distribution of fish communities, with _C. auratus_ as the dominant species. Thus, our results demonstrate that the water quality
variables driving the changes of fish communities during the same period varied significantly across different habitats, while not all showed noticeable discrepancy in driving cross-seasonal
fish community changes. EDNA METABARCODING DISCRIMINATE THE SPATIOTEMPORAL HETEROGENEITY OF FISH COMMUNITIES IN ECOSYSTEMS WITH DISTRIBUTION OF DIFFERENT HABITATS IN INTERLACE Our results
demonstrated that eDNA metabarcoding and the traditional method provided similar patterns, in which Cypriniformes, Perciformes and Siluriformes were the dominant compositions across the two
methods. Accordingly, the number of overlapping species in the spring, summer, and two seasons combined was 19, 17, and 23, accounting for 65.52%, 54.84% and 57.5% of the total species
identified by the traditional method, respectively, and demonstrating good consistency in species detection across seasons. Moreover, the relative abundance of the overlapping species using
eDNA metabarcoding was high, making up 84.89% in spring and 87.87% in summer. Compared with the traditional method, the additional species detected by eDNA metabarcoding were primarily
low-abundance species, including _S. knerii_, _C. cuvieri_, _S. wolterstorffi_, _M. salmoides_, and others. Milhau et al.51 also demonstrated that most of the species detected by the
traditional method in the Tier River were also identified by eDNA metabarcoding, and that the relative abundance of fish species detected exclusively by eDNA metabarcoding was generally low
in the Rhône River basin, France. Thus, our findings further indicated that eDNA metabarcoding is a promising tool for monitoring fish diversity by effectively detecting low-abundance
species and promoting more realistic census of the fish community. It is widely acknowledged that comprehensive diversity evaluations should encompass both temporal and spatial scales to
enhance our understanding of the distribution patterns of fish communities52. In our study, the number of species detected by eDNA metabarcoding revealed a highly significant variation
across the four habitats for the two seasons (Kruskal–Wallis analysis: spring: x2 = 20.266, _P_ = 0.000; summer: x2 = 15.361, _P_ = 0.002) and the cumulative number of detected species was
greater in the T and R habitats compared to the L and S habitats (Fig. 4C). Furthermore, spatially consistent patterns in the number of species richness and abundance were observed across
two seasons (Fig. 4C and D). Fish community characteristics could respond to differences in habitat structure at a spatial scale53. T habitat with luxuriant emerge macrophytes, especially
for _Phragmites australis_, and abundant feeding resources in BYD ecosystem, which not only fulfill the nutritional requirements of fish but also provide protective shelter for smaller fish
against predation54. Accordingly, the R habitat connected the L, T and S habitats, which made it more complex due to mixing flows19. Although abundant food resources and slow flow rates in
the R habitat are good for attracting fish species, especially for fish depending on flows to spawn (e.g., _Silurus asotus_ and _S. knerii_), navigation and boating could pose negative
effects on fish diversity, especially for larvae or small fish55. In comparison, the deep depth and infrequent emergence of macrophytes in the L habitat and food and cover against predators
are not available for many fish species, especially small fish19,54. Furthermore, all sites of the S habitat except for S8 were in the northwest, in which submerged plants grew luxuriously
and even decayed, and the quinolone concentration and pollutant level were worse than those in other areas1. Therefore, the fish community characteristics responded well to the difference in
habitat structure among the four habitats in the present study. Furthermore, the NMDS analysis showed that the fish communities identified in spring differed among the four habitats
(PERMANOVA, F = 1.859, _P_ = 0.017, Fig. 6A) and significantly varied in summer (PERMANOVA, F _=_ 3.293, _P_ = 0.001, Fig. 6B). Romare et al.53 reported that fish communities differed among
different parts of Hanebjerg Lake, Denmark, and edge zones with dense emergent vegetation attracted fish, especially small fish. Diekmann et al.56 also found that the standardized catches
and diversity of the fish community varied in response to habitat differences. Habitats with abundant food resources and adequate cover exhibited the most consistent catches and supported
the highest diversity of fish species56. Furthermore, obvious discrimination of fish communities across two seasons was observed (PERMANOVA, F = 288.099, _P_ = 0.001, Fig. 6C). Similarly,
Wang et al.29 investigated the fish community structures using the traditional method in the BYD ecosystem and indicated that the fish communities changed significantly across seasons.
Therefore, our findings demonstrate that the fish communities differed significantly across multiple habitats and seasons, and responded well to different habitat features in BYD ecosystem.
Our study further validated the effectiveness of eDNA metabarcoding to distinguish spatiotemporal heterogeneity of fish communities in multiple habitat ecosystems with distribution of
different habitats in interlace. However, previous researches validated the sensitivity of eDNA metabarcoding in habitat heterogeneity of fish assemblages in aquatic ecosystems with the
habitats are relatively independent and often located adjacent16,17,57. For example, Oka et al.16 showed that eDNA metabarcoding successfully discriminated the fish assemblages in the
offshore reef edge from those in the nearshore seagrass beds within the coral reef lagoon of Bise, located on Okinawa Island in southern Japan. In addition, Cilleros et al.57. further showed
that eDNA metabarcoding was capable of effectively differentiating fish assemblages at stream and river locations in French Guiana. Overall, this study suggested the fish communities
differed significantly across multiple habitats and seasons in BYD ecosystem, and eDNA metabarcoding is useful for detecting spatiotemporal heterogeneity of fish assemblage in ecosystems
with distribution of different habitats in interlace. CONCLUSIONS The changes in the content of water quality variables and species richness of fish were evaluated and analyzed after EWR in
the BYD ecosystem. Additionally, the spatiotemporal dynamics of fish assemblages and interactive networks between communities and water quality variables were analyzed using eDNA
metabarcoding. Our results highlighted that the water quality improved and the species richness increased but the potential ecological problems of the introduced species should be of concern
after EWR in the BYD ecosystem. In addition, this study further shows that the water quality factors driving the changes of fish communities in complex habitats during the same period focus
on the variables with significant differences across different habitats, while which not all for the cross-season fish community for the differences in water quality requirements for fish
across seasons. Furthermore, our finding suggested eDNA metabarcoding can be utilized to assess temporal-spatial dynamics of the fish assemblages in mosaic habitat ecosystems and
discriminate the spatiotemporal heterogeneity of fish communities. In addition, to effectively restore and conserve native fish resources, long-term monitoring of fish communities and water
quality factors following continuous EWR is strongly recommended. DATA AVAILABILITY Raw sequence reads are deposited in the NCBI Sequence Read Archive database BioProject ID: PRJNA565582
(https://www.ncbi.nlm.nih.gov/sra/PRJNA734376). The accession number of samples ranged from SAMN21400475 to SAMN21401107. ABBREVIATIONS * EWR: Ecological water replenishment * eDNA:
Environmental DNA * BYD: Baiyangdian * OTUs: Operational taxonomic units * NT: Nucleotide sequence database * NMDS: Nonmetric multidimensional scaling * WT: Water temperature * DO: Dissolved
oxygen * SD: Transparency * DP: Depth * TN: Total nitrogen * TP: Total phosphorus * CODcr : Chemical oxygen demand * NH3–N: Ammonia nitrogen * CODMn : Potassium permanganate index * CAU:
_Carassius auratus_ * TSW: _Toxabramis swinhonis_ * CCO: _Culter ompressocorpus_ * PIN: _Pseudorasbora interrupta_ * CID: _Ctenopharyngodon Idella_ * CSP: _Carassius_ sp. * HMO:
_Hypophthalmichthys molitrix_ * CAR: _Channa argus_ * HTC: _Hemiculter tchangi_ * HBL: _Hemiculter bleekeri_ * PDA: _Paramisgurnus dabryanus_ * SSO: _Silurus soldatovi_ * CCA: _Cyprinus
carpio_ * TFU: _Tachysurus fulvidraco_ * XSP: _Xenocypris_ sp. * MSA: _Micropterus salmoides_ * CGI: _Carassius gibelio_ * COS: _Cobitidae_ sp. * SKN: _Siniperca knerii_ * HNO:
_Hypophthalmichthys nobilis_ * RBR: _Rhinogobius brunneus_ * ASP: _Acheilognathus_ sp. * CER: _Culter erythropterus_ * RSP: _Rhinogobius_ sp. * AKI: _Aphyocypris kikuchii_ * OSI: _Oryzias
sinensis_ * CLA: _Carassius langsdorfii_ * CAC: _Carassioides acuminatus_ * MOC: _Macropodus ocellatus_ * CAL: _Culter alburnus_ * PEL: _Pseudorasbora elongate_ * PSI: _Pseudobrama simoni_ *
MAL: _Monopterus albus_ * ACH: _Acheilognathus chankaensis_ * CCU: _Carassius cuvieri_ * MSP: _Misgurnus_ sp. * RSI: _Rhinogobius similis_ * APH: _Aphyocypris chinensis_ * SAS: _Silurus
asotus_ * MAS: _Macropodus_ sp. * SSP: _Silurus_ sp. * CMA: _Channa maculate_ * CIL: _Culter ilishaeformis_ * MPI: _Mylopharyngodon piceus_ * HEI: _Hemiculter eigenmanni_ * RCL: _Rhinogobius
cliffordpopei_ * TDA: _Triplophysa dalaica_ * ARI: _Abbottina rivularis_ * SAR: _Squalidus argentatus_ * LCO: _Lefua costata_ * ABR: _Abramis brama_ * MBI: _Misgurnus bipartitus_ * SWO:
_Squalidus wolterstorffi_ * BTO: _Barbatula toni_ * CYS: _Cyprinus_ sp. REFERENCES * Zhang, S. et al. Assessment of fish communities using environmental DNA: Effect of Spatial sampling
design in Lentic systems of different sizes. _Mol. Ecol. Resour._ 20, 242–255 (2020). Article CAS PubMed Google Scholar * Su, G. H. et al. Human impacts on global freshwater fish
biodiversity. _Science_ 371, 835–838 (2021). Article ADS CAS PubMed Google Scholar * Arthington, A. H., Dulvy, N. K., Gladstone, W. & Winfield, I. J. Fish conservation in freshwater
and marine realms: Status, threats and management. _Aquat. Conserv._ 26, 38–57 (2016). Article Google Scholar * Li, J. H. et al. Fish biodiversity conservation and restoration, Yangtze
river basin, China, urgently needs ‘scientific’ and ‘ecological’ action. _Water_ 12, 3043 (2020). Article Google Scholar * Huang, Y., Chen, P., Li, J. & Yang, X. Research on variation
of water quality before and after ecological water supplementation in the Beijing section of the Yongding river. _Sens. Mater._ 35, 553–561 (2023). Google Scholar * Ren, J., Han, G., Liu,
X., Liu, J. & Gao, X. Water chemical characteristics and water quality evaluation of the river under the ecological water replenishment: A case study in the Yongding river basin in North
China. _ACS Earth Space Chem._ 7, 1505–1515 (2023). Article ADS CAS Google Scholar * Yu, H. et al. Effects of water replenishment on lake water quality and trophic status: An 11-year
study in cold and arid regions. _Ecotoxicol. Environ. Safe_ 281, 116621 (2024). Article CAS Google Scholar * Weng, X. et al. An ecologically dispatch strategy using environmental flows
for a cascade multi-sluice system: A case study of the Yongjiang river basin, China. _Ecol. Indic._ 121, 107053 (2021). Article Google Scholar * Qiu, L. H., Ji, F. F. & Qiu, Y. H.
Changes in fish community structure in the old channel of Tianezhou in the Yangtze river from 2017 to 2021, genetic analysis and enlightenment for ex situ conservation of the Yangtze finless
porpoise. _J. Lake Sci._ 35, 950–960 (2023). (in Chinese). Google Scholar * Reinfelds, I., Lincoln-Smith, M., Haeusler, T., Ryan, D. & Growns, I. Hydraulic assessment of environmental
flow regimes to facilitate fish passage through natural riffles: Shoalhaven river below Tallowa dam, new South Wales, Australia. _River Res. Appl._ 26, 589–604 (2010). Article Google
Scholar * Xie, R. L. et al. eDNA metabarcoding revealed differential structures of aquatic communities in a dynamic freshwater ecosystem shaped by habitat heterogeneity. _Environ. Res._
201, 111602 (2021). Article CAS PubMed Google Scholar * Cao, Y. P., Wang, W. & Zhang, Y. B. Present situation of fish stocks in Baiyangdian lake. _Chin. J. Zool._ 3, 65–69 (2003).
(in Chinese). Google Scholar * Shaw, J. L. A. et al. Comparison of environmental DNA metabarcoding and conventional fish survey methods in a river system. _Biol. Conserv._ 197, 131–138
(2016). Article Google Scholar * Zou, K. et al. eDNA metabarcoding as a promising conservation tool for monitoring fish diversity in a coastal wetland of the Pearl river estuary compared
to bottom trawling. _Sci. Total Environ._ 702, 134704 (2020). Article CAS PubMed Google Scholar * Blabolil, P. et al. Environmental DNA metabarcoding uncovers environmental correlates of
fish communities in spatially heterogeneous freshwater habitats. _Ecol. Indic._ 126, 107698 (2021). Article CAS Google Scholar * Oka, S. I. et al. Environmental DNA metabarcoding for
biodiversity monitoring of a highly diverse tropical fish community in a coral reef lagoon: Estimation of species richness and detection of habitat segregation. _Environ. DNA_ 3, 55–69
(2021). Article CAS Google Scholar * Nguyen, B. N. et al. Environmental DNA survey captures patterns of fish and invertebrate diversity across a tropical seascape. _Sci. Rep.-U. K._ 10,
1–14 (2020). Google Scholar * Dai, Y. Y., Wang, S. Q., Zhu, H. P. & Xu, Y. R. Analysis on the potential of EWR for Baiyangdian Lake by reservoirs in the mountainous area of Daqing
River. In E3S Web of Conferences. _EDP Sciences_ 276, 01013 (2021). * Yang, W., Yan, J., Wang, Y., Zhang, B. T., Wang, H. & Seasonal variation of aquatic macrophytes and its relationship
with environmental factors in Baiyangdian lake, China. _Sci. Total Environ._ 708, 135112 (2020). Article CAS PubMed Google Scholar * Zheng, B. S., Fan, Q. D. & Dai, D. Y. _Fish in
the Baiyangdian Lake_, 4–58 (Hebei People’s Publishing House, 1960). * Xie, S. & He, H. D. Present condition analysis of Hebei Baiyangdian lake fish stocks after diversion from yellow
river to the lake. _Sci. Technol. Inf._ 23, 433–436 (2010). Google Scholar * HJ 710. _7–2014; Technical Guidelines for Biodiversity Monitoring—Inland Water Fish. Ministry of Ecology and
Environment of the People’s Republic of China_ (Beijing, China, 2015). * Galacatos, K., Barriga-Salazar, R. & Stewart, D. J. Seasonal and habitat influences on fish communities within
the lower Yasuni river basin of the Ecuadorian Amazon. _Environ. Biol. Fish._ 71, 33–51 (2004). Article Google Scholar * Wang, S. A. et al. _Hebei Animal Fauna: Fish. 1-366_ (Hebei Science
& Technology, 2001). * Evans, N. T. et al. Quantification of mesocosm fish and amphibian species diversity via environmental DNA metabarcoding. _Mol. Ecol. Resour._ 16, 29–41 (2016).
Article CAS PubMed Google Scholar * Magoč, T. & Salzberg, S. L. FLASH: Fast length adjustment of short reads to improve genome assemblies. _Bioinformatics_ 27, 2957–2963 (2011).
Article PubMed PubMed Central Google Scholar * Fan, J. T. et al. Modeling the ecological status response of rivers to multiple stressors using machine learning: A comparison of
environmental DNA metabarcoding and morphological data. _Water Res._ 183, 116004 (2020). Article CAS PubMed Google Scholar * Edgar, R. C. et al. UPARSE: Highly accurate OTU sequences
from microbial amplicon reads. _Nat. Methods_ 10, 996–998 (2013). Article CAS PubMed Google Scholar * Wang, Y. et al. Spatial variation in macrobenthic assemblages and their relationship
with environmental factors in the upstream and midstream regions of the Heihe river basin, China. _Environ. Monit. Assess._ 193, 1–22 (2021). Article Google Scholar * Rao, Q. H., Qiu, Y.
& Li, J. B. Water quality assessment and variation trends analysis of the min river sea-entry section, China. _Water Air Soil. Poll._ 230, 1–11 (2019). Article CAS Google Scholar *
Ji, F. F. et al. Estimating aquatic plant diversity and distribution in rivers from Jingjinji region, China, using environmental DNA metabarcoding and a traditional survey method. _Environ.
Res._ 199, 111348 (2021). Article CAS PubMed Google Scholar * Selleslagh, J. & Amara, R. Inter-season and interannual variations in fish and macrocrustacean community structure on an
Eastern english channel sandy beach: Influence of environmental factors. _Estuar. Coast. Shelf Sci._ 77, 721–730 (2008). Article ADS Google Scholar * Wang, X. et al. Comparison of
environmental DNA metabarcoding and a traditional survey method for assessing fish diversity and distribution along salinity gradient in an urban brackish reservoir, China. _Biology_ 13, 930
(2024). Article CAS PubMed PubMed Central Google Scholar * Ji, F. F. et al. Assessment of benthic invertebrate diversity and river ecological status along an urbanized gradient using
environmental DNA metabarcoding and a traditional survey method. _Sci. Total Environ._ 806, 150587 (2022). Article CAS PubMed Google Scholar * Gibson, J. et al. Simultaneous assessment
of the Macrobiome and Microbiome in a bulk sample of tropical arthropods through DNA meta systematics. _Proc. Natl. Acad. Sci._ 111, 8007–8012 (2014). Article ADS CAS PubMed PubMed
Central Google Scholar * Kembel, S. W. et al. Picante: R tools for integrating phylogenies and ecology. _Bioinformatics_ 26, 1463–1464 (2010). Article CAS PubMed Google Scholar *
Whitney, D. R. & Mann, H. B. On a test of whether one of two random variables is stochastically larger than the other. _Ann. Math. Stat._ 18, 50–60 (1947). Article MathSciNet MATH
Google Scholar * Oksanen, J., Blanchet, F. G., Kindt, R., Legendre, P. & Minchin, P. R. Vegan: Community ecology package. R package version 2.0–2. _Lorenzo Cachón Rodríguez_ 48, 103–132
(2012). * Wang, Y. X. et al. Fish community structure and its relationship with environmental factors in Baiyangdian lake. _J. Shanghai Ocean. Univ_ 31, 1488–1501 (2022). Google Scholar *
Yi, Y. J., Liu, Q., Zhang, J. & Zhang, S. How do the variations of water and sediment fluxes into the estuary influence the ecosystem? _J. Hydrol._ 600, 126523 (2021). Article Google
Scholar * Sax, D. F. & Gaines, S. D. Species diversity: From global decreases to local increases. _Trends Ecol. Evol._ 18, 561–566 (2003). Article Google Scholar * Ji, F. F., Ma, X.
F., Qiu, L. H., Kang, Z. P. & Shen, J. Z. Quantifying the effects of introduced Bighead carp (Cyprinidae; _Aristichthys nobilis_) stocking on dominant fish species in the Ulungur lake,
China. _Biol. Invasions_ 24, 1253–1265 (2022). Article Google Scholar * Haupt, K. J. & Phelps, Q. E. Mesohabitat associations in the Mississippi river basin: A long-term study on the
catch rates and physical habitat associations of juvenile silver carp and two native planktivores. _Aquat. Invasions_ 11, 93–99 (2016). Article Google Scholar * Wang, J. Z., Chapman, D.,
Xu, J., Wang, Y. & Gu, B. H. Isotope niche dimension and trophic overlap between bigheaded carps and native filter-feeding fish in the lower Missouri river, USA. _PLoS One_ 13, e0197584
(2018). Article PubMed PubMed Central Google Scholar * Mims, M. C. & Olden, J. D. Fish assemblages respond to altered flow regimes via ecological filtering of life history
strategies. _Freshw. Biol._ 58, 50–62 (2013). Article Google Scholar * Zheng, Y. Y. et al. Effects of resource availability and hydrological regime on autochthonous and allochthonous
carbon in the food web of a large cross-border river (China). _Sci. Total Environ._ 612, 501–512 (2018). Article ADS CAS PubMed Google Scholar * Chambers, P. A. et al. Northern rivers
ecosystem initiative: Nutrients and dissolved oxygen–issues and impacts. _Environ. Monit. Assess._ 113, 117–141 (2006). Article CAS PubMed Google Scholar * Yu, H. _X. Fish Culture
(Carassius Auratus Gibelio, Carassius cuvieri,·Red Carassius Auratus)_ (Shanghai Science & Technical, 1989). * Lacroix, G. L. et al. Fish community structure in relation to acidity in
three Nova Scotia rivers. _Can. J. Zool._ 65, 2908–2915 (1987). Article Google Scholar * Hu, Y. X. et al. Fish assemblage in different types of irrigation ditches in Huixian wetland.
_Guangxi Province J. Hydroecol._ 36, 15–21 (2015). (in Chinese). CAS Google Scholar * Milhau, T. et al. Seasonal dynamics of riverine fish communities using eDNA. _J. Fish. Biol._ 98,
387–398 (2019). Article PubMed Google Scholar * Altermatt, F. et al. Uncovering the complete biodiversity structure in Spatial networks: The example of riverine systems. _Oikos_ 00, 1–12
(2020). Google Scholar * Romare, P., Berg, S., Lauridsen, T. & Jeppesen, E. Spatial and temporal distribution of fish and zooplankton in a shallow lake. _Freshw. Biol._ 48, 1353–1362
(2003). Article Google Scholar * Mehner, T., Diekmann, M., BräMick, U. & Lemcke, R. Composition of fish communities in German lakes as related to lake morphology, trophic State, shore
structure and human-use intensity. _Freshw. Biol._ 50, 70–85 (2010). Article Google Scholar * Wolter, C. & Arlinghaus, R. Navigation impacts on freshwater fish assemblages: The
ecological relevance of swimming performance. _Rev. Fish. Biol. Fisher._ 13, 63–89 (2003). Article Google Scholar * Diekmann, M., Brämick, U., Lemcke, R. & Mehner, T. Habitat-specific
fishing revealed distinct indicator species in German lowland lake fish communities. _J. Appl. Ecol._ 42, 901–909 (2005). Article Google Scholar * Cilleros, K. et al. Unlocking
biodiversity and conservation studies in high-diversity environments using environmental DNA (eDNA): A test with Guianese freshwater fishes. _Mol. Ecol. Resour._ 19, 27–46 (2019). Article
CAS PubMed Google Scholar Download references ACKNOWLEDGEMENTS This work was supported by the National Key Research and Development Project (2019YFC1803402) and National Natural Science
Foundation of China (21976202). We thank Dingyi Han, Xiangsheng Hong, and Xinyuan Shi for assisting in sample collection. AUTHOR INFORMATION AUTHORS AND AFFILIATIONS * Fisheries College,
Jimei University, Xiamen, 361021, China Fenfen Ji * National Engineering Research Center of Industrial Wastewater Detoxication and Resource Recovery Research Center for Eco-Environmental
Sciences, Chinese Academy of Sciences, Beijing, 100085, China Fenfen Ji, Saihong Yan & Jinmiao Zha * Engineering Research Center of Green development for Conventional Aquatic Biological
Industry in the Yangtze River Economic Belt, Ministry of Education, College of Fisheries, Huazhong Agricultural University, Wuhan, 430070, China Fenfen Ji & Jianzhong Shen * State Key
Laboratory on Environmental Aquatic Chemistry, Research Center for Eco- Environmental Sciences, Chinese Academy of Sciences, Beijing, 100085, China Wenqiang Zhang & Baoqing Shan *
University of Chinese Academy of Sciences, Beijing, 100049, China Wenqiang Zhang, Saihong Yan, Baoqing Shan & Jinmiao Zha Authors * Fenfen Ji View author publications You can also search
for this author inPubMed Google Scholar * Jianzhong Shen View author publications You can also search for this author inPubMed Google Scholar * Wenqiang Zhang View author publications You
can also search for this author inPubMed Google Scholar * Saihong Yan View author publications You can also search for this author inPubMed Google Scholar * Baoqing Shan View author
publications You can also search for this author inPubMed Google Scholar * Jinmiao Zha View author publications You can also search for this author inPubMed Google Scholar CONTRIBUTIONS
Fenfen Ji: study design, investigation, data analysis, formal analysis, methodology, visualization and writing - original draft. Jianzhong Shen: study design, resources and data analysis.
Wenqiang Zhang: investigation and bioinformatics data analysis. Saihong Yan: investigation and bioinformatics data analysis. Baoqing Shan: study design, project supervision, Project
administration and Validation. Jinmiao Zha: funding acquisition, study design, writing - review & editing and project supervision. All authors reviewed the manuscript. CORRESPONDING
AUTHOR Correspondence to Jinmiao Zha. ETHICS DECLARATIONS COMPETING INTERESTS The authors declare no competing interests. ETHICAL APPROVAL This study was conducted in strict accordance with
the laws governing animal experimentation in China. The protocols were approved by the the Ethics Committee for Animal Experiments of Jimei University and Research Center for
Eco-Environmental Sciences, Chinese Academy of Sciences. All efforts were made to minimize suffering. ADDITIONAL INFORMATION PUBLISHER’S NOTE Springer Nature remains neutral with regard to
jurisdictional claims in published maps and institutional affiliations. ELECTRONIC SUPPLEMENTARY MATERIAL Below is the link to the electronic supplementary material. SUPPLEMENTARY MATERIAL 1
RIGHTS AND PERMISSIONS OPEN ACCESS This article is licensed under a Creative Commons Attribution-NonCommercial-NoDerivatives 4.0 International License, which permits any non-commercial use,
sharing, distribution and reproduction in any medium or format, as long as you give appropriate credit to the original author(s) and the source, provide a link to the Creative Commons
licence, and indicate if you modified the licensed material. You do not have permission under this licence to share adapted material derived from this article or parts of it. The images or
other third party material in this article are included in the article’s Creative Commons licence, unless indicated otherwise in a credit line to the material. If material is not included in
the article’s Creative Commons licence and your intended use is not permitted by statutory regulation or exceeds the permitted use, you will need to obtain permission directly from the
copyright holder. To view a copy of this licence, visit http://creativecommons.org/licenses/by-nc-nd/4.0/. Reprints and permissions ABOUT THIS ARTICLE CITE THIS ARTICLE Ji, F., Shen, J.,
Zhang, W. _et al._ Discriminating spatiotemporal heterogeneity and environmental drivers of fish assemblages using environmental DNA metabarcoding in mosaic habitat ecosystems. _Sci Rep_ 15,
15705 (2025). https://doi.org/10.1038/s41598-025-99970-1 Download citation * Received: 21 January 2025 * Accepted: 24 April 2025 * Published: 05 May 2025 * DOI:
https://doi.org/10.1038/s41598-025-99970-1 SHARE THIS ARTICLE Anyone you share the following link with will be able to read this content: Get shareable link Sorry, a shareable link is not
currently available for this article. Copy to clipboard Provided by the Springer Nature SharedIt content-sharing initiative KEYWORDS * Fish diversity * Spatiotemporal variability *
Ecological water replenishment * Water quality