- Select a language for the TTS:
- UK English Female
- UK English Male
- US English Female
- US English Male
- Australian Female
- Australian Male
- Language selected: (auto detect) - EN
Play all audios:
Chromium contamination, particularly in industrial wastewater, poses significant environmental and health risks due to its toxicity, carcinogenicity, and persistence. Despite various
treatment methods, developing cost-effective and sustainable adsorbents remains challenging. This study addresses this gap by investigating the potential of activated carbon derived from
olive pomace for Cr(VI) removal from aqueous solutions. The activated carbon was synthesized via chemical activation with phosphoric acid (H2PO4) followed by calcination at 500 °C. The
structural and chemical properties of the adsorbent were characterized using FT-IR, HRTEM, SEM, XRD, and Raman spectroscopy. Additionally, density functional theory (DFT) calculations were
employed to optimize the activated carbon structure and gain molecular-level insights into its interactions with Cr(VI) species. The adsorption process was systematically evaluated through
batch experiments by optimizing key parameters such as pH, contact time, adsorbent dose, and initial Cr(VI) concentration. Response Surface Methodology (RSM) with a Box–Behnken design was
applied to identify the optimal conditions for Cr(VI) removal. The results demonstrated that adsorption capacity increased with Cr(VI) concentration, with a maximum removal efficiency of 96%
at pH 2, an adsorbent dose of 0.2 g, and a contact time of 2 h. Kinetic studies confirmed that the adsorption followed a pseudo-second-order model, suggesting chemisorption as the dominant
mechanism. The isothermal analysis showed that the Freundlich model best described the adsorption behavior, indicating multilayer adsorption on a heterogeneous surface. Thermodynamic
parameters confirmed the endothermic and spontaneous nature of the adsorption process.
Water pollution is a major global problem that requires planned and executed methods for effective solutions1,2. The increase in discharges of industrial wastewater containing heavy metals
into the environment results from the rapid intensification of industrialization, which can hinder the growth of algae and other aquatic life. This phenomenon is critical due to the high
concentrations of heavy metals, which are toxic and pose significant risks to human health and the environment3,4. Effluents from wood preservation, electroplating, dyeing, leather
production, cement manufacturing, photography, and particularly leather and textile tanning often contain chromium5,6. Moreover, rapid industrialization has led to excessive exploitation of
resources and unregulated disposal of industrial waste into the environment, contributing to the increasing severity of heavy metal pollution, which now poses a globally recognized
challenge. The extent of contamination varies widely across regions, with heavy metals characterized by their toxicity, non-biodegradability, persistence, and tendency to bioaccumulate in
natural environments7.
Chromium is a common pollutant whose oxidation state varies and which generally exists in the environment in trivalent Cr(III) and hexavalent Cr(VI) forms8,9. Hexavalent chromium is 300
times more toxic than Cr(III) and has carcinogenic, mutagenic, teratogenic, and toxic effects on living organisms5, even at very low concentrations. In addition, Cr(VI) is more soluble and
mobile in solution than Cr(III) and can therefore be easily transported in ecosystems and enter the human food chain10. It is, therefore, imperative to remove Cr(VI) from industrial
effluents before discharging them into water bodies11,12. Many inexpensive sorbents have recently been used to remove Cr(VI). Among these, activated carbon has received a great deal of
attention due to the availability of waste biomass and the cost-effectiveness of its production.
Despite recognizing the dangers associated with Cr(VI), its effective removal from industrial effluents and contaminated water remains a major challenge. Various methods have been studied
for removing metals from water, including chemical precipitation, ion exchange, microbiological treatment, coagulation, and membrane technology13. Unfortunately, most of these techniques are
expensive, require a lot of energy, and produce toxic by-products8,14. Therefore, adsorption has been considered a superior alternative technology for metal removal due to its high
efficiency, flexibility, simplicity, and cost-effectivenes15,16. The adsorption process requires an inexpensive and highly efficient adsorbent with a high capacity for removal and adsorption
under various conditions12. Many types of adsorbents have been used for heavy metal removal, including organic and inorganic adsorbents. Thus, selecting and applying an effective adsorbent
for Cr(VI) removal is crucial. The main technology is activated carbon adsorption because of its low energy cost, low maintenance costs, simplicity, and reliability.
Activated carbon is also a porous material with excellent properties, characterized by its porosity and specific surface area17. These properties are important for AC because of its
continued use in industry. To improve the physicochemical properties of activated carbon, it is crucial to develop efficient production methods. This results in excellent physical and
chemical properties, particularly high specific capacities. Activated carbons can be produced from a variety of lignocellulosic precursors, generally considered to be waste products. Various
biomass resources have been reported in the literature for making activated carbon, such as sugar cane bagasse18, chestnut oak shells19, date press cakes20, olive pomace21, tobacco
petioles22, and palm oil mill sludge23. The full utilization of waste is very important for the economy and simultaneously provides a solution to the problem of solid waste.
The novelty of this study lies in several key aspects. First, it introduces the synthesis of a highly effective adsorbent derived from olive pomace, providing a sustainable approach to
environmental remediation. Second, the research employs advanced techniques, including density functional theory (DFT) calculations, to optimize the structure of the activated carbon,
providing a molecular-level understanding of the interactions between the adsorbent and the adsorbate. Additionally, Response Surface Methodology, using the Box–Behnken design, is applied to
analyze and optimize the factors influencing Cr(VI) removal, enabling the identification of the most effective conditions for the adsorption process. The study also offers a comprehensive
analysis of the adsorption isotherms, kinetics, and thermodynamics, providing valuable insights into the underlying mechanisms that govern chromium removal. This integrated study combines
experimental and theoretical approaches to provide a holistic view of the Cr(VI) removal process.
Preparing the activated carbon (AC) adsorbent from olive pomace involves two main steps. The first step is the chemical activation of the olive pomace. In this process, 2.5 g of olive pomace
(OP) is impregnated with 100 ml of a 22% phosphoric acid (H3PO4) solution. The impregnation is carried out at 50 °C for 2 h under magnetic stirring. After filtration, the activated OP paste
is neutralized with 0.1 mol/L sodium hydroxide (NaOH) solution to remove excess H3PO4, and the material is then dried at 50 °C for 24 h. In the second step, the activated OP is subjected to
heat treatment in a programmable muffle furnace under an inert atmosphere. The temperature gradually increases from room temperature to 500 °C at a rate of 5 °C/min. Once 500 °C is reached,
the material is held at an isothermal stage for 60 min. The resulting carbon product is then stored in a desiccator until it is ready for use24.
The characteristics of the activated charcoal before and after the adsorption of Cr(VI) were analyzed using SEM, FT-IR, XRD, Raman spectroscopy, and density measurements. The surface
morphology of the samples was examined via scanning electron microscopy (SEM), on a JEOL-IT500HR, complemented by high-resolution transmission electron microscopy (HRTEM, Talos F200S, FEI,
Thermo, Czech Republic) equipped with an energy-dispersive X-ray spectroscopy detector. These techniques provided detailed images, revealing the material’s porosity and surface texture.
Fourier-transform infrared spectroscopy (FTIR, Perkin-Elmer 1720 spectrometer) was employed to identify functional groups in the range of 4000–400 cm−1, with 10 scans performed at a
resolution 1 cm−1. The crystallographic structure of the activated carbon was determined by X-ray diffraction (XRD) using a Burker D8 Advance system, operating at a scanning speed of 3°
min−1 over a 10°-80° range with Cu Kα radiation (40 kV, λ = 0.15418 nm). Raman spectroscopy (HORIBA LABRAM-HR Evolution) under green laser excitation (λ = 532 nm) was utilized to
characterize the graphitic nature of the samples. Additionally, the true density of the carbon was measured using an automatic pycnometer (Micromeritics AccuPyc II), which also provided data
on the volume and porosity of the samples.
To gain a deeper understanding of the interactions between activated carbon (AC) and the various chromium species (CrO42−, Cr2O72−, and HCrO4−), Density Functional Theory (DFT) calculations
were performed. These calculations provide insight into the geometric optimization of the molecules, allowing for the identification of potential coordination sites for adsorption on the
carbon surface. DFT optimization was conducted using the B3LYP/6-31G(d, p) method25 to obtain the energy-minimized conformations of both chromium species and the activated carbon structure.
After geometric optimization, vibrational frequency analysis was performed to ensure the structures correspond to local energy minima, confirming their stability. All these calculations were
performed using Gaussian 09 software26,27,28.
In this study, we utilized the 1.5-diphenylcarbazide molecular adsorption spectrophotometry method, widely regarded as the most reliable technique for determining chromium concentrations in
various matrices. In a strongly acidic medium, hexavalent chromium (Cr(VI)) reacts completely with DPC (C(NH)4O(C6H6)2) to form a strongly colored violet carbazone complex. The absorbance
was then measured at a wavelength of λ = 540 nm using a UV/visible spectrometer. The adsorption equilibrium of Cr(VI) on activated charcoal was evaluated by monitoring the removal percentage
over time at ambient temperature. A 0.1 g sample of activated charcoal was added to 250 mL of a Cr(VI) solution with an initial concentration of 5 mg/L. The mixture was stirred at 300 rpm,
and aliquots were taken every 10 min. Each sample was centrifuged at 6500 rpm for 10 min. The effect of contact time on Cr(VI) removal was studied for 10 to 360 min. The removal efficiency R
(%) and the adsorption capacity Qe (mg/g) were calculated using the following Eqs. (1) and (2):
where Ci and Ce are the initial and equilibrium concentrations of Cr(VI) in the liquid phase, respectively (mg/L), V is the solution volume (L) and m is the mass of dry adsorbent (g).
Experimental design methods are powerful tools for optimizing processes and improving outcomes. They are particularly useful for establishing statistical control, developing predictive
models, evaluating variable effects, and determining the optimum conditions for achieving target responses. In this study, the Box–Behnken design was employed to minimize the number of
experiments while uncovering potential correlations between the studied parameters: pH (A), adsorbent dose (B), and initial Cr(VI) concentration (C). These parameters were analyzed for their
impact on the adsorption efficiency of Cr(VI) by activated carbon. The response variable, percentage removal efficiency (Y) was modeled using a second-order polynomial equation (Eq. 3):
where Y is the predicted removal efficiency, Xi and Xj are the input variables affecting the response, n is the number of independent variables, β0 is a constant, and βi, βii and βij are the
regression coefficients representing the linear, quadratic, and interaction effects, respectively, and ε is the error term.
The accuracy and fit of the model were assessed using analysis of variance (ANOVA). The experimental data were analyzed with Design-Expert 12 software. A three-factor, three-level
Box–Behnken design matrix was used to explore the main effects and interactions of the process variables. The range and levels of the experimental variables are summarized in Table 1.
The proximate analysis allows the determination and evaluation of the properties of activated carbon (AC) derived from olive pomace biomass through chemical activation. The proximate
analysis of the activated carbon in percentages revealed a moisture content of 1.71%, a volatile matter content of 12.23%, ash content of 4.15%, and a fixed carbon of 87.8%, as shown in
Table 2. The two most important parameters used to describe the quality of activated carbon are fixed carbon and ash content29. An ideal activated carbon has a high percentage of fixed
carbon, a low percentage of ash, and a moderate volatile matter content30,31. This high carbon content indicates good carbonization, which is essential for high adsorption capacity and
confirms the specific surface area value of 1400 m2/g21,24. This BET value we found is considered very high compared to a study on the preparation of biochar from palm oil mill sludge
biochar pyrolyzed at low temperature23. Elemental analysis shows that the obtained activated carbon contains 88% carbon by weight (Table S1). This high carbon content is indicative of good
carbonization, which is essential for high adsorption capacity. The presence of 10.94% oxygen by weight is due to oxygenated functional groups on the surface of the activated carbon, which
can play a crucial role in the adsorption of metal ions through chemical interactions. The presence of 0.46% phosphorus likely comes from the activation agent used (H₃PO₄), contributing to
the formation of additional active sites. Finally, the sodium content of 1.7% could result from the precursors or reagents used and should be monitored as it may influence the adsorption
properties of the activated carbon. Altogether, these mineral compounds and chemical elements suggest that the activated carbon possesses various active sites and a good capacity to interact
with different chemical species, thus improving its efficiency as an adsorbent.
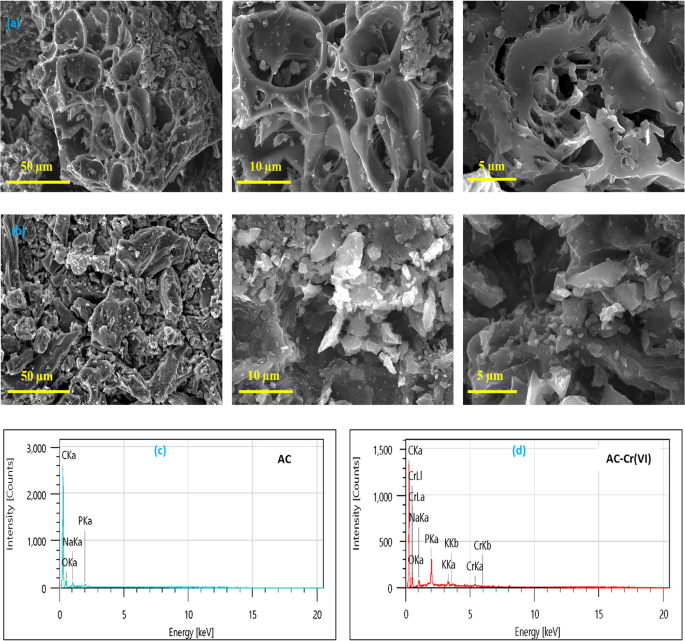
The pore structure details and morphological changes in the structure of activated carbon before and after adsorption were studied using SEM analysis (Fig. 1). Before adsorption, the
activated carbon displays visible rough surfaces in the images. The phosphoric acid (H3PO4) activation process is responsible for creating this roughness. This hypothesis was confirmed by
HRTEM analysis, TEM images confirm that the sample has an excellent pore structure derived from the accumulation of false carbon, indicating the presence of several pore sizes that can be
seen as transparent sites and clearly show the abundant micropores on the CA surface, as shown in Fig. S1. Porosity is a crucial textural quality for an adsorbent, as it provides a high
surface area that can be utilized during the adsorption process32,33. The overall morphology of the AC-Cr(VI) activated carbon after the adsorption of Cr(VI) has changed significantly,
demonstrating that chromium alters the original structure of the activated carbon during the adsorption process. Following the adsorption of metal ions by the adsorbent, the pores previously
observed on the surface of the adsorbent have closed due to the surface being covered by chromium, as confirmed in Fig. 1b. This is further corroborated by the EDS spectra of the activated
carbon before and after the adsorption of chromium ions, shown in Fig. 1c. The EDS spectra indicate the presence of elements such as carbon, oxygen, and phosphorus in the prepared adsorbent.
Moreover, the EDS analysis of AC-Cr(VI) reveals a peak corresponding to chromium species, with the amount of Cr ions present in the activated carbon being 1.19% by weight (Table S1). This
indicates that the adsorbent was effective in adsorbing Cr(VI) and confirms that the adsorption process occurred successfully. Additionally, phosphorus, which is favorable for
adsorption34,35, was also detected. Overall, these results confirm that the activated carbon derived from olive pomace is an effective adsorbent for chromium.
SEM images and EDX elemental percentages of (a,c) AC before adsorption, (b,d) AC-Cr(VI) after adsorption.
The functional groups of activated carbon from olive pomace waste were analyzed using FT-IR spectroscopy. The adsorption spectra of the two samples, before and after adsorption, are shown in
Fig. 2. The spectra reveal the shift of certain peaks and the appearance of others. The FT-IR spectrum of activated carbon before adsorption (AC) shows the following bands: a band around
1580 cm−1 attributed to the stretching vibration of lactone C=O and carbonyl groups conjugated to C=C bonds in aromatic rings. The band observed between 1100 and 1180 cm− 1 is generally
associated with oxidized carbons and has been attributed to the C–O stretching in acids or ester groups36. Bands between 1250 and 1300 cm−1 may be related to in-plane angular deformation of
C-H bonds in aromatic rings. After adsorption, the FT-IR analysis of AC-Cr(VI) shows changes in peak intensity and position, as well as the appearance of new peaks, which could be due to the
formation of a complex between the functional groups and chromium12,37. A more intense band appears in the 3200–3600 cm−1 region, corresponding to O–H stretching vibrations (hydroxyl group)
in alcohols, phenols, and carboxylic acids. The peak at 2900 cm−1 is attributed to asymmetric C–H stretching vibrations of methyl groups29. Peaks at 1615 and 1430 cm−1 represent medium C=C
and C=O stretching vibrations from the carbonyl group38. The intensity of the peak increases from 1000 to 1180 cm⁻¹, corresponding to C-O stretching vibrations39. Additionally, peaks in the
700–900 cm−1 range become more pronounced, which are attributed to out-of-plane C-H stretching vibrations in aromatic deformations. The binding of Cr ions to the active sites of activated
carbon could explain the increased intensity of the peaks in the FT-IR spectrum. Many characteristic peaks shifted or new ones appeared in the FT-IR spectrum of AC-Cr(VI) after adsorption,
indicating the functional groups where reactions occurred between the adsorbent and chromium. Similar results have been observed in previous studies with biochar derived from wheat straw,
pine bark, rapeseed stalks, and teff straw5,36.
FT-IR spectrum of activated carbon before AC (black) and after adsorption AC-Cr(VI) (violet).
XRD and Raman analyses determine the structural composition of AC and AC-Cr(VI) before and after adsorption. Figure 3.a presents the XRD patterns of the samples. The diffractogram of the
carbon before adsorption shows the presence of diffraction peaks (002) and (100)24. The broad (002) peak at 22–24° indicates small irregular domains of coherent and parallel stacking of
graphene sheets. The diffractograms show that AC exhibits typical characteristics of amorphous carbon. The X-ray diffraction after adsorption (AC-Cr(VI)) reveals a modification of the
structural integrity. The XRD data show the appearance of peaks at around 32° and 58° (2θ), corresponding to hexavalent chromium, as well as a broader peak of (212) at 18°. Therefore,
chromium ions appear to incorporate onto the surface of the activated carbon. Furthermore, the crystallinity of AC increased compared to its initial amorphous characteristics before
adsorption. The Raman spectrum of AC is shown in Fig. 3.b. The carbon before adsorption shows two obvious intrinsic peaks at around 1335 cm−1 and 1580 cm−1, corresponding to the D and G
bands respectively. For carbon after AC-Cr(VI) adsorption, the spectrum shows new peaks at 548 cm−1 and 896 cm−1 attributed to chromium.
X-ray diffraction spectra (a), Raman spectra of activated carbon before and after adsorption (b).
The optimized geometric structures of the chromium species and activated carbon, obtained through density functional theory (DFT) calculations, are shown in Fig. 4. These structures
represent the energy-minimized conformations, essential for understanding how these species interact in an aqueous environment. Geometric optimization helps predict the potential
coordination points between the chromium species and the active sites on the carbon, thereby determining the preferential sites for adsorption.
Optimized Geometries: (a) Chromium Species, (b, c) Activated Carbon.
The adsorption process involves a transfer of charge or electrons between the adsorbent and the adsorbate, where one species accepts and the other donates an electron or a charge. Generally,
the highest occupied molecular orbital (HOMO) and the lowest unoccupied molecular orbital (LUMO) indicate the regions of a molecule that can respectively donate or accept an electron26. As
observed in Fig. 5d, the HOMO of the AC is confined to the aromatic benzene rings. In contrast, the LUMO of AC is distributed across the entire surface of the carbon, including the benzene
rings, which confirms the adsorbent’s high electron-attracting capacity. The HOMO-LUMO energy gaps calculated for the various chromium species present in aqueous solutions (CrO42−, Cr2O72−,
and HCrO4−), as well as for the activated carbon, are crucial for understanding the electronic reactivity of these species and their ability to interact with activated carbon during the
adsorption process.
Activated carbon exhibits a relatively low energy gap of 0.867 eV, indicating high reactivity and a strong ability to accept or donate electrons, which is crucial for the adsorption of
chromium species. Among the chromium species, Cr2O72− has an energy gap of 4.762 eV, followed by CrO42− with 4.971 eV, and HCrO4−₄⁻ with 5.048 eV (Fig. 5a–c). These values suggest that
Cr2O72− is slightly more reactive than CrO42−, while HCrO4− is the most stable species. This relative reactivity indicates that Cr2O72− is likely the chromium species most easily adsorbed by
activated carbon due to its ability to electronically interact with the active sites on the carbon surface. Therefore, with its low energy gap, activated carbon plays a key role in
facilitating the adsorption of chromium species, contributing to the efficiency of the process for purifying water contaminated by hexavalent chromium.
Highest occupied molecular orbital HOMO, lowest unoccupied molecular orbital LUMO density and gap energy of, (a) HCrO4−, (b) of Cr2O72− (c) of CrO42−, and (d) of activated carbon AC.
In this study, we adopted the RSM-Box–Behnken method to statistically analyze the optimal levels of the selected significant variables concerning the removal of hexavalent chromium by
adsorption on activated carbon derived from olive pomace. A total of 15 optimization experiment series were determined for the three factors, as presented in Table S2. The R2 regression
coefficients were used to evaluate the fit of quadratic models with an R2 = 0.986 was the best fit for the experimental data. Thus, the Cr(VI) removal value was predicted using a quadratic
model. The mathematical expression of the relationship between the response (R%) and the variables A, B, and C is described by the following equation:
The Box–Behnken design model and the RSM were used to determine the optimal conditions to evaluate the effects of three important variables on the Cr(VI) adsorption process. The best way to
identify the relationship between the factors and the response is to examine the surface and contour plots based on two factors while keeping the third one constant. These plots help to find
more desirable optimal solutions with increased precision. The regression surfaces obtained were plotted based on the process variables to verify the real significance of the effects on
Cr(VI) adsorption capacity by activated carbon. The adequacy of the selected quadratic model was verified using a curve comparing the predicted values to the actual values, along with a
normal residual plot (Fig. S2). This made it possible to establish the relationship between experimental and predicted results and to assess the model’s ability to predict the efficiency of
hexavalent chromium removal by AC. The statistical validation of the model is confirmed by Fig. S2b, where actual and predicted values are close to each other. These results are also
confirmed by the ANOVA analysis presented in Table S3.
Figure 6a shows the 2D contour plots and 3D response surfaces illustrating the combined effect of pH and adsorbent dose on Cr(VI) adsorption, at a constant initial Cr(VI) concentration (5
mg/L) over 2 h of contact time and at room temperature. As the pH increases, from acidic to basic conditions, the chromium removal decreases. It is clear from this figure that the percentage
of Cr(VI) adsorption decreases as the pH increases from 2 to 5, and beyond a pH of 5, the removal percentage becomes very low. It is important to note that maximum adsorption, at all
concentrations, occurs at a pH of 2. It can be seen that the removal percentage increases significantly with an increase in adsorbent dose at a pH range of 2 to 5, which increases the number
of active sites responsible for adsorption40. This shows a significant effect of pH on Cr(VI) removal percentage relative to the adsorbent mass. Maximum chromium adsorption of 96% was
observed at pH = 2, with a carbon dose of 0.2 g and an initial Cr(VI) concentration of 5 mg/L.
Furthermore, Fig. 6b shows the interaction effect of pH and initial chromium concentration on removal efficiency (R%). The maximum Cr(VI) removal capacity was found at acidic pH, and the
removal rate decreased as the pH increased, as observed in several studies41,42. It was found that as the chromium concentration increases, the removal efficiency decreases. At lower Cr
concentrations, the ratio between solute concentration and adsorbent sites is more favorable, leading to increased Cr(VI) removal. In contrast, at higher concentrations, the saturation of
adsorption sites results in lower adsorption efficiency. Additionally, the removal percentage was higher at lower initial concentrations, clearly indicating that Cr adsorption from its
aqueous solution depends on its initial concentration, pH, and adsorbent dose.
The interaction effect of the adsorbent dose and the initial Cr(VI) concentration on Cr(VI) removal at pH = 5 is shown in Fig. 6c. As the initial concentration and the adsorbent dose
increase, the Cr(VI) removal efficiency rises to a certain point. However, it decreases when the initial concentration is further increased. The lowest Cr(VI) removal efficiency, 28.41%, was
observed with an adsorbent dose of 0.05 mg and an initial Cr(VI) concentration of 20 mg/L. This could be due to the limited availability of the adsorbent surface for Cr(VI) adsorption29,43.
Additionally, the available surface area might not be sufficient for the relatively higher concentration of Cr(VI) ions44. The maximum Cr(VI) removal efficiency was achieved with an
adsorbent dose of 0.2 mg and an initial chromium concentration of 5 mg/L. The highest Cr(VI) removal in the experiment was 65% at pH 5, whereas the removal efficiency under the same
conditions of chromium concentration and carbon dose at pH 2 was 96%. This highlights the importance of these parameters for effective chromium removal in aqueous environments.
Contour and response surface plots representing the combined effect of, (a) pH and adsorbent dose at a constant initial Cr(VI) concentration of 5 mg/l, (b) pH and initial Cr(VI)
concentration at adsorbent dose of 0.2 g, (c) adsorbent dose and initial Cr(VI) concentration at constant pH 2.
The optimization study of chromium removal response was conducted to determine the optimal adsorption conditions for achieving maximum removal percentage, using the Box–Behnken Design
method. This method is designed to identify a point that maximizes desirability and the optimal conditions of the adsorption process. After establishing the relationship between the
variables, the quadratic model equations were optimized. A desirability function was used to find the combination of process parameter levels that yield the maximum desired response for
Cr(VI) removal efficiency, as shown in Table S2. The maximum removal efficiency of 96% was achieved at a pH of 2, with a contact time of 2 h, an adsorbent dose of 0.2 g, and an initial
Cr(VI) concentration of 5 mg/L. The minimum removal efficiency of 7% was found at a pH of 8, with an adsorbent dose of 0.05 g and an initial Cr(VI) concentration of 20 mg/L.
Adsorption kinetics are defined by the evolution of the amount adsorbed as a function of the contact time between the adsorbent and adsorbate. Various adsorption kinetic models are used to
study the mechanisms of the hexavalent chromium adsorption process on activated carbon. Four kinetic models are frequently used to analyze experimental results: the pseudo-first-order model
(Eq. 5), the pseudo-second-order model (Eq. 6), the Elovich model (Eq. 7), and the intra-particle diffusion model (Eq. 8)12,34.
Figure 7a illustrates the trend of contact time and adsorption capacity for activated carbon AC. Cr(VI) adsorption increased rapidly within the first 45 min, then gradually slowed down, and
finally, the adsorption capacity remained almost constant. This behavior is mainly attributed to the large number of active sites on the surface of AC at the beginning of the adsorption
process. However, as the exposure time progressed, the active sites were gradually occupied, slowing down the chromium ion loading rate. Adsorption equilibrium was reached after 2 h of
contact time (Fig. S3). The graphical representation of the pseudo-first-order model for Cr(VI) is shown in Fig. 7b, and the corresponding parameter values are provided in Table 3. A
significant difference was observed between the experimental adsorption capacity and the calculated adsorption capacity. The correlation coefficient value R2 = 0.889 was less than unity.
Therefore, the pseudo-first-order model cannot accurately describe the adsorption process of Cr(VI) on activated carbon. Figure 7c also represents the pseudo-second-order model, and the
measured parameter values are shown in Table 3. The calculated adsorption capacity value (10.76 mg/g) and the experimental value (10.028 mg/g) are very close. Therefore, the adsorption
process was better fitted by the pseudo-second-order kinetic model, with a correlation coefficient of R2 = 0.993, compared to the pseudo-first-order kinetic model. These results suggest that
Cr(VI) adsorption onto the porous adsorbent is primarily governed by chemisorption through the sharing or exchange of electrons between the adsorbent and Cr(VI)45,46. The adsorption process
also fits well with the Elovich kinetic model (Fig. 7d), with R2 = 0.923, indicating that chemical adsorption, including ion exchange, occurred between Cr(VI) and activated carbon47.
Furthermore, to study the diffusion mechanism, the intra-particle diffusion model was applied to the experimental data. The qt = f(t1/2) line did not pass through the origin, indicating the
involvement of multilinear steps in the adsorption process (Fig. 7e; Table 3). This implies that Cr(VI) adsorption on the surfaces was controlled by both liquid film diffusion and
intra-particle diffusion21,48.
Effect of contact time (a), Pseudo-first-order kinetic model (b), pseudo-second-order kinetic model (c), Elovich kinetic model (d), and intra-particle diffusion model (e) respectively for
the adsorption of Cr(VI) on AC.
Three common isotherm models-Freundlich (Eq. 9), Langmuir (Eq. 10), and Temkin (Eq. 11), were employed to evaluate the adsorption behavior of Cr(VI) on activated carbon at equilibrium. The
mathematical expressions for these models are presented as follows:
To study the distribution of adsorbate molecules between the solid and liquid phases under equilibrium conditions and to understand the adsorption mechanism, the effect of the initial Cr(VI)
concentration on adsorption and the adsorption isotherms were investigated. Figure 8a shows the influence of the initial Cr(VI) concentration on adsorption capacity. It is observed that the
adsorption capacity increases with the rise in the initial Cr(VI) concentration. Specifically, the adsorption capacity increases from 5.86 mg/g to 68.659 mg/g, while the removal efficiency
decreases from 97 to 45%, as the Cr(VI) concentration increases from 5 to 200 mg/L. This trend is explained by the progressive saturation of the active sites on the activated carbon as the
Cr(VI) concentration increases, limiting additional adsorption capacity and leading to a reduction in removal efficiency. The increase in adsorption capacity results from the higher Cr(VI)
concentration, which generates enough driving force to overcome mass transfer resistance, thus leading to increased Cr(VI) adsorption49.
The parameters calculated with the correlation coefficients for the three isotherm models described are listed in Table 4, and the plots are shown in Fig. 8b–d. The adsorption of Cr(VI) was
well-fitted to both the Freundlich and Langmuir isotherms. However, based on the R2 values, the Freundlich isotherm model better describes the adsorption of Cr(VI) by AC, with a higher
correlation coefficient (R2 = 0.9847) than the Langmuir isotherm model. The Freundlich isotherm model is valid for multilayer adsorption and assumes a heterogeneous surface with interactions
between the adsorbed molecules and a non-uniform distribution of adsorption heat over the surface. The 1/nF value of the Freundlich isotherm model was less than 1, suggesting that Cr(VI)
adsorption on AC was favored by chemical adsorption50. The maximum adsorption capacity calculated by the Langmuir isotherm model is close to the experimentally determined maximum adsorption
capacity of 68.659 mg/g. Moreover, the dimensionless Langmuir separation factor (RL) was found to be within the range of 0


:max_bytes(150000):strip_icc():focal(721x104:723x106)/australian-sailor-and-his-dog-found-alive-after-2-months-stranded-out-at-sea-071823-7e04f9c8e48a4b22894e93ee7a018a2f.jpg)