- Select a language for the TTS:
- UK English Female
- UK English Male
- US English Female
- US English Male
- Australian Female
- Australian Male
- Language selected: (auto detect) - EN
Play all audios:
ABSTRACT China’s digital economy is currently thriving, with the “dual carbon” targets representing a significant pursuit of economic development. The role of the digital economy in
achieving these targets warrants detailed discussion. Using urban panel data from China spanning 2011 to 2021, this paper empirically examines the impact of the digital economy on urban
carbon emissions. The findings reveal several key points: Firstly, the digital economy significantly reduces urban carbon emissions and enhances efficiency, a conclusion that remains valid
after a series of robustness checks. Secondly, there is a notable structural effect, with different dimensions of the digital economy exhibiting varying impacts on urban emission reduction
and efficiency enhancement. Thirdly, green economic efficiency and green technological innovation are crucial mechanisms through which the digital economy facilitates urban carbon emission
reduction and efficiency improvement, operating through green development and innovation channels. Fourthly, industrial structure upgrading is a key nonlinear factor reducing the digital
economy’s impact on carbon reduction, while the digital economy’s effect on urban carbon efficiency shows a U-shaped pattern. Lastly, the impact of the digital economy on urban carbon
emissions displays significant heterogeneity across cities of different locations, tiers, and characteristics. SIMILAR CONTENT BEING VIEWED BY OTHERS MECHANISM AND SPATIAL SPILLOVER EFFECT
OF THE DIGITAL ECONOMY ON CARBON EMISSION EFFICIENCY IN CHINESE PROVINCES Article Open access 30 May 2025 TOWARDS A LOW-CARBON SOCIETY: SPATIAL DISTRIBUTION, CHARACTERISTICS AND IMPLICATIONS
OF DIGITAL ECONOMY AND CARBON EMISSIONS DECOUPLING Article Open access 31 October 2023 DIGITAL ECONOMY, TECHNOLOGICAL PROGRESS, AND CARBON EMISSIONS IN CHINESE PROVINCES Article Open access
03 October 2024 INTRODUCTION Currently, global warming poses economic, social, and environmental challenges worldwide, primarily due to greenhouse gases, especially carbon dioxide. The
World Meteorological Organization’s (WMO) “Global Climate Report 2023” states that 2023’s global average temperature was 1.4 °C above pre-industrial levels (1850–1900), marking it the
warmest year in 174 years. Meanwhile, the International Energy Agency’s (IEA) “CO2 Emissions in 2023” report shows a 1.1% increase in global CO2 emissions. To tackle warming, achieve
sustainable development, and demonstrate responsibility, China has proposed “dual carbon” targets: “carbon peaking” and “carbon neutrality,” aiming for a low-carbon, green economy, ensuring
growth quality, and contributing to global carbon reduction. In this context, China’s “dual carbon” commitment to humanity and carbon emission reduction strategies have become key research
topics. Concurrently, the IT revolution has propelled the digital economy’s vigorous growth. According to the “China Digital Economy Development Research Report (2023)” by the China Academy
of Information and Communications Technology (CAICT), China’s digital economy hit 50.2 trillion yuan in 2022, surpassing nominal GDP growth for 11 years. It now comprises 41.5% of GDP,
matching the secondary industry’s share, highlighting its key role in national economic development. Of particular note is the close and intricate relationship between the digital economy
and urban carbon emissions. On one hand, the digital economy contributes to reducing urban carbon emissions by enhancing energy efficiency, promoting advancements in low-carbon technologies,
and fostering green innovations1. On the other hand, it may indirectly lead to increased carbon emissions due to energy consumption in related industries such as data center operations and
e-commerce logistics2. Consequently, the impact of the digital economy on urban carbon emissions is multidimensional, nonlinear, and shaped by numerous factors. Given that cities are the
primary sources of global carbon emissions, it is particularly crucial to deeply explore the complex interplay between the digital economy and urban carbon emissions. Under the framework of
the “dual carbon” targets, investigating the impact of the digital economy on urban carbon emissions not only aids in enhancing our understanding of this domain but also provides new
insights and methodologies for carbon reduction and efficiency improvement, thereby promoting harmonious development among the digital economy, carbon reduction, and urban efficiency. This
research holds significant importance for guiding holistic urban management, optimizing carbon emission control strategies, formulating macro-policies, and addressing scientific issues.
LITERATURE REVIEW EXISTING RESEARCH ON THE DIGITAL ECONOMY AND CARBON EMISSIONS With the introduction of “dual carbon” goals and the thriving digital economy (DE), scholars have increasingly
focused on its energy-saving and emission-reduction effects. Huang3 asserts that achieving these goals necessitates a comprehensive systemic transformation involving various aspects, with
carbon-neutrality science and technology serving as the cornerstone. In the context of global climate change, carbon emissions (CE) have garnered significant attention, and DE has emerged as
a novel perspective for carbon reduction research. Recent studies have examined the relationship between DE and CE from various angles, yielding mixed results4. Xie et al. developed an
index system for digital economy (DE), revealing a relationship with urban carbon emissions (CE) that initially grows but later substantially reduces. Some studies suggest that DE
development facilitates CE reduction, especially in China and developing countries5,6,7. , with the emission reduction effect becoming more pronounced as DE matures. Spatial spillover
effects on CE reduction have also been observed, characterized by regional heterogeneity, such as more significant reduction in eastern China36. However, contrasting viewpoints argue that DE
exacerbates CE due to significant emissions from the Information and Communication Technologies (ICT) sector, which requires high carbon-emitting intermediate inputs, indirectly increasing
energy demand and hindering carbon reduction efforts2. MULTI-DIMENSIONAL INDEXES AND THEIR IMPACT ON CARBON EMISSIONS Several studies have constructed multi-dimensional indexes to assess the
digital economy’s impact on carbon emissions. Chang et al.8 created a four-dimensional index, revealing a significant reduction in regional carbon emission intensity, with industrial
structure upgrading as a key mechanism. Li et al.9 measured digital economy development through internet and digital finance, demonstrating its positive impact on regional carbon reduction,
highlighting green technological progress as a crucial factor. Wang10 established an index system encompassing digital industrialization and industrial digitization, finding that urban
carbon emissions first increase and then decrease, with green technological innovation and industrial structure upgrading as significant pathways. Zhang et al.11 created a digital economy
index covering digital industry, innovation, and application, showing a positive impact on urban carbon emission performance. Li et al.12 assessed urban digital finance development, finding
it significantly enhances urban industrial carbon emission efficiency, with green technological innovation as a critical threshold factor. Detailed analysis is provided on the structural
effects of various digital economy dimensions, aligning with the emphasis on smart city technology for emission management by He et al.13. LITERATURE DEFICIENCIES AND PAPER CONTRIBUTIONS
Existing literature has provided valuable insights into the relationship between the digital economy and carbon emissions, yet several deficiencies persist. Typically, studies focus solely
on emission reduction or efficiency enhancement, neglecting a comprehensive analysis that integrates both aspects. Furthermore, the influence of technical attributes on carbon emissions is
often overemphasized, while the perspective of green economic development is overlooked. The measurement of the digital economy is limited to two to three dimensions, lacking a holistic
assessment of its various impacts. Additionally, most research explores linear relationships, disregarding potential nonlinear interactions. This paper endeavors to address these
deficiencies and further explores the following aspects: Firstly, it focuses on the dual-carbon goals, examining the impact of the digital economy on urban carbon emissions from both carbon
reduction and efficiency perspectives. Secondly, it broadens the scope beyond green technology, exploring the mechanisms of the digital economy through green development and innovation, with
empirical tests demonstrating the role of green technological innovations in enhancing carbon reduction and efficiency. Thirdly, based on the definitions and research of the China Academy
of Information and Communications Technology (CAICT), a new index system is constructed to measure digital economy development across four dimensions, incorporating both economic and social
welfare into carbon emission assessments. Fourthly, by considering industrial structure upgrading as a threshold variable, this paper deepens the understanding of the nonlinear relationship
between the digital economy and carbon emissions from both reduction and efficiency angles. Lastly, a geographical and time-weighted regression (GTWR) analysis is conducted, with the carbon
emission coupling coordination degree (syeff) as the dependent variable and the digital economy (Dige) as the explanatory variable. THEORETICAL BASIS AND RESEARCH HYPOTHESES DIRECT IMPACT OF
THE DIGITAL ECONOMY ON URBAN CARBON EMISSIONS On one hand, the digital economy reduces urban carbon emissions by integrating with the urban economy, promoting industries like AI, machine
learning, and the metaverse, and shifting urban industries to high-tech, low-carbon sectors (Shi)14. Additionally, the development of the digital economy has spawned new models like the
sharing economy and platform economy (Pouri and Hilty)15, optimizing resource utilization efficiency, eliminating redundant capacity, and further reducing overall urban carbon emissions.
Secondly, the widespread adoption of the digital economy at the enterprise level has introduced digital production and operation methods, including smart manufacturing, remote office
operations, and supply chain optimization in logistics and transportation. These advancements have spurred innovative developments in production methods and business models, curbing energy
consumption and carbon emissions during traditional enterprise operations (Han et al.)16. Thirdly, the extensive application of the digital economy in residents’ lives has promoted the
popularization of new intelligent and digital lifestyles, including e-commerce, smart homes, and intelligent transportation (Ban and Zhang)17. This has effectively decreased energy
consumption in traditional retail and contributed to lowering carbon emissions in residents’ daily lives. Lastly, the extensive utilization of the digital economy in government
administration enables government departments to monitor and manage urban energy consumption and carbon emissions through digital city management systems (Zhang et al.)18. This facilitates
the implementation of policies and initiatives such as low-carbon transportation, energy-efficient buildings, and green production, further reducing urban carbon emissions. On the other
hand, the direct impact of the digital economy on urban carbon emissions is also manifested in terms of efficiency enhancement. Shen, Y. et al.19 insights underscore the potential of policy
strategies that leverage the digital economy and technological innovation to meet the “dual-control” policy objectives and foster sustainable development. Firstly, the rapid development of
the digital economy has fostered the emergence and growth of high-tech, green, low-carbon, and energy-saving technologies (Shao et al.)20. The application of these technologies across
various sectors of the economy has improved resource utilization efficiency, driven economic growth through innovation, and increased economic output per unit of carbon emission, effectively
enhancing the economic performance of carbon emissions. Secondly, while reducing urban carbon emissions, the digital economy has also promoted innovative development in the healthcare
sector, facilitated the popularization and optimization of educational resources, and created more job opportunities and positions. These advancements have effectively improved urban
healthcare, education, and income levels, enhancing the welfare performance of urban carbon emissions (Wang et al.)21. Based on the above, the following hypotheses are proposed: H1 The
digital economy has a mitigation effect on urban carbon emissions. H2 The digital economy has an efficiency enhancement effect on urban carbon emissions. INDIRECT IMPACT OF THE DIGITAL
ECONOMY ON URBAN CARBON EMISSIONS * (1) Green Development Effect. The digital economy, driven by data and technology, has become crucial for green development. Firstly, the digital economy
advances intelligent manufacturing like industrial internet, big data analytics, and AI, enhancing production efficiency and greenness(Lyu et al.)22. Secondly, digital tech in energy systems
boosts smart energy management, optimizing energy use and enhancing efficiency via real-time monitoring (Wang et al.)23. Lastly, digital economy drives online consumption patterns,
promoting low-input, low-energy, low-pollution services like logistics, enhancing green consumption (Ban and Zhang)17. Consequently, the development of the digital economy contributes to the
improvement of urban green economic efficiency from both the production and consumption ends, fostering the development of a green economy. Furthermore, the enhancement of urban green
economic efficiency has a direct and profound impact on urban carbon emission reduction and efficiency enhancement. Firstly, enhanced green economic efficiency leads to more efficient
resource use in production and consumption (Li et al.24, reducing waste and carbon emissions. For example, energy-efficient tech cuts firm energy use and emissions, while digital platforms
help residents reduce offline consumption emissions. Secondly, enhanced green economic efficiency maximizes resource utilization (Lin and Tan)25, leading to greater economic output per unit
of carbon emission, effectively improving the economic performance of carbon emissions. Lastly, the improvement in green economic efficiency fosters the development of numerous green
technologies and services, creating more job opportunities and related positions, generating social employment and income effects. Additionally, the enhancement of green economic efficiency
enables cities to achieve green economic development (Lou et al.)26, signifying improved environmental quality and reduced pollution, leading to positive social health effects. Therefore,
the improvement in green economic efficiency also has a positive impact on the social welfare performance of carbon emissions. Based on the above analysis, the following hypothesis is
proposed: H3 The digital economy can form a green development effect by enhancing urban green economic efficiency, thereby exerting a carbon emission efficiency enhancement effect on cities.
* (2) Green innovation effect. Minimizing carbon emissions and enhancing carbon efficiency both require a technological foundation, particularly green technological innovation supported by
green technologies. This innovation necessitates funding, resources, talent for R&D, and a large market for promotion and sales. The digital economy offers safeguards for this (Dian et
al.)27. Specifically, firstly, the digital economy offers abundant data resources and information technology support for green technological innovation (Chen et al.)28. Through big data
analysis and artificial intelligence, environmental issues and carbon emission sources can be more accurately identified, providing data support and scientific basis for the R&D and
application of green technologies. Furthermore, the digital economy facilitates the integration and innovation of green technologies, promoting cross-sectoral applications and development.
Secondly, the digital economy introduces new investment and financing models and platforms, such as digital inclusive finance and Ant Financial Services, providing more flexible and
diversified funding support for the R&D and application of green technologies (Xu et al.)29, lowering the financing threshold for green technological innovation. Thirdly, the digital
economy actively integrates with the education sector, cultivating a large number of digital talents for economic and social development, providing corresponding talent support for green
technological innovation (Huang et al.)30. Lastly, the development of the digital economy drives the growth of emerging industries and future industries, expanding the market space and
application scope of green technologies (Lou et al.)31. Concurrently, it promotes the integration and application of green technologies with traditional industries, advancing the
marketization and industrialization of green technologies. Furthermore, the enhancement of urban green technological innovation has a direct and profound impact on urban carbon emission
reduction and efficiency enhancement. Firstly, green technological innovation contributes to the low-carbon transformation of production and consumption processes. It enables the low-carbon
upgrading of production processes, machinery and equipment, consumption platforms, and consumption scenarios, promoting technological innovation, management optimization, and equipment
upgrades (Xu et al.)32, forming green supply chains, thereby reducing carbon emissions during production and consumption and achieving bi-directional carbon emission reduction at both the
source and the end. Secondly, green technological innovation can reduce production costs for enterprises. Traditional production methods often rely on high energy consumption and inputs,
whereas the introduction of green technologies enables enterprises to reduce energy consumption and resource inputs (Du et al.)33, thereby lowering production costs and improving the
economic performance of carbon emissions. Moreover, after adopting green technologies, enterprises can enhance their green production capabilities, produce environmentally friendly products
that meet market demands, improve market competitiveness, increase market share, and further elevate the economic performance of carbon emissions. Lastly, the application of green
technological innovation in various aspects of social production and life contributes to improving urban living quality, enhancing urban environments, and raising urban landscape quality,
thereby elevating residents’ happiness and satisfaction with their living and consumption, and improving the social welfare performance of urban carbon emissions (Tang et al.)34. Based on
the above analysis, this paper proposes the following hypothesis: H4 The digital economy can form a green innovation effect by enhancing urban green technological innovation, thereby
exerting a carbon emission efficiency enhancement effect on cities. NONLINEAR EFFECTS OF THE DIGITAL ECONOMY ON URBAN CARBON EMISSIONS Numerous studies have highlighted the pivotal role of
industrial structure upgrading in mediating the impact of the digital economy on carbon emissions (Yi et al.; Dong et al.)35,36. However, most studies have focused on the linear impact of
industrial structure upgrading on urban carbon emissions influenced by the digital economy, following the pathway of digital economy → industrial structure upgrading → carbon emissions.
Nevertheless, while industrial structure upgrading often entails the expansion of high-tech, emerging, and future industries, it can also encompass carbon-intensive sectors such as chip
production and electronics manufacturing within the electronic information industry, which may contribute to increased carbon emissions. Furthermore, during the process of industrial
restructuring, while traditional industries gradually decrease their output and new industries increase theirs, the continued operation of equipment and factories from traditional industries
can lead to an inertial effect on carbon emissions during the transition period (Wang et al.)37, thereby elevating overall carbon emissions. Additionally, the initial application of new
technologies resulting from industrial structure upgrading may not be fully optimized, resulting in low energy efficiency and subsequently higher carbon emissions (Li et al.)38. Based on the
above analysis, Hypothesis 5 is proposed: H5 The impact of the digital economy on urban carbon emissions exhibits a nonlinear threshold effect contingent upon the level of industrial
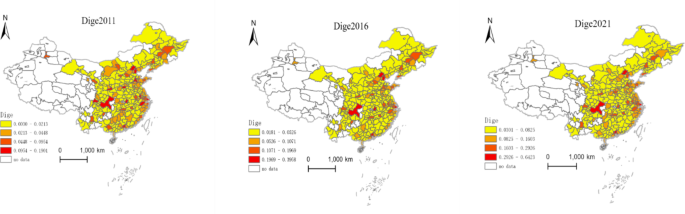
structure upgrading. CURRENT SITUATION ANALYSIS This study employs the Arc-GIS tool and applies the natural breaks classification method to create distribution maps of China’s digital
finance development level, carbon emission intensity, and carbon emission performance at the city level for the years 2011, 2016, and 2021, respectively. From Fig. 1, it can be observed that
in 2011, the development of the digital economy generally showed higher levels in the east and south compared to the west and north. The regions with high levels of digital economy
development are concentrated mainly in eastern coastal cities, while the central and western regions have relatively lower levels of digital finance development. In 2021, the overall pattern
of higher levels in the east and south and lower levels in the west and north persisted, but compared to 2011, the digital economy development level in the central and western regions has
seen marked improvements. Furthermore, examining the extreme values of digital economy development levels, in 2011, Guangzhou City in Guangdong Province had the highest level (0.19), while
Longnan City in Gansu Province had the lowest (0.003), with a difference of approximately 63 times between the two cities. In 2021, Shanghai became the city with the highest level of digital
economy development (0.64), while Guyuan City in Ningxia Hui Autonomous Region had the lowest (0.03), showing a difference of approximately 21 times. This indicates that over the years, the
digital economy development level in China’s cities has steadily improved, and the spatial disparity in digital economy development among cities is gradually narrowing. From Fig. 2, it is
observable in 2011 that the overall carbon emission intensity generally shows higher levels in the north and south compared to the central region. The regions with high carbon emission
intensity are concentrated mainly in the northern areas, while the central and southern regions have relatively lower carbon emission intensities. In 2021, the overall pattern of higher
levels in the north and south and lower levels in the central region persisted, but compared to 2011, the carbon emission intensity in the northern regions decreased, with the most
significant reductions seen in the Yangtze River Delta region and Yunnan-Guizhou areas. Additionally, examining the extreme values of carbon emission intensity, in 2011, Datong City in
Shanxi Province had the highest carbon emission intensity (2.46), while Ziyang City in Sichuan Province had the lowest (0.06), with a difference of approximately 41 times between the two
cities. In 2021, Qitaihe City in Heilongjiang Province became the city with the highest carbon emission intensity (2.36), while Bazhong City in Sichuan Province had the lowest (0.05),
showing a difference of approximately 47 times. This indicates that over the years, the carbon emission intensity in China’s cities has decreased significantly, but the spatial disparity in
carbon emission intensity among cities has gradually increased. From Fig. 3, we can observe that in 2011, the overall carbon emission performance generally showed higher levels in the south
compared to the north. The regions with high carbon emission performance are concentrated mainly in the southwest and southeast, while the northeast and northwest regions have relatively
lower carbon emission performance. In 2021, the overall pattern of higher levels in the south and lower levels in the north persisted, but compared to 2011, the carbon emission performance
in the southern regions further improved, with the most significant improvement seen in the Yangtze River Delta region. Furthermore, examining the extreme values of carbon emission
performance, in 2011, Ziyang City in Sichuan Province had the highest carbon emission performance (0.51), while Datong City in Shanxi Province had the lowest (0.002), with a difference of
approximately 255 times between the two cities. In 2021, Bazhong City in Sichuan Province became the city with the highest carbon emission performance (0.90), while Hulunbeier City in Inner
Mongolia Autonomous Region had the lowest (0.11), showing a difference of approximately 8 times. This indicates that over the years, the carbon emission performance in China’s cities has
significantly improved, and the spatial disparity in carbon emission performance among cities has gradually decreased. RESEARCH DESIGN MODEL SETTING This research utilizes panel data from
284 Chinese cities to investigate the influence of the digital economy on urban carbon emissions, grounded on theoretical analysis and hypotheses. This study used a two-way fixed effects
model as the benchmark regression framework for precise analysis, referencing Luan39, who applied the same model to examine the impact and processes of the digital economy on inter-city
carbon transfer. $$\:{Y}_{it}={\alpha\:}_{0}+{\alpha\:}_{1}{dige}_{it}+{{\alpha\:}_{3}Control}_{it}+{\delta\:}_{i}+{\mu\:}_{t}+{\epsilon\:}_{it}$$ (1) Where, \(\:{Y}_{it}\)represents the
explained variable, indicating the carbon emission intensity and carbon emission performance of city \(\:i\) in a given year \(\:t\); \(\:{dige}_{it}\) is the primary explanatory variable,
denoting the level of digital economy development in city \(\:i\) in year \(\:t\); \(\:{Control}_{it}\) are additional control variables influencing urban carbon emissions, encompassing
industrial structure (ind), financial development level (fin), social consumption level (cons), economic development level (pgdp), investment level (inv), and urban industrial scale (size).
The subscript \(\:i\) indicates the city, the subscript \(\:t\) signifies the year, \(\:{\alpha\:}_{0}\) is the constant term, \(\:{\delta\:}_{i}\) is the individual fixed effect,
\(\:{\mu\:}_{t}\) is the time fixed effect, and \(\:{\epsilon\:}_{it}\) is the random error term. CLARIFICATION OF VARIABLES * (1) Clarified Variables: This study examines two factors.
Carbon Intensity (CI) is defined as the ratio of urban carbon emissions to Gross Domestic Product (GDP). A diminished CI value signifies reduced city emissions and acts as an indicator of
urban carbon mitigation in this study.This work references the study by Wang et al.40 and utilizes data from the Emission Database for Global Atmospheric Research (EDGAR) to illustrate urban
carbon emissions, considering data availability, authority, and comprehensiveness. Secondly, Carbon Emission Performance (CEP). At present, researchers employ the Data Envelopment Analysis
(DEA) methodology, using energy, capital, and labor as inputs, GDP as the intended result, and CO2 as the undesirable outcome, to evaluate CEP from a neoclassical viewpoint. This strategy
prioritizes economic production over non-market societal benefit in the measuring of CEP. This article employs an ecological economics viewpoint, evaluating both economic and social
wellbeing, and quantifies CEP using GDP-to-CO2 and URDI-to-CO2 ratios (where URDI denotes Urban Residents’ Development Index). The formulae for measuring are as follows:
$$\:CEP=\frac{1}{2}CEE+\frac{1}{2}CSE$$ (2) In this context, CEP denotes urban carbon emission performance, with CEE (economic performance) quantified by the GDP-to-CO2 ratio and CSE (social
welfare performance) assessed by the URDI-to-CO2 ratio. This paper develops the URDI based on Wang et al.‘s41 framework, utilizing three equally weighted indicators: urban medical capacity
(quantified by hospital beds per 10,000 residents), educational attainment (quantified by college students per 10,000 individuals), and income level (quantified by per capita disposable
income). * (2) Core Explanatory Variable: Digital Economy Development Level (dige). At now, academics does not possess a standardized metric for the digital economy. The CAICT’s Digital
Economy Development Report (2022) defines it through four dimensions: digital industrialization, industrial digitization, data valorization, and digital governance. Considering data
availability and following Bai & Zhang42 and Zhao et al.43, this paper uses the entropy weight method to measure urban digital economy development across four dimensions: digital
industrialization, industrial digitization, digital infrastructure, and digital governance (Table 1). Data about industrial robots are obtained from the IFR. This study addresses
restrictions in provincial-level data regarding industrial robot installation density and e-commerce sales by employing city-to-province ratios of secondary and tertiary industry added
values as weights to create city-level statistics, following the methodology of Fan & Zhao44. Government policies with the digital economy illustrate its regulatory function. This
article employs the methodology of Xiao et al.45 by utilizing Python to analyze government work reports and quantify keywords relevant to the digital economy as a surrogate for urban digital
oversight. * (3) This research examines three key mechanism variables. Initially, Green Economic Efficiency (GEE) is assessed utilizing the Super-efficiency slacks-based measure (SBM)
model, based on the work of Lin & Tan25, with indicators specified in table 2. Secondly, the number of Green Technological Innovations (NGTI) is shown by the natural logarithm of green
innovation and utility model patents per 10,000 individuals, as per the study of Feng et al.46. Thirdly, the quality of Green Technological Innovations (QGTI) is evaluated using the natural
logarithm of green innovation patents per 10,000 individuals, as per Song et al.47. Green patent data is derived from the World Intellectual Property Organization’s (WIPO) international
patent classification (IPC) codes and is created with patent application and permission data from the National Intellectual Property Administration. * (4) Threshold Variable: Industrial
Structure Upgrade (ISU). ISU denotes the transition of the economy from lower-tier to higher-tier industrial structures. This change represents not just an economic shift but also a
transition towards more sustainable and efficient manufacturing processes. The selection of ISU as the threshold variable is based on its capacity to represent the transformation of
industrial structures, which is expected to significantly impact the efficacy of the digital economy in mitigating carbon emissions and improving efficiency. Consequently, according to Wang
et al.48, this study computes the ISU coefficient by employing a weighted ratio of primary, secondary, and tertiary industries, where a greater coefficient signifies a more sophisticated
industrial structure. By including ISU as a threshold variable, we want to examine how the influence of the digital economy on urban carbon emissions varies throughout different phases of
industrial growth. Details of the calculation are provided below: $$\:ISU=\sum\:_{k=1}^{3}{x}_{k}\times\:k$$ (3) Wherein, \(\:{x}_{k}\) represents the fraction of the total output value
attributable to the k-th industry, with _k_ also serving as the weight factor in the weighted aggregation of the respective industry’s contribution to the total output. * (5) Control
Variables: To precisely evaluate the influence of the digital economy on urban carbon emissions and reduce omitted variable bias, we include the following based on prior research: Industrial
Structure (ind), Financial Development (fin), Social Consumption (cons), Economic Development (pgdp), Investment Level (inv), and Industrial Scale (size) are quantified by the ratios of
tertiary to secondary industry output, financial institution loans to GDP, retail sales to GDP, logarithm of per capita GDP, logarithm of urban fixed asset investment, and logarithm of
designated-size industrial enterprises, respectively. DATA SOURCES AND DESCRIPTIVE STATISTICS The Digital Inclusive Finance Index was developed by the Research Institute at Peking University
in collaboration with Ant Financial. Data on industrial robot density was sourced from the IRF, e-commerce sales from the “Electronic Commerce Statistical Yearbook,” and other information
from the “China City Statistical Yearbook,” municipal bulletins, and the EPS database. Table 3 displays the descriptive statistics for each variable. ANALYSIS OF EMPIRICAL RESULTS BENCHMARK
REGRESSION ANALYSIS To validate Hypothesis 1, this study uses a panel two-way fixed effects model to examine the digital economy’s impact on urban carbon emissions. Table 4 presents the
empirical results. Columns (1) & (2) show significant coefficients (-0.368 & 0.069, _p_ < 0.01) without control variables, indicating digital economy development reduces carbon
emissions and enhances carbon efficiency. Columns (3) & (4) include control variables: Column (3) shows a significant negative coefficient (-0.228, _p_ < 0.01), suggesting a 1%
increase in digital economy reduces urban carbon emission intensity by 22.8%. Column (4) shows a significant positive coefficient (0.065, _p_ < 0.01), indicating a 1% increase enhances
urban carbon efficiency by 6.5%. These findings support Hypotheses 1 & 2, demonstrating the dual benefits of the digital economy in reducing carbon emissions and improving carbon
efficiency. EXAMINATION OF STRUCTURAL EFFECTS Based on the baseline analysis, this study further explores whether the impact of the digital economy on urban carbon emissions differs across
various dimensions. Tables 5 and 6 display empirical findings that examine the correlations between several facets of the digital economy and urban carbon emission intensity/performance.
Table 5’s Columns (1)-(4) assess the impacts of digital industrialization, industrial digitization, digital infrastructure, and digital governance on carbon intensity. Columns (1), (3), and
(4) show significant negative coefficients (_p_ < 0.01), signifying that the progression of digital industrialization, governance, and infrastructure may substantially decrease carbon
intensity. The potential explanations for this are as follows: Digital industrialization facilitates technological transition, optimizing energy consumption and improving efficiency. Digital
governance consolidates and enhances intersectoral data and resources, therefore facilitating carbon reduction. Digital infrastructure has the most substantial influence, presumably owing
to its extensive use across economic and social spheres, attaining great integration with the urban economy and society. In contrast, the negative coefficient in Column (2) does not achieve
significance, indicating that the influence of industrial digitization on carbon reduction remains insignificant, maybe owing to China’s ongoing industrial structural change and the current
phase of digitization growth. Table 6 Illustrates the effects of digital industrialization, industrial digitization, digital infrastructure, and digital governance on urban carbon emission
performance in columns (1) to (4). Regression findings indicate substantial positive coefficients at the 1% and 10% levels for columns (2) and (4), respectively, suggesting that increased
urban industrial digitalization and digital governance improve carbon emission performance. Potential factors encompass industrial digitization and improved digital governance, which not
only advance new technology research and development, fostering energy-efficient and emission-reducing technologies, enhancing efficiency, and attaining carbon economic performance, but also
catalyze the development of new industries, online education, smart city management, and telemedicine, thereby achieving carbon welfare performance. Nonetheless, the coefficient in Column
(1), albeit being positive, does not pass significance tests, indicating that the effect of digital industrialization is negligible. This may be due to its dependence on a high-carbon energy
framework, which impedes the economic performance of carbon emissions, whilst fostering economic development. Furthermore, the environmental costs of digital industrialization, such as
electronic trash, may impose immediate strain on the environment, affecting carbon welfare performance. Conversely, the markedly negative value in Column (3) signifies the detrimental impact
of digital infrastructure. Potential explanations encompass: the building of digital infrastructure utilizes resources, leading to carbon emissions from both manufacture and transportation.
Moreover, abbreviated maintenance cycles diminish resource efficiency and elevate the carbon impact. Although it improves urban service quality and accessibility, hence enhancing carbon
performance, economic and knowledge constraints intensify the digital gap and inequality. This hinders some towns and populations from accessing digital advantages such as education,
healthcare, and employment prospects, hence adversely affecting carbon welfare performance. ROBUSTNESS CHECKS To ensure the reliability of the research findings, this paper employs the
following methods to conduct robustness checks: * (1) Variable Substitution. Step 1: We replace the core explanatory variable, considering that measurement differences may bias the results.
Following Pan et al.49, we use PCA to remeasure urban digital economic development. Table 7, Columns (1) and (2), show the PCA-based digital economy regression results. Column (1)’s
significantly negative coefficient (at the 1% level) aligns with the benchmark results, indicating that the digital economy reduces urban carbon emission intensity. Column (2)’s
significantly positive coefficient (at the 5% level) also matches the benchmarks, suggesting that the digital economy enhances urban carbon emission performance. Step 2: We substitute the
explained variable. The benchmark regression uses carbon emission intensity. For verification, we adopt Dong et al.‘s50 per capita carbon emissions. Using Wu and Guo’s51 method, we remeasure
urban carbon emissions and performance. Table 7, Columns (3) and (4), display the results. Column (3)’s significantly negative coefficient (at the 1% level) confirms that the digital
economy lowers urban per capita carbon emissions. Column (4)’s significantly positive coefficient (at the 1% level) shows that the digital economy boosts urban carbon emission performance.
Step 3: For robustness, we substitute both variables. PCA measures digital economic development, and per capita carbon emissions replace intensity. Carbon emission performance is
recalculated accordingly. Table 7, Columns (5) and (6), present the results. Column (5)’s significantly neg. * (2) Exclusion of Municipalities Directly Under the Central Government: Due to
significant differences in economic, financial development, and carbon emissions between municipalities directly under the central government (Beijing, Tianjin, Shanghai, Chongqing) and
others, this paper excludes their samples and re-runs regression tests. The results in Table 8, Columns (1) and (2), show that excluding these municipalities, the digital economy
coefficients are significantly negative and positive at the 1% level, aligning with benchmark results, confirming robustness. * (3) Winsorization of Control Variables: This paper applies a
1% winsorization to mitigate extreme value impacts on estimation. Table 8, Columns (3) and (4), show that post-winsorization, digital economy coefficients are significantly negative and
positive at the 1% level, confirming its urban carbon reduction and efficiency enhancement effects. * (4) Sample Period Adjustment: Given China’s rapid digital economy growth since 2015,
this paper adjusts the sample period to 2015–2021 and re-estimates. Table 9, Columns (1) and (2), show that post-adjustment, digital economy coefficients are significantly negative and
positive at the 1% level, aligning with benchmark results. * (5) Elimination of Low-Carbon Pilot Interference: To accurately assess digital economy’s impact on urban carbon emissions, this
paper excludes low-carbon pilot cities and re-tests. Table 9, Columns (3) and (4), show that post-exclusion, digital economy coefficients remain significantly negative and positive at the 1%
level, reinforcing paper conclusions. * (6) Endogeneity Test. * a. Two-stage least squares (2SLS). This study employs first- and second-order lags of the digital economy as instrumental
variables to mitigate endogeneity in regression outcomes, in accordance with Guo et al.52. The delays are associated with present digital economy levels owing to historical progression but
affect current carbon emissions independently, fulfilling exogeneity criteria. Table 10 displays the results of the endogeneity test utilizing two-stage least squares (2SLS). Columns (1) and
(4) exhibit substantial positive coefficients for these delays at the 1% significance level. Initial-stage assessments dismiss underidentification (Kleibergen-Paap rk LM = 11.25, _p_ =
0.000) and issues of poor instruments (Cragg-Donald Wald F = 9246.87 > 16.38). Second-stage tests dismiss underidentification (Kleibergen-Paap rk LM = 10.17, _p_ = 0.000) and validate the
robustness of the instruments (Cragg-Donald Wald F = 4299.46 > 16.38). Columns (2)-(3) and (5)-(6) display the results of the second-stage regression, revealing that the coefficients for
the digital economy are significantly negative and positive at the 1% level, respectively. This indicates that, after resolving endogeneity concerns, the digital economy continues to exert
a carbon emission reduction effect and improves urban efficiency. * b. Instrumental Variables(IV). This article employs external instrumental variables to mitigate the influence of
endogenous issues on study outcomes. According to Zhao Tao et al.43,53, the cross-product of the digital economy from the preceding year and the historical data of post and
telecommunications from 1984 was employed as the instrumental variable (IV). Table 11 illustrates the application of a two-stage regression approach to mitigate endogenous issues. The
findings from the initial phase demonstrate that the estimated coefficient of the instrumental variable and dige is considerably positive, and the chosen instrument is justifiable. The
findings from the second stage indicated that the regression coefficient of dige on CI was − 0.354, which was significantly negative at the 1% level. Conversely, the regression coefficient
of dige on CEP was 0.196, significantly positive at the 1% level. This suggests that the conclusions of this article remain robust after addressing endogenous concerns and successfully
passing the causality test. The p-value of the LM test is 0.000, indicating significance at the 1% level, while the Wald·F statistic is 857.860, above the crucial value of 16.38 at the 10%
level of the Stock-Yogo weak identification test. The null hypotheses of inadequate identification and weak identification of instrumental variables are rejected, signifying that
instrumental variables. HETEROGENEITY ANALYSIS * (1) Regional Heterogeneity Analysis. Given China’s vast territory and significant geographical disparities among cities, leading to varied
economic development stages and digital economy progress, along with differing carbon emissions, this study classifies 284 sample cities into East, Central, and West using the National
Bureau of Statistics’ regional standard. The aim is to explore regional variations in the impact of digital economy on urban carbon emissions. Regression results are summarized in Table 12.
In the Central region (Column 3), the digital economy coefficient (-0.789) is significantly negative at the 1% level, indicating a substantial carbon reduction effect. This could be due to
the region’s reliance on traditional industries, where digitalization facilitates transformation and upgrade, enhancing energy efficiency and reducing emissions. In contrast, the Eastern
(Column 1) and Western (Column 5) regions show non-significant coefficients (-0.040 and − 0.047, respectively). Eastern cities, with advanced economies and infrastructure, may have already
implemented effective carbon reduction strategies, reducing the marginal benefit of digital economy. In the West, despite potential for digital-aided carbon reduction, economic,
infrastructural, and technological gaps hinder significant impacts. Interestingly, the Eastern region (Column 2) exhibits a significant positive coefficient (0.092 at 1% level) for digital
economy’s enhancement of carbon emission performance. This could be explained by the region’s robust economy aligning with digital development, fostering efficient models that boost output
while reducing emissions per unit, and improving resident welfare through job creation and social services. Columns 4 and 6 reveal non-significant coefficients (0.055 and 0.072) for the
Central and Western regions, respectively. While digital economy progress is evident, it lags behind the East, failing to significantly reduce emissions from economic activities.
Additionally, less developed digital infrastructure in these regions hinders the realization of carbon emission welfare effects. * (2) Heterogeneity Analysis According to Urban Hierarchy.
Central cities in China are crucial for regional economic growth and significantly affect the relationship between digital finance and urban carbon emissions across various city tiers. This
research classifies cities into central cities (comprising municipalities directly governed by the federal government, provincial capitals, and deputy provincial capitals) and non-central
cities to examine this heterogeneity. The regression outcomes (displayed in Table 13) indicate the following: In urban centers (Column 1), the coefficient of the digital economy (0.250,
significant at the 1% level) suggests that it elevates carbon emissions, likely attributable to heightened economic development and population density, which intensify energy demand from
digital infrastructure. In contrast, in non-central cities (Column 3), the coefficient (-0.520, significant at the 1% level) indicates that the digital economy decreases carbon emissions,
perhaps due to their reduced economic size and lower population density, which lead to decreased energy consumption and enhanced energy efficiency. Moreover, in urban centers (Column 2), the
digital economy improves carbon emission performance (coefficient 0.086, significant at the 5% level), likely due to efficiency advancements from digital technology and appealing digital
lifestyles for highly trained inhabitants. In non-central cities (Column 4), the digital economy negatively impacts carbon emission performance (coefficient − 0.127, significant at the 1%
level), likely due to less compatibility with the digital economy, limited technological penetration, and superficial application depth. * (3) Analysis of Heterogeneity According to Urban
Categories. Historically, resource-dependent cities in China have been substantial carbon emitters. This research, derived from the “National Plan for the Sustainable Development of
Resource-based Cities (2013–2020)” by the State Council, classifies cities as resource-based or non-resource-based to investigate the varied effects of the digital economy on urban carbon
emissions. The regression findings shown in Table 14 indicate: In resource-based cities (Columns 1 & 3), the digital economy exhibits a markedly negative coefficient (-1.435 and − 0.221,
both at the 1% significance level), indicating a more substantial carbon reduction effect in resource-based cities due to the larger absolute value. This results from the digital economy’s
capacity for industrial optimization and enhancements in energy efficiency within high-carbon sectors. Furthermore, it augments carbon emission monitoring, hence enhancing the efficacy of
carbon reduction efforts. In non-resource-based cities (Columns 2 & 4), the digital economy has a markedly negative coefficient (-0.251, at the 1% significance level) in Column 2,
whereas in Column 4, it presents a considerably positive coefficient (0.046, at the 10% significance level). This suggests that the digital economy enhances carbon emission performance in
non-resource-based cities while adversely affecting resource-based cities. This may arise from the greater compatibility of the digital economy with the developmental paradigm of
non-resource-based cities. In resource-dependent cities, the digital transformation of high-carbon industry encounters technological and economic obstacles. Although digital technology
enhances industrial efficiency, these sectors remain significantly dependent on energy, and improvements may produce increased carbon emissions, leading to adverse carbon emission outcomes
at this juncture. Moreover, although the digital economy may ultimately improve carbon emission metrics in resource-dependent cities over time, immediate industrial optimization might result
in employment insecurity and heightened societal costs, adversely affecting welfare outcomes associated with carbon emissions. * (4) Heterogeneity Analysis Stratified by Digital Economy
Structure. Based on the quartile (Q1 at 1/4 and Q3 at 3/4) division of the Digital Economy (Dige) index, cities are categorized into low, medium, and high levels to investigate whether there
are differences in carbon emission reduction (CI) and carbon emission performance (CEP) across these levels. As illustrated in Table 15, the heterogeneous regression results for the digital
economy reveal that, in terms of its impact on carbon emission intensity, under low digital economy conditions (Column 1), carbon emissions increase; under medium digital economy conditions
(Column 2), carbon emissions decrease; and under high digital economy conditions (Column 3), carbon emissions decrease even more significantly. This indicates that the intensity of the
digital economy does reduce carbon emission intensity and exhibits notable heterogeneity. In terms of its impact on carbon emission performance, under low digital economy conditions (Column
4), the effect is insignificant; under medium digital economy conditions (Column 5), the effect is also insignificant; however, under high digital economy conditions (Column 6), carbon
emission performance improves. This suggests that the digital economy does enhance carbon emission performance and demonstrates clear heterogeneity. Therefore, different levels of digital
economy exhibit distinct heterogeneities and have different effects. EXAMINATION OF MECHANISMS This study explores the impact of digital economy development on urban carbon emissions,
focusing on green economic efficiency, green technological innovation quantity, and quality. Following Jiang ‘s54 approach to address potential endogeneity issues, the study adopts the
following framework: Firstly, mechanism variables (M) are selected for green development and green innovation effects: Green economic efficiency for the former, and green technological
innovation quantity and quality for the latter. Secondly, the study demonstrates the influence of these mechanism variables on urban carbon emissions (M→Y), based on existing literature.
Lastly, the impact of the core explanatory variable (digital economy development) on these mechanism variables (X→M) is examined using a benchmark regression model.
$$\:{M}_{it}={\alpha\:}_{0}+{\alpha\:}_{1}{dige}_{it}+{{\alpha\:}_{3}\sum\:Control}_{it}+{\delta\:}_{i}+{\mu\:}_{t}+{\epsilon\:}_{it}$$ (4) Among them, \(\:{M}_{it}\)represents the mechanism
variable. If the coefficient of \(\:{\alpha\:}_{1}\) is significant, it indicates that the development of the digital economy has an impact on the mechanism variable. * (1) Channel for
Green Development Effects. This study examines the impact of the digital economy on urban carbon emissions through green efficiency in the context of green development.Table 16 shows the
regression results. Column (1) reveals a significant positive coefficient of 0.487 for the digital economy at the 5% significance level, indicating a 48.7% enhancement in urban green
economic efficiency for each 1% rise in the digital economy. This fosters urban green growth, facilitating carbon reduction and efficiency, hence validating Hypotheses H1 and H2. * (2)
Channel of Green Innovation Effects. This study examines the impact of the digital economy on urban carbon emissions via the lens of green innovation, taking into account both the number and
quality of green technological advancements.Table 16 presents the regression results. Column (2) displays a notable positive coefficient of 2.709 for the digital economy at the 1%
significance level, signifying a 2.709% rise in urban green technology innovation quantity for each 1% increase in the digital economy. Column (3) indicates a coefficient of 1.371,
significant at the 1% level, implying a 1.371% enhancement in quality for each 1% increase. This validates Hypothesis H3. ADDITIONAL ANALYSIS Analysis of Threshold Effects: This study used a
panel threshold model to examine the effect of the digital economy on urban carbon emissions, focusing on the possible threshold effect related to industrial structure upgrading and its
nonlinear effects. According to Hansen’s55 study, the panel threshold model is formulated as follows: $$\:Y_{{it}} = \eta \:_{0} + \eta \:_{1} dige*I\left( {Z \ll \:\lambda \:_{1} } \right)
+ \eta \:_{2} dige*I\left( {Z > \lambda \:_{1} } \right) + \gamma \:_{6} Control_{{it}} + \delta \:_{i} \mu \:_{t} + \varepsilon \:_{{it}}$$ (5) Z represents the threshold variable, I
denotes the indicator function, and λ signifies the threshold value. The Bootstrap technique replicates the asymptotic distribution of the F statistic, producing P-values and confidence
intervals. Threshold effects are computed for F-values and P-values based on 3,200 repetitions (Table 17). The findings indicate that industrial structure upgrading successfully meets the
single-threshold test at both 5% and 10% significance levels, with thresholds of 2.1033 and 2.1706, hence confirming Hypothesis H3. A single-threshold model is used to examine the threshold
influence of the digital economy on urban carbon emissions. CI denotes Carbon Intensity, whereas CP signifies Carbon Performance. Figure 4 shows the likelihood function plot of model
threshold estimates for carbon emission intensity and performance, with 95% CI distributions. Thresholds of 2.1033 and 2.1706 are at minima. The dashed line is the 1% significance level LR
critical value. LR statistics for thresholds are below this value, with narrow 95% CIs, indicating genuine threshold effects and significant identification. Based on this, Table 18 presents
the threshold regression results. Based on Table 17, the digital economy’s impact on urban carbon emissions is nonlinear, contingent on industrial structure upgrading. Regression results in
column (1) show significant negative coefficients for the digital economy at the 1% level under a single threshold of industrial structure upgrading. This indicates a nonlinear
transformation in the digital economy’s carbon emission reduction effect, weakening as industrial structure upgrading progresses. Specifically, beyond a threshold of 2.1033, the digital
economy’s carbon reduction effect diminishes, though still significant. This may be due to a shift from high- to low-carbon industries, reducing the digital economy’s contribution to urban
carbon reduction. According to column (2) regression results, under a single threshold of industrial structure upgrading, the digital economy exhibits a significant U-shaped relationship
with urban carbon emission performance at the 1% level. Specifically, a low level of industrial structure upgrading negatively impacts urban carbon emission performance via the digital
economy, but surpassing a threshold of 2.1706 reverses this to a positive influence. Initially, as industrial structure upgrading rises below 2.1706, the digital economy hinders urban carbon
emission performance due to mismatch. However, as upgrading improves, compatibility increases, enabling the digital economy to enhance resource allocation efficiency and steadily improve
carbon emission performance. This is because advanced productive forces like the digital economy require compatible advanced industries. GEOGRAPHICALLY AND TEMPORALLY WEIGHTED REGRESSION
(GTWR) To further affirm the impact of the digital economy on carbon emissions, we coupled digital economy intensity (CI) and digital economy productivity (CEP) into a novel variable termed
the carbon emission coupling coordination degree (syeff). In the geographically and temporally weighted regression (GTWR) analysis, syeff was utilized as the new dependent variable, while
the previously defined digital economy (Dige) served as the explanatory variable. The results, presented in Table 19, indicate significance at the 95% confidence level. In addition, we also
produced spatiotemporal dynamic differentiation maps to illustrate the results. The findings are presented as follows: As illustrated in Fig. 5, the regression coefficients of the Digital
Economy (Dige) on the coupling coordination degree of carbon emissions (syeff) in 2011 exhibited a spatial pattern of higher values in the west and south compared to lower values in the east
and north. Positive impacts were concentrated in central inland cities and southern coastal cities, with the highest positive coefficients primarily observed in northwestern cities of Gansu
Province and southwestern cities of Yunnan Province. Conversely, negative effects were centered in some central cities, eastern coastal cities, and northeastern cities, with the most
significant negative coefficients found in parts of Sichuan and Gansu Provinces, as well as in selected cities of Northeast China. When comparing 2016 with 2011, the positive effects
weakened in some central and Yunnan cities, while the negative effects intensified in northeastern cities. By 2021, relative to 2016, most central and coastal cities shifted towards negative
effects, whereas the negative effects diminished in northeastern cities and positive effects strengthened in some regions of Inner Mongolia. In 2011, Jiuquan City exhibited the highest
positive effect (1.112), and the city with the highest negative effect had a coefficient of -1.004; whereas in 2021, Urumqi demonstrated the highest positive effect (1.394), and the city
with the highest negative effect recorded a coefficient of -0.914. These observations indicate that, over the years, there has been notable regional heterogeneity in the impact of the
digital economy on carbon emissions among Chinese cities, with the disparity in these effects gradually narrowing. CONCLUSIONS AND RECOMMENDATIONS RESEARCH CONCLUSIONS Using Chinese
city-level panel data from 2011 to 2021, this paper empirically examines the impact of digital economy development on urban carbon emissions and concludes as follows: * (1) The digital
economy has dual effects on urban carbon emissions: reducing emissions and enhancing efficiency. A 1% increase in its development level can lower urban carbon intensity by 22.8% and improve
carbon emission performance by 6.5%. These results are confirmed by robustness and endogeneity tests. Structurally, digital industrialization, infrastructure, and governance reduce carbon
intensity, while industrial digitization and governance enhance carbon performance. However, digital infrastructure negatively impacts carbon efficiency, and digital industrialization’s
effect is insignificant. * (2) The impact of the Digital Economy (Dige) on carbon emission coordination (syeff) exhibits significant spatial heterogeneity. Between 2011 and 2021, the
positive effects observed in western and southern China gradually diminished and shifted towards northeastern regions and Inner Mongolia, while negative effects became increasingly prominent
in central and eastern coastal cities. Furthermore, across cities with varying levels of digital economy development, the influence of the digital economy on carbon emission intensity and
performance also demonstrates notable heterogeneity: At low levels of digital economy, carbon emission intensity increased with no significant change in performance; at medium levels, carbon
emission intensity decreased, yet performance remained insignificant; and at high levels of digital economy, both carbon emission intensity and performance saw marked improvements, with
inter-regional differences gradually narrowing over time. * (3) The digital economy significantly and nonlinearly impacts urban carbon emissions. It enhances urban green economic efficiency
and green technological innovation, fostering green development and innovation effects, which promote emission reduction and efficiency. Additionally, urban industrial structure upgrading is
a threshold factor influencing the digital economy’s effect on carbon emissions. As industrial structure upgrading improves, the digital economy’s effect on carbon reduction weakens, while
its effect on carbon efficiency shifts from inhibitory to promotional. * (4) The impact of the digital economy on urban carbon emissions varies across locations, city tiers, and types: ①
Geographically, it significantly reduces emissions in central cities but enhances efficiency in eastern cities only. ② By city tier, it increases both emissions and efficiency in central
cities, but decreases both in non-central cities. ③ Regarding urban types, the digital economy reduces both emissions and efficiency in resource-based cities, but cuts emissions while
boosting efficiency in non-resource-based cities. MITIGATION STRATEGIES AND RECOMMENDATIONS * (1) The digital economy markedly decreases urban carbon emissions and improves carbon
efficiency, as evidenced by theoretical and empirical studies.Therefore, enhancing its development to realize its potential is essential. Structural effects assessments reveal significant
influences on urban carbon emissions. Therefore, it is essential to prioritize digital industrialization, infrastructure, and governance for urban carbon reduction, while assuring
synchronized industrial digitalization. Furthermore, utilizing industrial digitization and governance to enhance carbon efficiency, while promoting their synergistic advancement alongside
digital industrialization and infrastructure, will maximize their potential and convert adverse effects into beneficial outcomes. * (2) Utilizing green development and innovation, the
digital economy can diminish urban carbon emissions and improve efficiency. Emphasizing its function in enhancing urban green economic efficiency can harness its potential to optimize
production, energy consumption, and sustainable consumption, resulting in holistic advancements and supporting green development. Simultaneously, leveraging its advocacy for green
technological innovation, we must get support in technology, financing, talent development, and market growth to advance innovation and promote a green impact, facilitating carbon reduction
and efficiency improvement. * (3) The emphasis should be on the threshold effect of industrial structure enhancement in mediating the influence of the digital economy on urban carbon
emissions. Research indicates that when advancements in technology escalate, the digital economy transitions from obstructing to enhancing urban carbon efficiency. Although its effect on
decrease diminishes, it remains superior to the baseline. Consequently, the robust advancement of high-tech, emergent, advanced manufacturing, and future sectors is essential for optimizing
structural integrity to augment the digital economy’s impact on urban carbon reduction and efficiency. * (4) Consideration must be given to the varied effects of the digital economy on urban
carbon emissions. Initially, targeted strategies must address the strengths and weaknesses of cities: Improve carbon efficiency in the developed eastern regions and prioritize emission
reduction in the less developed middle and western regions. Secondly, cities of varying tiers should focus distinct impacts of the digital economy: core cities ought to investigate digital
avenues for carbon reduction, whereas non-central towns should contemplate innovative strategies for enhancing carbon efficiency. Ultimately, both resource-based and non-resource-based
cities, the digital economy substantially facilitates emission reduction, however it hampers efficiency in resource-based cities. Consequently, non-resource-based cities can stimulate
advancements in the digital economy of resource-based cities, thereby improving their carbon efficiency. DATA AVAILABILITY The datasets used and analyzed during the current study available
from the corresponding author on reasonable request. REFERENCES * Wu, Y., Zinb, A. M. A., Zhu, X. & Lin, S. Digital economy’s role in shaping carbon emissions in the construction field:
Insights from Chinese cities. _J. J. Environ. Manage._ 365, 121548 (2024). Article CAS PubMed Google Scholar * Moyer, J. D. & Hughes, B. B. ICTs: do they contribute to increased
carbon emissions? _J. Technological Forecast. Social Change_. 75 (5), 919–931 (2012). Article Google Scholar * Huang, B. H. X. The future of carbon-neutrality science and technology from
an industrial transformation perspective: An interview with Hou-Liang Dai. _J. Natl. Sci. Rev._ 10 (9), nwac295 (2023). Article Google Scholar * Wang, J., Dong, X. & Dong, K. How
digital industries affect China’s carbon emissions? Analysis of the direct and indirect structural effects. _J. Technol. Soc._ 68, 101911 (2022). Article MATH Google Scholar * Xie, B.,
Liu, R. & Dwivedi, R. Digital economy, structural deviation, and regional carbon emissions. _J. Clean. Prod._ 434, 139890 (2024). Article CAS MATH Google Scholar * Li, Z. & Wang,
J. The dynamic impact of digital economy on carbon emission reduction: Evidence city-level empirical data in China. _J. J. Clean. Prod._ 351, 131570 (2022). Article CAS Google Scholar *
Ma, Q., Tariq, M., Mahmood, H. & Khan, Z. The nexus between digital economy and carbon dioxide emissions in China: the moderating role of investments in research and development. _J.
Technol. Soc._ 68, 101910 (2022). Article MATH Google Scholar * Chang, H., Ding, Q., Zhao, W., Hou, N. & Liu, W. The digital economy, industrial structure upgrading, and carbon
emission intensity: Empirical evidence from China’s provinces. _J. Energy Strategy Reviews_. 50, 101218 (2023). Article MATH Google Scholar * Li, Z. & Wang, J. The dynamic impact of
digital economy on carbon emission reduction: Evidence from city-level empirical data in China. _J. J. Clean. Prod._ 351, 131570 (2022). Article CAS Google Scholar * Wang, S. Digital
economy development for urban carbon emissions: ‘Accelerator’ or ‘Speed Bump’? _J. Resour. Environ._ 33 (6), 11–22 (2023). MATH Google Scholar * Zhang, W., Liu, X., Wang, D. & Zhou, J.
Digital economy and carbon emission performance: Evidence at China’s city level. _J. Energy Policy_. 165, 112927 (2022). Article CAS Google Scholar * Li, Z. et al. The impact of digital
economy on industrial carbon emission efficiency at the city level in China: Gravity movement trajectories and driving mechanisms. _J. Environ. Technol. Innov._ 33, 103511 (2024). Article
CAS MATH Google Scholar * He, D. et al. Managing emissions with smart city technology. _J. Sci._ 385, 1173–1174 (2024). CAS MATH Google Scholar * Shi, D. Evolution of industrial
development trend under digital economy. _J. China Industrial Econ._ 11, 26–42 (2022). MATH Google Scholar * Pouri, M. J. & Hilty, L. M. The digital sharing economy: A confluence of
technical and social sharing. _J. Environ. Innov. Societal Transitions_. 38, 127–139 (2021). Article Google Scholar * Han, F., Huang, M. & Jiang, Z. Enterprise digitalization, network
status and pollution reduction. _J. J. World Econ._ 02, 204–232 (2024). MATH Google Scholar * Ban, N. & Zhang, X. Research on the effect of digital economy on carbon emissions from
household consumption. _J. China Environ. Sci._ 43 (12), 6625–6640 (2023). MATH Google Scholar * Zhang, Y. J. & Du, M. Greening through digitalisation? Evidence from cities in China.
_J. Reg. Stud._ 06, 1–15 (2023). CAS MATH Google Scholar * Shen, Y., Wang, G., Wu, X. & Shen, C. Digital economy, technological progress, and carbon emissions in Chinese provinces.
_J. Sci. Rep._ 14, 23001 (2024). Article CAS MATH Google Scholar * Shao, S., Fan, M. & Yang, L. Economic restructuring, green technical progress, and low-carbon transition
development in China: An empirical investigation based on the overall technology frontier and spatial spillover effect. _J. Manage. World_. 38 (02), 46–69 (2022). MATH Google Scholar *
Wang, S. & Li, J. Nonlinear spatial impacts of the digital economy on urban ecological welfare performance: Evidence from China. _J. Front. Ecol. Evol._ 12, 1361741 (2024). Article
Google Scholar * Lyu, Y., Wang, W., Wu, Y. & Zhang, J. How does digital economy affect green total factor productivity? Evidence from China. _J. Sci. Total Environ._ 857, 159428 (2023).
Article CAS Google Scholar * Wang, L. & Shao, J. Digital economy, entrepreneurship and energy efficiency. _J. Energy_. 269, 126801 (2023). Article MATH Google Scholar * Li, C.,
Jia, Q. & Li, G. China’s energy consumption and green economy efficiency: An empirical research based on the threshold effect. _J. Environ. Sci. Pollution Res._ 27, 36621–36629 (2020).
Article MATH Google Scholar * Lin, B. & Tan, R. Economic agglomeration and green economy efficiency in China. _J. Economic Res. J._ 54 (02), 119–132 (2019). MATH Google Scholar *
Luo, K., Liu, Y., Chen, P. F. & Zeng, M. Assessing the impact of digital economy on green development efficiency in the Yangtze River Economic Belt. _J. Energy Econ._ 112, 106127 (2022).
Article Google Scholar * Dian, J., Song, T. & Li, S. Facilitating or inhibiting? Spatial effects of the digital economy affecting urban green technology innovation. _J. Energy Econ._
129, 107223 (2024). Article Google Scholar * Chen, W. et al. How does digitization enable green innovation? Evidence from Chinese listed companies. _J. Bus. Strategy Environ._ 33 (5),
3832–3854 (2024). Article MATH Google Scholar * Xu, R., Yao, D. & Zhou, M. Does the development of digital inclusive finance improve the enthusiasm and quality of corporate green
technology innovation? _J. J. Innov. Knowl._ 8 (3), 100382 (2023). Article MATH Google Scholar * Huang, X., Zhang, S., Zhang, J. & Yang, K. Research on the impact of digital economy
on Regional Green Technology Innovation: Moderating effect of digital talent aggregation. _J. Environ. Sci. Pollution Res._ 30 (29), 74409–74425 (2023). Article MATH Google Scholar * Luo,
S. et al. Digitalization and sustainable development: how could digital economy development improve green innovation in China? _J. Bus. Strategy Environ._ 32 (4), 1847–1871 (2023). Article
MATH Google Scholar * Xu, L., Fan, M., Yang, L. & Shao, S. Heterogeneous green innovations and carbon emission performance: Evidence at China’s city level. _J. Energy Econ._ 99,
105269 (2021). Article MATH Google Scholar * Du, K., Li, P. & Yan, Z. Do green technology innovations contribute to carbon dioxide emission reduction? Empirical evidence from patent
data. _J. Technological Forecast. Social Change_. 146, 297–303 (2019). Article Google Scholar * Tang, P., Liu, X., Hong, Y. & Yang, S. Moving beyond economic criteria: Exploring the
social impact of green innovation from the stakeholder management perspective. _J. Corp. Social Responsib. Environ. Manage._ 30 (3), 1042–1052 (2023). Article MATH Google Scholar * Yi,
M., Liu, Y., Sheng, M. S. & Wen, L. Effects of digital economy on carbon emission reduction: New evidence from China. _J. Energy Policy_. 171, 113271 (2022). Article CAS MATH Google
Scholar * Dong, K., Yang, S. & Wang, J. How digital economy lead to low-carbon development in China? The case of e-commerce city pilot reform. _J. J. Clean. Prod._ 391, 136177 (2023).
Article CAS Google Scholar * Wang, S., Wang, X. & Chen, S. Global value chains and carbon emission reduction in developing countries: does industrial upgrading matter? _J. Environ.
Impact Assess. Rev._ 97, 106895 (2022). Article MATH Google Scholar * Li, Z., Shao, S., Shi, X., Sun, Y. & Zhang, X. Structural transformation of manufacturing, natural resource
dependence, and carbon emissions reduction: Evidence of a threshold effect from China. _J. J. Clean. Prod._ 206, 920–927 (2019). Article MATH Google Scholar * Luan, B., Yang, H., Zou, H.
& Yu, X. The impact of the digital economy on inter-city carbon transfer in China using the life cycle assessment model. _J. Humanit. Soc. Sci. Commun._ 10, 585 (2023). Article MATH
Google Scholar * Wang, M. & Cai, B. A two-level comparison of CO2 emission data in China: Evidence from three gridded data sources. _J. J. Clean. Prod._ 148, 194–201 (2017). Article
MATH Google Scholar * Wang, S., Wang, J., Fang, C. & Li, S. Estimating the impacts of urban form on CO2 emission efficiency in the Pearl River Delta. _China J. Cities_. 85, 117–129
(2019). Article MATH Google Scholar * Bai, P. & Zhang, Y. Digital economy, declining demographic dividends and the rights and interests of low-and medium-skilled labor. _J. Economic
Res. J._ 56 (05), 91–108 (2021). MATH Google Scholar * Zhao, T., Zhang, Z. & Liang, S. Digital economy, entrepreneurship, and high-quality economic development: Empirical evidence from
urban China. _J. Manage. World_. 36 (10), 65–76 (2020). MATH Google Scholar * Fan, Z. & Zhao, R. Does rule of law promote pollution control? Evidence from the establishment of the
environmental court. _J. Economic Res. J._ 54 (03), 21–37 (2019). MATH Google Scholar * Xiao, T., Sun, R., Yuan, C. & Sun, J. Digital transformation, human capital structure adjustment
and labor income share. _J. Manage. World_. 38 (12), 220–237 (2022). MATH Google Scholar * Feng, S., Zhang, R. & Li, G. Environmental decentralization, digital finance and green
technology innovation. _J. Struct. Change Economic Dynamics_. 61, 70–83 (2022). Article MATH Google Scholar * Song, D., Li, C. & Li, X. Does the construction of new infrastructure
promote the ‘quantity’ and ‘quality’ of green technological innovation — evidence from the national smart city pilot. _J. China Popul. Resour. Environ._ 31 (11), 155–164 (2021). MATH Google
Scholar * Wang, W., Li, Y. F. & Peng, D. D. Research on effects of Population aging on industrial upgrading. _J. China Industrial Econ._ 11, 47–61 (2015). MATH Google Scholar * Pan,
W., Xie, T., Wang, Z. & Ma, L. Digital economy: An innovation driver for total factor productivity. _J. J. Bus. Res._ 139, 303–311 (2022). Article MATH Google Scholar * Dong, F. et
al. How does digital economy affect carbon emissions? Evidence from global 60 countries. _J. Sci. Total Environ._ 852, 158401 (2022). Article CAS Google Scholar * Wu, J. & Guo, Z.
Research on the convergence of carbon dioxide emissions in China: A continuous dynamic distribution approach. _J. Stat. Res._ 33 (01), 54–60 (2016). MATH Google Scholar * Guo, F., Xiong,
Y., Shi, Q. & Wang, J. The re-estimation of digital economy and economic development in administrative border areas: Evidence from nighttime light data. _J. Manage. World_. 39 (04),
16–33 (2023). MATH Google Scholar * W L., L X. & D W. Digital Economy, Urban Innovation and Smog Pollution. _J. World Surv. Res._ 03, 11–20 (2023). * Jiang, T. Mediating effects and
moderating effects in causal inference. _J. China Industrial Econ._ 05, 100–120 (2022). MATH Google Scholar * Hansen, B. E. Threshold effects in non-dynamic panels: Estimation, testing,
and inference. _J. J. Econometrics_. 93 (2), 345–368 (1999). Article MathSciNet MATH Google Scholar Download references FUNDING The research was supported by the National Natural Science
Foundation of China (42477173, 42442060); The Center of Sichuan Nationalities and Mountains Economic Development (SDJJ202304); The Center of Scientific and Technological Innovation and New
Economy Institute of Chengdu-Chongqing Economic Zone (CYCX2024YB10); The Sichuan Traditional Chinese Medicine Development Research Center (STDYB202402); The Research Center of Potato Staple
Food Strategy (MLS202409); The Research Center of Protection Policy of Key Ecological Function Areas in the Upper Reaches of the Yangtze River (YREPC2024-YB007); The Research Center of
Chengdu Park City Demonstration Zone Construction (GYCS2024-YB007). AUTHOR INFORMATION AUTHORS AND AFFILIATIONS * School of Finance and Accounting, Chengdu Jincheng College, Chengdu, 610097,
Sichuan, China Xin Liu, Liang Chen & Lili Zhang * College of Business and Economics, Australian Capital Territory , Australian National University, Canberra, 2600, Australia Yifu Lu *
State Key Laboratory of GeoHazard Prevention and GeoEnvironment Protection, Chengdu University of Technology, Chengdu, 610059, Sichuan, China Liang Chen & Ming Chang * College of
Business, Chengdu University of Technology, Chengdu, 610097, Sichuan, China Yi Xiao & Haonan Yang * College of Business, Southwest Jiaotong University Hope College, Chengdu, 610400,
Sichuan, China Deyuan Kong Authors * Xin Liu View author publications You can also search for this author inPubMed Google Scholar * Liang Chen View author publications You can also search
for this author inPubMed Google Scholar * Yifu Lu View author publications You can also search for this author inPubMed Google Scholar * Ming Chang View author publications You can also
search for this author inPubMed Google Scholar * Yi Xiao View author publications You can also search for this author inPubMed Google Scholar * Haonan Yang View author publications You can
also search for this author inPubMed Google Scholar * Deyuan Kong View author publications You can also search for this author inPubMed Google Scholar * Lili Zhang View author publications
You can also search for this author inPubMed Google Scholar CONTRIBUTIONS X.L. wrote the article, conceptualized, organized data, analyzed, and revised. L.C. organized, guided, funded,
wrote, revised, and developed methodology. Y.L. organized, revised, and funded. M.C. & Y.X. provided funding. H.Y. organized data and plotted figures. D.K. wrote the initial draft. L.Z.
collected data and prepared figures. All authors reviewed the manuscript. CORRESPONDING AUTHORS Correspondence to Liang Chen or Yifu Lu. ETHICS DECLARATIONS COMPETING INTERESTS The authors
declare no competing interests. ADDITIONAL INFORMATION PUBLISHER’S NOTE Springer Nature remains neutral with regard to jurisdictional claims in published maps and institutional affiliations.
RIGHTS AND PERMISSIONS OPEN ACCESS This article is licensed under a Creative Commons Attribution 4.0 International License, which permits use, sharing, adaptation, distribution and
reproduction in any medium or format, as long as you give appropriate credit to the original author(s) and the source, provide a link to the Creative Commons licence, and indicate if changes
were made. The images or other third party material in this article are included in the article’s Creative Commons licence, unless indicated otherwise in a credit line to the material. If
material is not included in the article’s Creative Commons licence and your intended use is not permitted by statutory regulation or exceeds the permitted use, you will need to obtain
permission directly from the copyright holder. To view a copy of this licence, visit http://creativecommons.org/licenses/by/4.0/. Reprints and permissions ABOUT THIS ARTICLE CITE THIS
ARTICLE Liu, X., Chen, L., Lu, Y. _et al._ Research on the impact of the digital economy on carbon emissions based on the dual perspectives of carbon emission reduction and carbon
efficiency. _Sci Rep_ 15, 3416 (2025). https://doi.org/10.1038/s41598-025-87098-1 Download citation * Received: 16 October 2024 * Accepted: 16 January 2025 * Published: 27 January 2025 *
DOI: https://doi.org/10.1038/s41598-025-87098-1 SHARE THIS ARTICLE Anyone you share the following link with will be able to read this content: Get shareable link Sorry, a shareable link is
not currently available for this article. Copy to clipboard Provided by the Springer Nature SharedIt content-sharing initiative KEYWORDS * Digital Economy * Carbon emissions * Carbon
Emission reduction * Carbon Efficiency Enhancement