- Select a language for the TTS:
- UK English Female
- UK English Male
- US English Female
- US English Male
- Australian Female
- Australian Male
- Language selected: (auto detect) - EN
Play all audios:
ABSTRACT Accurately identification of the seizure onset zone (SOZ) is pivotal for successful surgery in patients with medically refractory epilepsy. The purpose of this study is to improve
the performance of model predicting the epilepsy surgery outcomes using genetic neural network (GNN) model based on a hybrid intracranial electroencephalography (iEEG) marker. We extracted
21 SOZ related markers based on iEEG data from 79 epilepsy patients. The least absolute shrinkage and selection operator (LASSO) regression was employed to integrated seven markers, selected
after testing in pairs with all 21 biomarkers and 7 machine learning models, into a hybrid marker. Based on the hybrid marker, we devised a GNN model and compared its predictive performance
for surgical outcomes with six other mainstream machine-learning models. Compared to the mainstream models, underpinning the GNN with the hybrid iEEG marker resulted in a better prediction
of surgical outcomes, showing a significant increase of the prediction accuracy from approximately 87% to 94.3% (P = 0.0412). This study suggests that the hybrid iEEG marker can improve the
performance of model predicting the epilepsy surgical outcomes, and validates the effectiveness of the GNN in characterizing and analyzing complex relationships between clinical data
variables. SIMILAR CONTENT BEING VIEWED BY OTHERS MACHINE-LEARNING FOR THE PREDICTION OF ONE-YEAR SEIZURE RECURRENCE BASED ON ROUTINE ELECTROENCEPHALOGRAPHY Article Open access 04 August
2023 MACHINE LEARNING ALGORITHM FOR PREDICTING SEIZURE CONTROL AFTER TEMPORAL LOBE RESECTION USING PERI-ICTAL ELECTROENCEPHALOGRAPHY Article Open access 18 September 2024 MACHINE LEARNING ON
INTERICTAL INTRACRANIAL EEG PREDICTS SURGICAL OUTCOME IN DRUG RESISTANT EPILEPSY Article Open access 05 March 2025 INTRODUCTION Epilepsy, a debilitating neurological disorder, affects an
estimated 60 million people worldwide and approximately 30% of those affected suffer from drug-resistant epilepsy (DRE)1. Successful surgical intervention provide better seizure control and
overall quality of life compared to medication2. However, the success rate of the epilepsy surgery was only 70% for adult3. Central to the success of surgical interventions is the accurate
identification of the seizure onset zone (SOZ). By accurately identifying the SOZ, physicians can surgically target and remove or disrupt the brain regions generating these abnormal
activities, effectively reducing the frequency and severity of seizures. Moreover, localizing the SOZ helps prevent damage to healthy brain tissue, preserving the patient’s neurological
function and cognitive abilities to the greatest extent possible. Therefore, for patients with drug-resistant epilepsy, precise localization of the SOZ is fundamental and a critical step in
surgical treatment. This process necessitates neuroimaging assessments and localization techniques to ensure optimal therapeutic outcomes and patient safety, ultimately improving the quality
of life for individuals living with epilepsy2,4. However, it is difficult to identify SOZ due to the high complexity of the brain network and the variability of epilepsy manifestations4,5.
A number of EEG markers have been employed to localize the SOZ. These markers are mainly established based on frequency band power analysis, functional connectivity analysis, and graph
theory. For example, High-frequency oscillations (HFOs), those higher than 100 Hz, have emerged as excellent surgical marker due to its contribution to the precise localization of
SOZ6,7,8,9. In addition, functional connectivity analysis has also gained popularity as a strategy for identifying the SOZ. This approach allows researchers to map out the SOZ by observing
alterations in brain activity pre-seizure and post-seizure and analyzing the functional connectivity of electrical signals across various brain nodes10. Pearson’s correlation coefficient is
often regarded as a measurement marker of intracranial functional connection11. Recently, the principle of neural fragility, which hypothesizes that epilepsy results from the disruption of
the brain’s stable connectivity, is leveraged to pinpoint the SOZ12. Moreover, graph theory is utilized to gauge alterations in brain network connectivity13,14,15. Some graph theory
constructs, including eigenvector centrality and betweenness centrality, have been used to detect the SOZ16,17. Graph theory have also been applied to high-frequency oscillation analysis,
and exhibits high performance in identifying the SOZ18. It should be noted that, however, most of the above studies only focus on a single marker and the precision of individual markers for
predicting and delineating the SOZ is often restricted, given their basis on specific assumptions and the variable recognition efficiency tied to patient-specific traits and distinct
datasets. Faced with the high complexity and variability of epilepsy manifestations, it is necessary to identify the most suitable model tailored to the characteristics of iEEG data. Hence,
the incorporation of diverse markers and development of an effective mathematical model is of paramount importance. In this study, by combining the hybrid iEEG markers, we developed a
predictive neural network model based on genetic algorithms, which is GNN19. We compared its predictive capacity for surgery outcomes with that of six other mainstream machine learning
methods, including logistic regression (LR), decision tree (DT), backpropagation neural network (BPNN), support vector machine (SVM), naive bayes model (NBM), and k-nearest neighbor
(KNN)20,21,22,23. Specifically, based on the analysis of the iEEG data from 79 epilepsy patients, we selected seven exceptional markers from 21 SOZ identification markers, including neural
fragility and 6 spectral-based features and combined them into a hybrid SOZ related marker. Leveraging the GNN model based on genetic algorithms, we formed an internal quantitative
relationship between the hybrid marker characteristics and surgical outcomes in epilepsy patients. As the result, this model predicted surgery outcomes with an accuracy of over 94%, showing
substantial benefit to clinical surgeries with ordinarily low success rates of 30–70%3. A series of comparisons revealed superior performance of the GNN over traditional machine learning
models when utilizing both hybrid and single markers, and improved performance when hybrid markers was employed various machine learning models relative to single markers. RESULTS TWENTY-ONE
SOZ MARKERS The fragility of neural nodes can be quantified using high-resolution EEG technology to identify the SOZ12. Centrality, a graph theory concept, is also used in this study. It
describes the importance of each node in the network based on the correlation of different nodes. Two different modes of centrality are used in this study: degree and eigenvector
centralities15,16, which describe the importance of nodes in various ways and help distinguish the seizure area from other areas. The centrality is calculated based on the correlation
coefficient and coherence of EEG data. The correlation coefficient is applied to time domain signals, whereas coherence measures the relevance between node signals in the frequency domain.
EEG data are transformed from the time domain to the frequency domain by Fourier transformation and then subjected to the spectrum analysis. Based on the six spectral-based features of EEG
(such as the beta band ranging from 13 to 30 Hz and high-gamma > 90 Hz), the average values are taken in a small-time window to obtain the brain energy changes. Please refer to the Method
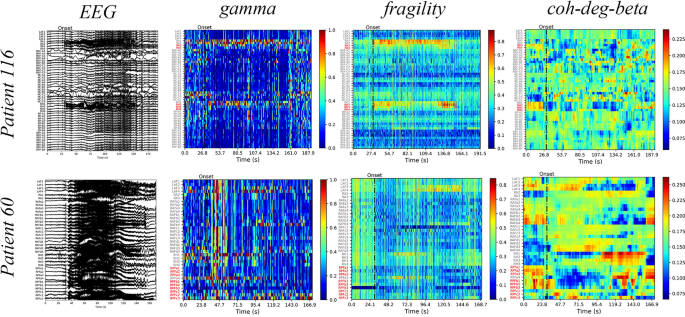
section for the formulae used for calculating the aforementioned markers. We illustrate the gamma, neural fragility, and beta band centrality of patients 116 and 60 (Fig. 1). The heat maps
revealed that the surgical resection channel (red) for the successful patient 116 coincided with or is mostly located within the SOZ identified using the markers. Contrastingly, for patient
60 who had an unsuccessful surgery, the surgical area is not situated or is mostly not located within the SOZ identified using the markers. These findings highlight the importance of
accurately identifying the SOZ for the surgery to be successful, as visually inspecting the original EEG alone may be insufficient to make such judgments. Additionally, the visualization
through a heat map of markers, also known as EEG source imaging (ESI), assists clinicians in the selection of the surgical area24. We combine the 21 markers with seven machine-learning
models and separately trained them. To ensure optimal performance, we determine the range of the relevant hyperparameters through pretraining and set the lost weight in PyTorch to avoid
sample imbalance25. Each combination in the dataset of 79 patients is trained 10 times and 20% data is fixed a verification set. During each training, 70% of the data is allocated to the
training set and 10% is allocated to the test set. For each combination, the average accuracy rates on the training-test and verification sets are calculated (Fig. 2). According to the
results obtained, we select combinations with a top 25% accuracy on the training-test and the verification sets. This result in 9 combinations intersecting (Fig. 3A). This method ensures
that the chosen combinations have excellent performance on both sets, without exhibiting high accuracy in only one of them. Among these nine combinations, the accuracy of gamma-GNN with the
best performance is 87.85/87.95% in the training test set/verification set, while that of the ninth beta-SVM model is 80.95%/76.87%. Meanwhile, 7 markers in these 9 combinations are commonly
used markers, which include neural fragility and the averages of six frequency bands. Similarly, for each machine learning algorithm, these seven markers are also the best. Subsequently,
these seven markers are used for further constructing hybrid markers. Additionally, the GNN performs well in all combinations, dominating the top seven. The average accuracy of the GNN is
74.78%/76.58% on the training-test set/verification set, while the sub-optimal model is 75.81%/70.55% (Fig. 3B). SOZ RELATED HYBRID IEEG MARKER Directly combining the features of the seven
selected markers result in a high-dimensional feature space that is not conducive to training subsequent machine learning models. This issue is addressed using LASSO regression, which
selectively incorporates each feature into the model and reduces the dimensionality of the input features by controlling the coefficient to 0. This approach help avoid overfitting, thereby
retaining six important variables (Supplementary Fig. 2). PERFORMANCE OF GNN COMBINED WITH HYBRID IEEG MARKER We use the aforementioned hybrid SOZ markers as input for seven machine-learning
models and use the surgical outcomes of patients as the output for investigating prediction efficacy. Each combination is trained 10 times, with training-test sets and verification sets.
The average accuracy of GNN is 94.3% (Fig. 4A), which is significantly better than the decision tree of the suboptimal model by 6.59% (_P_ = 0.0412; McNemar’s test; McNemar’s test can be
used to compare the performance of two models on the same dataset)26. The maximum accuracy, upper quartile, median, lower quartile and minimum value in GNN training are 97.47%, 94.94%,
94.30%, 92.72% and 91.14%, while the highest accuracy of other models is only 93.67%. Receiver operating curves (ROC) are constructed to assess the classification ability of the models. The
greater the area under the curve (AUC), the closer the curve is to the upper left corner (0,1). The GNN has the best performance with AUC = 0.94, which is significantly higher than that of
the suboptimal model (13.25% higher; Fig. 4B; Delong’s test; maximum p-value of GNN and other models is 0.0461. The significance of the ROC curve is tested using Delong’s test27). Moreover,
considering all single SOZ markers and machine learning models previously mentioned, the GNN based on hybrid marker still exhibit superior performance, which is 7.28% higher than the
suboptimal combination (Gamma + GNN: 87.90%). The predictive ability of the GNN based on hybrid markers remains unaffected by gender and the dominant hand (Fig. 5). The probability of
predicting success represents the likelihood of a patient’s surgery is successful. A probability > 0.5 indicates that the model predicts the surgery to be successful and vice versa. The
difference in the model’s predictive ability for patients of different sexes or handedness is insignificant (Mann–Whitney U test28; gender _P_ = 0.8245 and handedness _P_ = 0.3811).
DISCUSSION In this study, we have undertaken an exhaustive comparison of common and SOZ related hybrid iEEG markers across a range of machine learning models, with a specific focus on their
effectiveness in predicting successful epilepsy surgical outcomes. Our findings reveals that the GNN, underpinned by hybrid markers, achieves an impressive accuracy of over 94%, surpassing
other models by more than 6.59% (_P_ = 0.0412). This remarkable accuracy is achieved using the GNN model paired with hybrid markers, whether in singular or combined feature. In the single
marker prediction, the spectral feature of high-gamma band has great performance, which is consistent with the current mainstream concepts such as the influence of high-frequency oscillation
on epilepsy, suggesting that high-frequency band (> 90 Hz) cannot be ignored in the study of epilepsy origin6,7,8. Epilepsy surgery is crucial for treating patients with drug-resistant
epilepsy, and improving the success rate of surgery is of utmost importance. Even a small increase in prediction accuracy would represent a significant step forward. Numerous researchers
have proposed various SOZ localization markers and epilepsy localization models to facilitate the assessment of the feasibility and efficacy of surgical plans by clinicians before surgery.
Some of them also utilize machine learning models to predict surgical outcomes, achieving accuracy rates ranging from 60 to 95%20,22,24. Our accuracy surpasses the results reported in the
majority of these research studies. Particularly noteworthy is that studies employing hybrid label-driven machine learning models consistently demonstrated strong performance on their own
datasets, affirming the viability and effectiveness of this approach23,29. Our study presents a comprehensive “combination boxing” approach with an impressive prediction accuracy of 94.30%.
With the incorporation of additional data, markers, or machine learning models, we can further enhance the precision of our predictions using this method. Machine learning is an effective
tool for recognizing data patterns with unclear mechanisms. However, training an unimproved machine learning model may yield inadequate results. Our GNN model differs from other mainstream
machine learning models due to the utilization of genetic algorithm, which trains and optimizes neural network parameters through evolutionary processes, rather than relying solely on
gradient-based optimization methods. This enables GNN model to effectively capture complex relationships within the data, enhancing its capability to handle nonlinear relationships and
high-dimensional data. The significant improvement in prediction accuracy of GNN model is a result of the synergistic interaction between its unique neural network functionality and
integrated genetic algorithm19. In this study, we compare the performance of a common neural network with that of a GNN. GNN outperformed in both single-marker and hybrid-marker scenarios.
In particular, the GNN achieve an accuracy of 75.68% for a single marker and 94.30% for hybrid markers, whereas the common neural network achieved an accuracy of only 73.18% for a single
marker and 85.70% for hybrid markers. Notably, the author of the fragility work also use deformation models of traditional random forests to predict surgical outcomes, whereas we propose a
genetic algorithm-based neural network that can expand the range of machine learning models with efficient prediction ability30. Furthermore, we discover certain counterfactual scenarios
when we use this approach to review and analyze previous surgical resection plans. In Fig. 6, the left picture indicates the patient’s original EEG during the seizure, whereas the table on
the right indicates the SOZ seizure areas identified by the seven markers. The surgical column shows the channels in the surgical area (indicated by the red font in the highlighted part of
the table). Patient pt13 exhibit successful surgical outcomes, and our GNN model with hybrid markers predict the success of the surgery. The predictions of the seven markers closely matched
the resection expectations of clinicians, indicating that the markers could simulate clinician judgment. Similarly, the surgery for patient 60 fails, and our model accurately predict
surgical failure. We observed that the predictions of the markers are strikingly incongruous with the resection area of clinicians, suggesting that our model exhibited better judgment than
the clinicians in some cases. For patient pt14, the predictions of markers matched the clinical viewpoints, and our model predicted successful surgery every time. Unfortunately, the surgery
failed, suggesting that the failure is not attributed to inaccurate positioning. This failure may have been because of other factors such as postoperative rehabilitation and the formation of
new lesions2,5. In summary, our GNN model with hybrid markers demonstrate SOZ localization abilities that are comparable to those of clinicians and provided accurate predictions of surgical
results. Currently, the inadequate availability of high-quality data and incomplete surgical information are major obstacles to accurately predicting epilepsy surgery outcomes. Our study
data are from the open data repository12,31. These samples, originating from various studies, may be subject to factors such as collection methods, selection biases, or publication biases.
While the sample size in our epilepsy SOZ recognition field may be deemed acceptable, it may still be insufficient for a large-scale model training purpose. The scarcity of data makes it
challenging to apply large-scale models and use high-dimensional inputs, which in turn complicates the validation of the reliability of each SOZ marker in other study. Insufficient data not
only relates to the current state of surgical treatment but also presents ethical considerations in medical practice. Furthermore, SOZ markers from different perspectives rely on their
assumptions and unpublished data, complicating the replication of previous studies and making it difficult to evaluate the reliability of these markers. Our manuscript delineates a study
employing an approach combining multiple markers and machine learning models, applied to iEEG data to explore the potential for localizing SOZ and predicting surgical outcomes. Our findings
stem from real clinical surgical samples across various studies, integrating 21 markers and 7 machine learning models. Considering factors such as sample representativeness, external
validity, clinical relevance, and potential limitations affecting generalizability, we believe the credibility and persuasiveness of our research outcomes. However, in no way are we
proposing that the direct clinical application of these algorithms or models. Instead, our discovery suggests that the integration of hybrid marker with the GNN model can more effectively
identify SOZ and assist in predicting surgical outcomes, underscoring the need for caution when applying singular marker and machine learning models in clinical settings. Our study has
revealed a proliferation of various SOZ identification markers, offering new possibilities for clinical translation. We have proposed an innovative approach, termed the “combination boxing”
method, which involves constructing hybrid markers and integrating refined machine learning models. This method holds promise in consolidating diverse markers to leverage their strengths,
thereby enhancing identification accuracy and predictive performance. Moreover, we plan to investigate alternative data collection channels to maximize resource utilization, thus bolstering
the credibility and impact of our study. Concurrently, we will engage in discussions regarding future research directions to further evaluate the applicability of our findings in clinical
practice. METHODS IEEG DATASETS AND DEFINITION OF SURGICAL OUTCOMES We use the datasets collected by Lohith G and Adam Li groups (namely dataset 1 and 2 in this work), which is available
from the open data website www.openneuro.org12,31. The detail information of the two datasets are summarized in Supplementary Table 1. The following data all indicate the electrodes
contained in the surgery area, which are regarded as SOZ recognized by the clinicians, and other electrodes are regarded as SOZc. The SOZ related markers are calculated based on the period
from 30 s before the seizure onset to the end for analysis. The selection of this period not only encompass the entire seizure event but also considered the iEEG information before the
seizure. The definition of surgical success is the same in both datasets. After at least 12 months, patients who had surgical outcome of Engel I or ILAE 1–2 are marked as successful outcome
and patients who had Engel II–IV or ILAE 3–6 are marked as failed outcome. DATA PROCESSING All the iEEG data are resampled to 512 Hz, notch filtered at 60 Hz with a cut-off window of 2 Hz,
and band-pass-filtered between 0.5 Hz and the Nyquist frequency with a fourth-order Butterworth filter12. All markers from 30 s before the onset of seizure to the end are calculated by
discrete time windows. And these time windows are set differently for different markers. Specifically, the time window of neutral fragility is 250 ms with 125 ms as the moving step, while
that of other markers is 2.5 s with 500 ms as the step size12,32. Furthermore, in each time window, the calculation results of other markers except the related marks of feature vector
centrality are normalized, to improve the accuracy of the machine learning models used subsequently. CALCULATION OF 21 SOZ MARKERS Inspired by different epilepsy studies, the 21 markers in
this study include the newly proposed neural fragility, frequency domain analysis in traditional research, and degree and eigenvector centralities in graph theory. NEURAL FRAGILITY Neural
fragility is a positive indicator of how easily the brain is disturbed. The more easily the brain is disturbed, the higher the fragility. Recent research has demonstrated that neural
fragility is also a marker of the SOZ. Specifically, by disturbing the stable brain network and calculating the fragility changes in each node during the seizure using iEEG data, the SOZ of
the lesion can be located12,32. The connection model of the brain network adopts the idea of using linearity to fit nonlinearity, while a channel is considered as the sum of a portion of
neurons, and its form is as follows: $$\begin{array}{c}X\left(t+1\right)=\left(A+\Delta \right)X\left(t\right),\end{array}$$ (1) where \(X\left(t\right) \left(t\in {R}^{N}\right)\)
represents the dynamic state of the brain and corresponds to the iEEG data with all channels in a time window (250 ms), matrix \(A \left(A\in {R}^{N\times N}\right)\) represents the
steady-state connection of the brain, and N is the number of iEEG channels. Seizure indicates that the brain has entered an unstable state and is disturbed, and the fragility is expressed by
the model, which can be calculated using Eq. (2): $$\begin{array}{c}\widehat{\Delta }=\left[{B}^{T}{\left(B{B}^{T}\right)}^{-1}b\right]{e}_{j}^{T},\end{array}$$ (2) where, \(B\left(\sigma
,\omega ,j\right)={\left[Im\left\{{e}_{j}{\left(A-\left(\sigma +j\omega \right)I\right)}^{-T}\right\},Re\left\{{e}_{j}{\left(A-\left(\sigma +j\omega
\right)I\right)}^{-T}\right\}\right]}^{T}\), and normalization by \(\Delta =\left({\text{max}}\widehat{\Delta }-\widehat{\Delta }\right)/{\text{max}}\widehat{\Delta }\)12,32. Normalization
is to better measure the differences in fragility of different parts of the brain at the same time. 6 SPECTRAL-BASED FEATURES The frequency bands for brain waves are strict, and different
frequency bands correspond to different functional states of the brain. We divided the frequency bands into the following categorizations: Delta frequency band: 0.5–4 Hz; Theta frequency
band: 4–8 Hz; Alpha frequency band: 8–13 Hz; Beta frequency band: 13–30 Hz; Gamma frequency band: 30–90 Hz; High-gamma frequency band: > 90 Hz. Notably, HFOs are included in the
high-gamma frequency band. We apply a one-dimensional Fourier transform to convert the original EEG data into frequency signals. The Fourier transform is a linear integral transform, which
employs a sine wave to split the signal (Eq. 3): $$\begin{array}{c}F\left(u\right)={\int }_{-\infty }^{\infty }f\left(x\right){e}^{-2\pi uxi}dx.\end{array}$$ (3) Under the frequency signal,
we consider the average value of each electrode as the spectral-based features in different time windows and then normalize them (Eq. 4). This normalization method is employed to prepare an
electrode with a larger value that becomes a part of SOZ and an isotropic agent with the significance of other markers.
$$\begin{array}{c}F\left(u\right)=\frac{F\left(u\right)-{\text{min}}F\left(u\right)}{{\text{max}}F\left(u\right)-{\text{min}}F\left(u\right)}.\end{array}$$ (4) CORRELATION COEFFICIENTS AND
COHERENCE The correlation coefficients and coherence are calculated as the Eq. (5), respectively. And they are calculated separately within each frequency band. In the Eq. (5), (i, j) is the
channel number, \(Cov\) means calculating covariance, G means calculating cross spectral density16,33.
$$\begin{array}{l}\left\{\begin{array}{l}{Corr}_{ij}=\frac{Cov\left({x}_{i},{x}_{j}\right)}{{\sigma }_{{x}_{i}}{\sigma }_{{x}_{j}}}\\
{Coh}_{ij}\left(f\right)=\frac{{\left|{G}_{ij}\left(f\right)\right|}^{2}}{{G}_{ii}\left(f\right){G}_{jj}\left(f\right)}\end{array}\right..\end{array}$$ (5) DEGREE CENTRALITY AND EIGENVECTOR
CENTRALITY Centrality measures the importance of a node in a complex graph network. Both of degree centrality and eigenvector centrality have demonstrated good performance in epilepsy
localization, and they are calculated as the Eq. (6), respectively15,17. $$\begin{array}{l}\left\{\begin{array}{l}{DC}_{i}=\frac{\sum_{j=1}^{{N}_{i}}{x}_{ij}}{{N}_{i}-1}\\
{EVC}_{k}\left(i\right)=\frac{1}{\lambda \left(k\right)}\sum_{j}{\overline{Coh} }_{ij}\left(k\right)\cdot {EVC}_{k}\left(j\right)\end{array}.\right.\end{array}$$ (6) FEATURE EXTRACTION Each
marker first needs to undergo feature extraction to use it as an input for the model and is represented as a two-dimensional data matrix consisting of time and electrode channels. To
facilitate feeding the features into machine learning models, we perform dimension reduction by the following two steps. First, to extract 20 quantiles, we regard the surgical resection area
marked in the dataset as SOZ and the remaining as SOZc. We accumulate the marker values of the SOZ and SOZc channels in each time dimension and then extract 10 quantiles of each channel in
the time sequence respectively to obtain 20 values (the first 10 are SOZ and the last 10 are SOZc)12. Secondly, for the principal component analysis. We obtain the principal components from
20 values using 85% as the threshold of cumulative contribution rate. In this way, we have achieved dimensionality reduction for each marker. To construct hybrid SOZ markers, we combine the
seven selected outstanding markers as the input of machine learning models. If these markers are directly merged, it will generate too many features, so we perform Lasso regression to select
the important variables whose coefficients are non-zero as the model inputs. Lasso regression introduces an L1 regularization penalty term into the loss function as follows,
$$\begin{array}{c}Loss\left(\omega \right)=\sum_{i=1}^{N}{\left({y}_{i}-{\omega }^{T}{x}_{i}\right)}^{2}+\lambda {\Vert \omega \Vert }_{1} ,\end{array}$$ (7) where \(\omega\) represents the
weight coefficients of each feature. Under this framework, it updates the weight coefficients of some features to zero in the linear regression process, thereby achieving the goal of feature
selection. GENETIC NEURAL NETWORK In this study, a genetic algorithm is applied to optimize the weight of the neural network instead of the back propagation (BP) algorithm of the
traditional network. In the traditional BP algorithm training, the algorithm gradually adjusts weights along the direction of local improvement, resulting in the problem of local minima.
This issue is avoided using a genetic algorithm based on biological evolution to initialize the neural network with several groups of different weights and to jump out of the local minima
with a certain probability. This genetic algorithm is more likely to approach the global optimal solution19. Specifically, we apply this algorithm to train the weights between the layers of
the single hidden layer neural network. We set the individuals of the population in the genetic algorithm as the weights of the neural network and defined the fitness function as
\(fitness={\text{max}}\left\{{MSE}_{train},{MSE}_{test}\right\}\), where \({MSE}_{train}\) and \({MSE}_{test}\) denote the mean square error on the training and test sets, respectively. Its
main application process is explained as follows and the training process is depicted as a flowchart in Supplementary Fig. 1. MAINSTREAM MACHINE-LEARNING MODELS The other six
machine-learning models include logistic classification, decision tree, neural network, support vector machine, naive bayes model, and neighborhood algorithm. These six algorithms are all
implemented by Python’s SK-learn34. The training of each model is divided into the training set (70%), the test set (10%) and the verification set (20%, it can also be called lock-box set).
In the training set, 20% cross-validation and weight adjustment of the loss function are employed to prevent over-fitting. After training, the accuracy of the model is calculated in the
training-test and verification sets. All 147 combined models are trained 10 times, and the training-test sets are re-divided for each training session and the verification set is fixed.
Finally, the average accuracy of the model in the training-test set and the average accuracy in the verification set are calculated. The training mode of the hybrid feature model is the same
as above. STATISTICS ANALYSIS McNemar’s test is employed to compare the surgical prediction accuracy among these models. This test is particularly suitable for comparing the performance of
models using the same dataset26. Delong’s test is used to assess the significance of the ROC curve. This test helps determine whether there are significant differences in the performance of
the models based on the ROC curve analysis27. Furthermore, the Mann–Whitney U test investigates whether there is any influence of gender and dominant hand on the prediction ability of the
model. This test allows us to determine if there are any statistically significant differences in the model’s performance based on these factors28. A significance level of P < 0.05 is
considered to indicate statistical significance. All the statistical analyses are conducted using Python version 3.9. DATA AVAILABILITY We obtained data from publicly available databases
openneuro.org. The datasets are provided Lohith G and Adam Li groups respectively (ds004100 (https://openneuro.org/datasets/ds004100) and ds003029 (https://openneuro.org/datasets/ds003029)).
The use of the database adhered to the terms of service and ethical guidelines set forth by the database providers. The data were anonymized and handled in accordance with privacy
protection protocols. We express our gratitude to the data contributors and database maintainers for making their data publicly accessible, enabling our research. REFERENCES * Thijs, R. D.,
Surges, R., O’Brien, T. J. & Sander, J. W. Epilepsy in adults. _Lancet_ 393, 689–701. https://doi.org/10.1016/S0140-6736(18)32596-0 (2019). Article PubMed Google Scholar * Cascino, G.
D. Improving quality of life with epilepsy surgery: The seizure outcome is the key to success. _Neurology_ 68, 1967–1968. https://doi.org/10.1212/01.wnl.0000268067.70492.8b (2007). Article
PubMed Google Scholar * Engel, J. Jr. _et al._ Early surgical therapy for drug-resistant temporal lobe epilepsy: A randomized trial. _JAMA_ 307, 922–930.
https://doi.org/10.1001/jama.2012.220 (2012). Article CAS PubMed PubMed Central Google Scholar * Jehi, L. The epileptogenic zone: Concept and definition. _Epilepsy Curr._ 18, 12 (2018).
Article PubMed PubMed Central Google Scholar * Kuzan-Fischer, C. M., Parker, W. E., Schwartz, T. H. & Hoffman, C. E. Challenges of epilepsy surgery. _World Neurosurg._ 139, 762–774.
https://doi.org/10.1016/j.wneu.2020.03.032 (2020). Article PubMed Google Scholar * Jacobs, J. _et al._ Interictal high-frequency oscillations (80–500 Hz) are an indicator of seizure
onset areas independent of spikes in the human epileptic brain. _Epilepsia_ 49, 1893–1907. https://doi.org/10.1111/j.1528-1167.2008.01656.x (2008). Article PubMed PubMed Central Google
Scholar * Guragain, H. _et al._ Spatial variation in high-frequency oscillation rates and amplitudes in intracranial EEG. _Neurology_ 90, e639–e646.
https://doi.org/10.1212/WNL.0000000000004998 (2018). Article PubMed PubMed Central Google Scholar * Gonzalez Otarula, K. A., von Ellenrieder, N., Cuello-Oderiz, C., Dubeau, F. &
Gotman, J. High-frequency oscillation networks and surgical outcome in adult focal epilepsy. _Ann. Neurol._ 85, 485–494. https://doi.org/10.1002/ana.25442 (2019). Article CAS PubMed
Google Scholar * Qi, L. _et al._ Identifying the epileptogenic zone with the relative strength of high-frequency oscillation: A stereoelectroencephalography study. _Front. Hum. Neurosci._
14, 186. https://doi.org/10.3389/fnhum.2020.00186 (2020). Article PubMed PubMed Central Google Scholar * Gunnarsdottir, K. M. _et al._ Source-sink connectivity: A novel interictal EEG
marker for seizure localization. _Brain_ 145, 3901–3915. https://doi.org/10.1093/brain/awac300 (2022). Article PubMed PubMed Central Google Scholar * Antony, A. R. _et al._ Functional
connectivity estimated from intracranial EEG predicts surgical outcome in intractable temporal lobe epilepsy. _PLoS ONE_ 8, e77916 (2013). Article ADS CAS PubMed PubMed Central Google
Scholar * Li, A. _et al._ Neural fragility as an EEG marker of the seizure onset zone. _Nat. Neurosci._ 24, 1465–1474. https://doi.org/10.1038/s41593-021-00901-w (2021). Article CAS
PubMed PubMed Central Google Scholar * Wilke, C., Worrell, G. & He, B. Graph analysis of epileptogenic networks in human partial epilepsy. _Epilepsia_ 52, 84–93.
https://doi.org/10.1111/j.1528-1167.2010.02785.x (2011). Article PubMed Google Scholar * Ren, Y. _et al._ Transient seizure onset network for localization of epileptogenic zone: Effective
connectivity and graph theory-based analyses of ECoG data in temporal lobe epilepsy. _J. Neurol._ 266, 844–859. https://doi.org/10.1007/s00415-019-09204-4 (2019). Article PubMed Google
Scholar * Supriya, S., Siuly, S., Wang, H. & Zhang, Y. Epilepsy detection from EEG using complex network techniques: A review. _IEEE Rev. Biomed. Eng._
https://doi.org/10.1109/RBME.2021.3055956 (2021). Article Google Scholar * Burns, S. P. _et al._ Network dynamics of the brain and influence of the epileptic seizure onset zone. _Proc.
Natl. Acad. Sci. U.S.A._ 111, E5321-5330. https://doi.org/10.1073/pnas.1401752111 (2014). Article CAS PubMed PubMed Central Google Scholar * Li, A. _et al._ Using network analysis to
localize the epileptogenic zone from invasive EEG recordings in intractable focal epilepsy. _Netw. Neurosci._ 2, 218–240. https://doi.org/10.1162/netn_a_00043 (2018). Article PubMed PubMed
Central Google Scholar * Spring, A. M., Pittman, D. J., Bessemer, R. & Federico, P. Graph index complexity as a novel surrogate marker of high frequency oscillations in delineating
the seizure onset zone. _Clin. Neurophysiol._ 131, 78–87. https://doi.org/10.1016/j.clinph.2019.09.019 (2020). Article PubMed Google Scholar * Pijackova, K. _et al._ Genetic algorithm
designed for optimization of neural network architectures for intracranial EEG recordings analysis. _J. Neural Eng._ 20, 036034 (2023). Article ADS Google Scholar * Asano, E., Juhasz, C.,
Shah, A., Sood, S. & Chugani, H. T. Role of subdural electrocorticography in prediction of long-term seizure outcome in epilepsy surgery. _Brain_ 132, 1038–1047.
https://doi.org/10.1093/brain/awp025 (2009). Article PubMed PubMed Central Google Scholar * Elahian, B., Yeasin, M., Mudigoudar, B., Wheless, J. W. & Babajani-Feremi, A. Identifying
seizure onset zone from electrocorticographic recordings: A machine learning approach based on phase locking value. _Seizure_ 51, 35–42. https://doi.org/10.1016/j.seizure.2017.07.010 (2017).
Article PubMed Google Scholar * Tomlinson, S. B., Porter, B. E. & Marsh, E. D. Interictal network synchrony and local heterogeneity predict epilepsy surgery outcome among pediatric
patients. _Epilepsia_ 58, 402–411. https://doi.org/10.1111/epi.13657 (2017). Article PubMed Google Scholar * Varatharajah, Y. _et al._ Integrating artificial intelligence with real-time
intracranial EEG monitoring to automate interictal identification of seizure onset zones in focal epilepsy. _J. Neural Eng._ 15, 046035 (2018). Article ADS PubMed PubMed Central Google
Scholar * Van Mierlo, P., Vorderwulbecke, B. J., Staljanssens, W., Seeck, M. & Vulliemoz, S. Ictal EEG source localization in focal epilepsy: Review and future perspectives. _Clin.
Neurophysiol._ 131, 2600–2616. https://doi.org/10.1016/j.clinph.2020.08.001 (2020). Article PubMed Google Scholar * Paszke, A. _et al._ Pytorch: An imperative style, high-performance deep
learning library. _Adv. Neural Inf. Process. Syst._ 32, 1 (2019). Google Scholar * McNemar, Q. Note on the sampling error of the difference between correlated proportions or percentages.
_Psychometrika_ 12, 153–157 (1947). Article CAS PubMed Google Scholar * DeLong, E. R., DeLong, D. M. & Clarke-Pearson, D. L. Comparing the areas under two or more correlated receiver
operating characteristic curves: A nonparametric approach. _Biometrics_ 44, 837–845. https://doi.org/10.2307/2531595 (1988). Article CAS PubMed Google Scholar * Mann, H. B. &
Whitney, D. R. On a test of whether one of two random variables is stochastically larger than the other. _Ann. Math. Stat._ 18, 50–60 (1947). Article MathSciNet Google Scholar *
Cimbalnik, J. _et al._ Multi-feature localization of epileptic foci from interictal, intracranial EEG. _Clin. Neurophysiol._ 130, 1945–1953. https://doi.org/10.1016/j.clinph.2019.07.024
(2019). Article PubMed PubMed Central Google Scholar * Tomita, T. M. _et al._ Sparse projection oblique randomer forests. _J. Mach. Learn. Res._ 21, 4193–4231 (2020). MathSciNet Google
Scholar * Kini, L. G. _et al._ Virtual resection predicts surgical outcome for drug-resistant epilepsy. _Brain_ 142, 3892–3905. https://doi.org/10.1093/brain/awz303 (2019). Article PubMed
PubMed Central Google Scholar * Adam Li, M. _et al_. Fragility in epileptic networks: The epileptogenic zone. In _American Control Conference_ (2017). * Yaffe, R. B. _et al._ Physiology
of functional and effective networks in epilepsy. _Clin. Neurophysiol._ 126, 227–236 (2015). Article PubMed Google Scholar * Pedregosa, F. _et al._ Scikit-learn: Machine learning in
Python. _J. Mach. Learn. Res._ 12, 2825–2830 (2011). MathSciNet Google Scholar Download references ACKNOWLEDGEMENTS This work was jointly supported by the National Natural Science
Foundation of China (No. 82272112), Zhejiang Province general undergraduate universities “14th Five-Year” teaching reform project (No. jg20220300) and general project of teaching reform of
Zhejiang Chinese Medicine University (No. YB22020). FUNDING This work was supported by the STI2030-Major Projects (2022ZD0204600), the National Natural Science Foundation of China
(82272112), Zhejiang Province general undergraduate universities “14th Five-Year” teaching reform project (jg20220300) and general project of teaching reform of Zhejiang Chinese Medicine
University (YB22020). AUTHOR INFORMATION Author notes * These authors contributed equally: Lipeng Sun, Chen Feng and En Zhang. AUTHORS AND AFFILIATIONS * Second Clinical Medical School,
Zhejiang Chinese Medical University, Hangzhou, China Lipeng Sun * Department of Neurosurgery, School of Medicine, Second Affiliated Hospital, Zhejiang University, Hangzhou, China Chen Feng
& Junming Zhu * School of Medicine, Epilepsy Center, Second Affiliated Hospital, Zhejiang University, Hangzhou, China Chen Feng & Junming Zhu * IDG/McGovern Institute for Brain
Research, Beijing Normal University, Beijing, China En Zhang * State Key Laboratory of Cognitive Neuroscience and Learning, Faculty of Psychology, Beijing Normal University, Beijing, China
En Zhang * Department of Physical and Environmental Sciences, University of Toronto, Toronto, Canada Huan Chen * School of Pharmacy, Zhejiang Chinese Medical University, Hangzhou, China
Weifeng Jin * School of Basic Medical Sciences, Zhejiang Chinese Medical University, Hangzhou, China Li Yu * Qiushi Academy for Advanced Studies, Zhejiang University, Hangzhou, China Chen
Feng * Key Laboratory of Drug Safety Evaluation and Research of Zhejiang Province, Hangzhou Medical College, Hangzhou, China Li Yu Authors * Lipeng Sun View author publications You can also
search for this author inPubMed Google Scholar * Chen Feng View author publications You can also search for this author inPubMed Google Scholar * En Zhang View author publications You can
also search for this author inPubMed Google Scholar * Huan Chen View author publications You can also search for this author inPubMed Google Scholar * Weifeng Jin View author publications
You can also search for this author inPubMed Google Scholar * Junming Zhu View author publications You can also search for this author inPubMed Google Scholar * Li Yu View author
publications You can also search for this author inPubMed Google Scholar CONTRIBUTIONS Lipeng Sun and Chen Feng performed model training, data curation, and comparative study. En Zhang
participated in the interpretation and preprocessing of clinical data and the analysis of model results. Huan Chen and Weifeng Jin discussed the results concerning the clinical context.
Junming Zhu and Li Yu performed the model building, program writing and article editing. All authors reviewed the manuscript. CORRESPONDING AUTHORS Correspondence to Junming Zhu or Li Yu.
ETHICS DECLARATIONS COMPETING INTERESTS The authors declare no competing interests. ADDITIONAL INFORMATION PUBLISHER'S NOTE Springer Nature remains neutral with regard to jurisdictional
claims in published maps and institutional affiliations. SUPPLEMENTARY INFORMATION SUPPLEMENTARY INFORMATION. RIGHTS AND PERMISSIONS OPEN ACCESS This article is licensed under a Creative
Commons Attribution 4.0 International License, which permits use, sharing, adaptation, distribution and reproduction in any medium or format, as long as you give appropriate credit to the
original author(s) and the source, provide a link to the Creative Commons licence, and indicate if changes were made. The images or other third party material in this article are included in
the article's Creative Commons licence, unless indicated otherwise in a credit line to the material. If material is not included in the article's Creative Commons licence and your
intended use is not permitted by statutory regulation or exceeds the permitted use, you will need to obtain permission directly from the copyright holder. To view a copy of this licence,
visit http://creativecommons.org/licenses/by/4.0/. Reprints and permissions ABOUT THIS ARTICLE CITE THIS ARTICLE Sun, L., Feng, C., Zhang, E. _et al._ High-performance prediction of epilepsy
surgical outcomes based on the genetic neural networks and hybrid iEEG marker. _Sci Rep_ 14, 6198 (2024). https://doi.org/10.1038/s41598-024-56827-3 Download citation * Received: 05
February 2024 * Accepted: 12 March 2024 * Published: 14 March 2024 * DOI: https://doi.org/10.1038/s41598-024-56827-3 SHARE THIS ARTICLE Anyone you share the following link with will be able
to read this content: Get shareable link Sorry, a shareable link is not currently available for this article. Copy to clipboard Provided by the Springer Nature SharedIt content-sharing
initiative KEYWORDS * Genetic neural network * Surgical outcome prediction * Seizure onset zone * Hybrid marker * Model comparison