- Select a language for the TTS:
- UK English Female
- UK English Male
- US English Female
- US English Male
- Australian Female
- Australian Male
- Language selected: (auto detect) - EN
Play all audios:
ABSTRACT While residential segregation is a persistent attribute of metropolitan areas, recent studies find segregation levels fluctuate throughout the day, reaching their lowest levels
during daytime hours. This paper shows hourly variations in Black-White segregation from Monday through Sunday for the top 49 most populated metropolitan areas with Global Positioning System
(GPS) data collected from mobile phones from October 2018. I find that segregation levels are higher on average over weekends compared to that of weekdays. I use models to identify the
characteristics of neighborhoods with higher levels of segregation on weekends, which include all demographic variables and nearly a third of 35 sectors of businesses and organizations, such
as retail, personal care, and religious organizations. I also find more than a third of the sectors are associated with higher levels of segregation during business hours on weekdays,
including academic institutions, health care, manufacturing, and financial institutions. Findings from this paper display the significance in the distinction between weekdays and weekends
with where people spend their time and how this relates to racial segregation. Specifically, Black people, on average, stay in their home census tracts and visit non-White neighborhoods for
organizational resources more so than White people. Significant patterns of associations between racial segregation and the majority of businesses demonstrate the salience of race for more
industries than previously understood. SIMILAR CONTENT BEING VIEWED BY OTHERS HUMAN MOBILITY PATTERNS ARE ASSOCIATED WITH EXPERIENCED PARTISAN SEGREGATION IN US METROPOLITAN AREAS Article
Open access 16 June 2023 AN EXPERIENCED RACIAL-ETHNIC DIVERSITY DATASET IN THE UNITED STATES USING HUMAN MOBILITY DATA Article Open access 17 June 2024 EXPLAINING CHANGES IN US RESIDENTIAL
SEGREGATION THROUGH PATTERNS OF POPULATION CHANGE Article 09 February 2024 INTRODUCTION Racial residential segregation has been described as the structural linchpin through which racial
stratification persists in America1,2. Racial segregation has been found to perpetuate disadvantages among racial minorities, which encompass higher rates of poverty3,4, poorer educational
outcomes5,6, political marginalization7, racial hostility8, greater exposure to crime9,10, and poorer health outcomes11,12. This study specifically focuses on Black-White segregation because
it is most severe compared to other forms of racial segregation13. While Black-White residential segregation has declined across many decades14, as of 2010, one third of Black people live
in hypersegregated metropolitan areas15. Scholars have studied racial segregation in a variety of contexts, such as schools and workplaces, to understand whether segregation levels as
measured by residential neighborhoods reflect the segregation levels people experience. Global positioning system (GPS) data has made it possible to measure segregation levels of a wider
variety of places, including restaurants, outdoor spaces, museums, and pharmacies16,17,18. These studies find that while people spend time in less segregated spaces compared to that of
residential neighborhoods, one’s race, income, and political affiliations are found to be correlated with where they travel to for everyday activities16,17,18,19,20,21. This study builds on
prior work by demonstrating how racial segregation is associated with a comprehensive list of industries that people visit for not only leisure, but also for work to demonstrate the salience
of race in the local spaces in which businesses are embedded. Recent studies also show temporal variation in segregation levels. With mobile phone location data, Athey et al.17 show hourly
trends throughout an average, 24-h day and find that racial segregation, between Whites and Non-Whites, is lower during the day than in the evening, which can be attributed to the high
volume of travel people make in large metropolitan areas22. This study expands on prior work by showing how hourly trends differ throughout a 7-day week to examine how segregation levels
change from weekdays to weekends and whether differences are found during daytime hours when travel is more frequent. The distinction between weekdays and weekends is important for several
reasons. First, changes in hours dedicated for work may contribute to dissimilar segregation trends between weekdays and weekends. According to the American Time Use Survey (ATUS), in 2018,
54.2% of the population worked on an average weekday, while 20.4% of the population worked on an average weekend. The average number of worked hours is also remarkably less over weekends. In
addition, according to the Work Schedules and Work at Home survey, a special supplement to the Current Population Survey, more Black people take evening or night shifts, yet they work on
weekends at similar rates as White people23. Although declines in Black-White segregation between occupations and schools have stalled since the 1980s24,25,26, neighborhoods where people
work are less segregated than where people live27. Racial integration among employees are found in occupations with low average earnings with retail trade being the most integrated
sector25,28. Hence, segregation levels are expected to be lower on weekdays due to longer hours spent for work and greater racial diversity in the neighborhoods where people work. Second,
changes in hours dedicated for leisure is another factor that could contribute to dissimilar segregation trends between weekdays and weekends. The ATUS reports more time is spent
socializing, participating in recreational activities, and housework on weekends. While less is known about differences in how Black and White people spend their weekends, prior work
suggests differences in how leisure time is spent by race. For example, White people have been found to be more physically active during leisure time29,30, as well as visit museums and
performances, and attend extracurricular and cultural classes more frequently than Black people31,32. Given these findings, segregation levels could increase on days with more leisure time,
as on weekends. Third, distinguishing weekdays from weekends in addition to distinguishing hours in which businesses, in general, are open and closed, is important to consider when
estimating segregation levels by place. Leisure and hospitality, wholesale and retail trade, and transportation and utilities are the only sectors where more than 20% of its wage and salary
workers have alternate-shift schedules, which includes working evenings and weekends23. Lower percentages of alternate-shift schedules suggest limited business hours beyond 9 AM to 5 PM,
Monday through Friday. Hence, comparisons in associations by weekdays and weekends during daytime hours can demonstrate how businesses contribute to the racial segregation of their local
environments. Taken together, this study makes three important contributions. First, I build on prior work by showing how Black-White segregation fluctuates across the week, with a focus on
how levels change between weekdays and weekends. Second, I demonstrate how these fluctuations are attributable to businesses by narrowing in on the days and hours when businesses are most
active. Third, I describe whether differences in segregation levels are attributed to the presence of Black or White people, and whether specific categories of census tracts, as classified
by percentages of Black or White residents, contribute more towards hourly racial segregation. DATA MOBILE PHONE LOCATION DATA I use proprietary, anonymized mobile phone location data sold
by Fysical Labs from October 2018 for the 49 most populous metropolitan areas in the US. Data points were generated whenever devices move 100 m, stop moving for 5 min, or detect an iBeacon.
Data were collected from several dozen applications that use location services, such as weather, navigation and social media. These conditions generate unweighted, panel data that include
unique IDs for mobile phones, and longitudes and latitudes of the locations mobile phones are found. The data include 15,037,449 unique devices. More details on the sample can be found in
Sections B and C of the Appendix. ADDITIONAL DATA SOURCES I use three sources of data to examine the characteristics of census tracts that contribute more towards Black-White segregation. I
use the 2018 American Community Survey (ACS) in two ways. First, I use data by census block groups to impute demographic information for mobile phone owners. Second, I use data by census
tracts to compute residential levels, with which I use to compare hourly segregation scores, and for models that include percentages of Black and White residents, population sizes, and
median household income as control variables. I use the 2018 Historical Business data from Data Axle, which provide information on the types of organizations and businesses that are present
by various spatial units, including census tracts, but does not provide details on operational hours or the demographic distribution of clientele, which would be necessary for further causal
analysis on the relationship between businesses and racial segregation. I include all the industries as identified by the North American Industry Classification System (NAICS), such that I
can identify associations between industries and racial segregation net of all other industries present. While I preserve 15 of the sectors, I subdivide 8 sectors into 20 different
categories to account for categorizations in prior studies, greater internal coherence within categories, and separation between industries with and without indoor facilities. A
comprehensive table on how NAICS industries are categorized into sectors can be found in Section F of the Appendix. For example, I divided Arts, Entertainment, and Recreation into three
categories: culture, which includes museums, libraries, ballet, and other venues for the arts33,34,35,36,37,38; recreation, which includes sports venues, zoos, and casinos; and other
culture, which includes organizations that support the arts, such as agents and managers and promoters without facilities. I use data on national transit stops provided by the US Department
of Transportation. Data from the US Department of Transportation does not include information for Louisville, KY; New Orleans, LA; and San Antonio, TX. Regression results presented in this
paper control for public transportation stops, and thereby exclude these cities. Results that include these three cities and exclude transportation stops as a control variable are provided
in Section H of the Appendix. These results have insignificant differences between the results that exclude the three cities and include public transportation stops as a control variable.
METHODS CLUSTERING DATA To reduce the data to locations where people stopped, I cluster the data using density-based spatial clustering of applications with noise (DBSCAN*) for every date
and hour in October 201822. I assume a person visited a location if they had at least four data points for that date and hour that are within 0.0001\(^{\circ }\) from each other, and assume
the center of the four or more data points as the location in which a person visited. More details on how I chose the parameters used for DBSCAN* clustering can be found in Section A of the
Appendix. After clustering the data for every date and hour of October 2018, I combined the data that are generated for the same day of the week and hour of day for subsequent analyses.
Since the data are not generated continuously, I cannot be certain of how long someone visited a location, and consequently, I compute segregation scores based on the clusters that are found
within each hour. IMPUTING DEMOGRAPHIC CHARACTERISTICS Because the mobile phone data are anonymized, I impute the race of mobile phone owners. To do so, I first identify the most frequently
visited census block group for every mobile phone owner and assume that is their home block group. I use home locations by census block groups because they are the smallest geographic unit
for which the ACS 2018 provides residential racial demographic information, which is necessary for my imputation strategy. For devices that have multiple home block groups that are tied for
most frequent appearances, I randomly select one of the block groups as the home block group. Other studies assume home locations by using people’s travel patterns in the evening16,18,22.
Findings that use evening travel patterns to infer home locations can be found in Section D of the Appendix. I defer to using the most frequently visited block groups across all hours as the
home block group because this definition includes more unique devices with 15,037,449 devices, as opposed to 9,669,155. I find that even when assuming the most frequently visited census
block group as the home block group, the largest proportions of people are found in their home census tracts between 12 and 4 AM. At minimum, 99.1% of the residential block groups among all
49 metropolitan areas have at least one person in the sample. The median proportion of the population of residents of a block group included in the sample is 6.8%. I use the demographic
distribution of the race of residents by census block group to impute race. Specifically, with the 2018 ACS for every block group, I compute the proportions of residents by eight categories
of race, including American Indian and Alaska Native, Asian, Black, Hispanic, Native Hawaiian and other Pacific Islander, White, two or more races, and other races. I use these proportions
as probabilities of a multinomial distribution to impute race for every mobile phone owner. I repeat this process 100 times and use these imputations to compute 100 Black-White dissimilarity
scores for every CBSA for every hour from Monday through Sunday, which generate distributions of estimates. I use these imputations to generate distributions of estimates in subsequent
analyses. Imputation is affected by how representative the data are of metropolitan areas, which is discussed at length in Section C of the Appendix. ESTIMATING 7-DAY BLACK-WHITE
DISSIMILARITY I use the Black-White Dissimilarity Index, which shows how evenly distributed two groups are within a space as my measure of racial segregation39. If all subunits have the same
proportions of the two racial groups within a larger geographic area, evenness is maximized. While I compute Black-White Dissimilarity scores for metropolitan areas with census tracts as
the subunit, I assign weights to every individual by census block group to account for uneven sampling. I use weights by census block groups to increase precision, as smaller geographic
units for weighting will increase precision. Census block groups have population sizes between 600 and 3000 people, while census tracts have between 1200 and 8000 people40. For individual
_i_, who lives in block group _b_, their weight \(w_{i}\) is equal to \(\frac{S_{bi}}{s_{bi}}\), where \({S_{bi}}\) is the population size of the block group according to the 2018 ACS, and
\(s_{bi}\) is the sample size of the block group. Black-White Dissimilarity in its weighted form _D_ for hour _v_ in metropolitan area _j_ with _n_ number of census tracts and imputation _t_
is defined as: $$\begin{aligned} D_{jtv} = \frac{1}{2} \sum _{a=1}^{n} \Bigg | \frac{\sum _{i=1}^{f_{atv}}w_{aitv}}{F_{jtv}} - \frac{\sum _{i=1}^{g_{atv}}w_{aitv}}{G_{jtv}} \Bigg |
\end{aligned}$$ (1) where _i_ is an index for individuals; \(f_{atv}\), the number of White people within census tract _a_ for imputation _t_ at hour _v_; \(g_{atv}\), the number of Black
people in census tract _a_ for imputation _t_ at hour _v_; \(F_{jtv}\), the sum of weights for all White residents of metropolitan area _j_ for imputation _t_ at hour _v_; and \(G_{jtv}\),
the sum of the weights for all Black residents of metropolitan area _j_ for imputation _t_ at hour _v_. To compare how hourly Black-White Dissimilarity scores compare with residential
segregation levels, I present ratios between the two with 95% confidence intervals with standard errors of hourly segregation levels throughout the week by metropolitan area. Ratios greater
than 1 suggests hourly segregation levels are higher than residential levels, and below 1 suggests they are lower. Results that are unweighted, and that use home location by nighttime travel
can be found in the Appendix. EXPLAINING PATTERNS IN 7-DAY BLACK-WHITE DISSIMILARITY Through modeling, I investigate which businesses, racial groups, and categories of census tracts
contribute to lower levels of Black-White segregation. I compute models separately for every hour of the day because data points from one hour are likely to be correlated with data from the
hour prior at minimum. Yet, instead of computing the same model 168 times for every hour of the week, I compute 24 with data that are combined across 7 days for the same hour so that I can
include interaction effects between independent variables and an indicator variable for whether the day is part of the weekday or weekend. These interactions are used to gauge which
independent variables have different associations between weekdays and weekends. As independent variables, I include counts of businesses in 35 sectors, and 6 variables that account for
demographic characteristics, number of public transportation stops, and proportions of residents who are home. I standardize all variables by metropolitan area, to identify average,
within-group associations between the outcome and independent variables. I focus on within-group associations to determine the characteristics of census tracts with stronger associations
with Black-White segregation, as opposed to differences between metropolitan areas. Standard errors are also clustered by metropolitan area. I run separate models with estimates derived from
every imputation of race, and pool coefficients and standard errors with Rubin’s Rule41. In sum, models for hour _v_, census tract _a_ in metropolitan area _j_, and imputation _t_, are
defined as: $$\begin{aligned}{} & {} \begin{aligned} \tilde{y}_{ajtv} =&\beta _{0}+\beta _{1}{day}+\sum _{k=2}^{42} \left[ \beta _{k}\tilde{x}_{akj}+\beta
_{k+43}\tilde{x}_{akj}*{day} \right] \end{aligned} \end{aligned}$$ (2) $$\begin{aligned}{} & {} \tilde{x}_{akj}=\frac{x_{ak}-\bar{x}_{kj}}{s_{kj}} \end{aligned}$$ (3) where \(s_{kj}\) is
the standard deviation of variable _k_ for metropolitan area _j_, and \(\bar{x}_{kj}\) is the average of variable _k_ in metropolitan area _j_. I also compute models with three-way
interactions among scaled independent variables, an indicator variable for weekend or weekday, and a factor variable, which categorizes census tracts by those in the top 25th percentile for
the proportion of Black residents or White residents by metropolitan area. All remaining census tracts are included in the “Middle 50%” category. With the three-way interaction, I gauge
which subsets of census tracts have stronger associations with the outcome of interest. The equation is: $$\begin{aligned} \begin{aligned} \tilde{y}_{ajtv} =&\beta _{0}+\beta
_{1}{day}+\sum _{k=2}^{42} \left[ \beta _{k}\tilde{x}_{akj}+\beta _{k+43}\tilde{x}_{akj}*{race} \right. \\&\left. +\beta _{k+86}\tilde{x}_{akj}*{day}+\beta
_{k+129}\tilde{x}_{akj}*{day}*{race} \right] \end{aligned} \end{aligned}$$ (4) I use Eqs. (2) and (4) with three different outcome variables. The first outcome aims to identify the
characteristics of tracts that contribute to higher Black-White segregation levels over the weekend. To this end, I use the census tract’s contribution to the metropolitan area’s Black-White
Dissimilarity score as the outcome variable, and standardize it by metropolitan areas. The equation is as follows: $$\begin{aligned} \tilde{y}_{ajtv}=\frac{ \left( \Big |\frac{\sum
_{i=1}^{f_{atv}}w_{aitv}}{F_{jtv}} -\frac{\sum _{i=1}^{g_{atv}}w_{aitv}}{G_{jtv}} \Big | \right) - \bar{y}_{jtv}}{s_{jtv}} \end{aligned}$$ (5) The second outcome variable is the proportion
of Black people within a census tract relative to that of the metropolitan area for a given hour to gauge whether changes in proportions of Black people contribute to variations in
Black-White segregation. These proportions are also standardized by metropolitan area and are defined as: $$\begin{aligned} \tilde{y}_{ajtv}=\frac{ \left( \Big |\frac{\sum
_{i=1}^{g_{atv}}w_{aitv}}{G_{jtv}} \Big | \right) - \bar{y}_{jtv}}{s_{jtv}} \end{aligned}$$ (6) The third outcome variable is the standardized proportion of White people within a census
tract relative to that of the metropolitan area for a given hour to gauge whether changes in proportions of White people contribute to fluctuations in segregation. It is defined as:
$$\begin{aligned} \tilde{y}_{ajtv}=\frac{ \left( \Big |\frac{\sum _{i=1}^{f_{atv}}w_{aitv}}{F_{jtv}} \Big | \right) - \bar{y}_{jtv}}{s_{jtv}} \end{aligned}$$ (7) For models with two-way
interactions, I compare coefficients for independent variables between weekdays and weekends. If \(\beta _{k}\) is the coefficient for variable _k_ during weekdays, and \(\beta _{kw}\) is
the interaction term for variable _k_ and an indicator variable _w_ for weekends, I compare \(\beta _{k}\) with \(\beta _{k}+\beta _{kw}\) in all related figures of coefficients. For models
with three-way interactions, I compare coefficients for weekdays and weekends among three categories of census tracts. For variable _k_ and census tracts in racial category _d_, I compare
\(\beta _{k}\) + \(\beta _{kd}\) with \(\beta _{k}\) + \(\beta _{kd}\) + \(\beta _{kw}\) + \(\beta _{kwd}\), where \(\beta _{k}\) is the coefficient for variable _k_ during weekdays for the
reference group among the three categories of census tracts; \(\beta _{kw}\) is the interaction term for variable _k_ and weekends for the reference group among the three categories of
census tracts; \(\beta _{kd}\) is the interaction term for variable _k_ on weekdays for racial category _d_; and \(\beta _{kdw}\) is the interaction term for variable _k_ on weekends for
racial category _d_. Select variables with noteworthy associations with Black-White segregation and large differences in their associations between weekdays and weekends are presented.
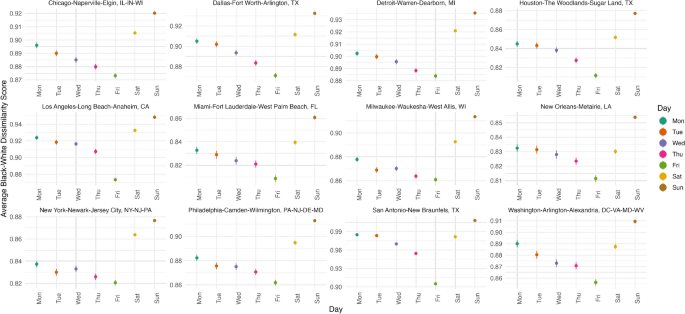
Individual coefficient plots for all independent variables are included in the Appendix. RESULTS BLACK-WHITE SEGREGATION IS HIGHER ON WEEKENDS Figure 1 shows the 95% confidence intervals
with standard errors of ratios between residential segregation and weighted, daily segregation for 12 metropolitan areas. A graph with all 49 metropolitan areas can be found in Section D of
the Appendix. All metropolitan areas have segregation levels on Sunday that are significantly larger than any other day of the week. Excluding New Orleans, LA; San Antonio, TX; and
Washington, DC, segregation levels are higher on Saturdays and Sundays for all other metropolitan areas. Also notable is that segregation levels decrease incrementally between Monday through
Friday, and on Friday, all metropolitan areas are most integrated. Figure 2 shows 95% confidence intervals with standard errors of the ratios between residential segregation and 100 imputed
Black-White Dissimilarity scores for the 10 most populous metropolitan areas, although standard errors are noticeably smaller relative to the means. Hourly fluctuations in Black-White
Dissimilarity corroborate the findings of Athey et al.17 for Monday through Friday, in which levels are lowest around 12PM, and are highest around 3AM. Figure 2 shows that higher daily
average segregation levels over weekends are driven by higher levels of segregation over daytime hours on weekends compared to that of weekdays. I also find that on Sundays, segregation
levels peak between 4 AM and 8 AM, as opposed to 12 AM and 4 AM, as is the case on weekdays. This difference signals differences in late evening travel patterns over weekends. Figure 3 shows
the 95% confidence intervals with standard errors of the proportion of people who traveled to their home census tracts for every hour of the week. Patterns are comparable with that of
Black-White Dissimilarity, with higher proportions of people being found in their home census tracts over the weekend during daytime hours. Black-White Dissimilarity Scores reach their peak
when the largest proportions of visits are to people’s home census tracts. Section E of the Appendix has additional analysis of how the demographic characteristics of residents and time are
associated with proportions of visits to home census tracts by hour. I find that proportions of Black residents have a larger association than proportions of White residents, which shows
that residents of predominantly Black neighborhoods stay within their neighborhoods at higher rates than residents of predominantly White neighborhoods. I also find interaction effects
between hour of day and an indicator variable for the weekend are almost always significantly positive, which shows that people stay within their home neighborhoods at higher rates on
weekends. GEOGRAPHIC HETEROGENEITY IS OBSERVED IN THE COUNTS AND CONTRIBUTIONS TO BLACK-WHITE SEGREGATION BY NEIGHBORHOODS WITH DIFFERENT INDUSTRIES Figures 4 and 5 show geographic
heterogeneity of the distribution of businesses and the racial segregation of the neighborhoods, in which they are embedded. Metropolitan areas are listed according to their rank by
Black-White Dissimilarity scores based on the ACS 2018, such that Milwaukee, WI is the most segregated, and Las Vegas, NV is the least. Specifically, Fig. 4 shows the proportion of
businesses in a metropolitan area for a sample of industries. Several cities have larger proportions of businesses than the expected percentage of 2%. These cities include New York, NY;
Chicago, IL; Los Angeles, CA; Philadelphia, PA; Miami, FL; Boston, MA; Houston, TX; Washington, DC; and Dallas, TX. Given the concentration of businesses in the largest cities, subsequent
modeling strategies will standardize business counts by metropolitan area to isolate the average contribution of businesses within metropolitan areas, as opposed to capturing disparities
between metropolitan areas. Figure 5 shows the average contribution to the respective metropolitan area’s Black-White segregation among census tracts with different types of industries
between the hours of 8 AM and 8 PM from Monday through Friday. Surprisingly, greater racial segregation levels for the broader metropolitan area does not mean greater average contributions
to racial segregation among census tracts with different industries. While religious organizations and financial businesses have the highest average racial segregation by neighborhood for
most metropolitan areas, colleges and universities have the smallest averages. Whether these trends hold net of demographic characteristics by residents of neighborhoods and the presence of
other businesses is examined in the next section. A MAJORITY OF INDUSTRIES HAVE SIGNIFICANTLY DIFFERENT ASSOCIATIONS WITH BLACK-WHITE SEGREGATION BETWEEN WEEKDAYS AND WEEKENDS Figure 6 plots
coefficients that are derived from models that account for temporal heterogeneity by using two-way interaction terms to gauge how industries and the census tracts they are in contribute to
the metropolitan area’s overall Black-White segregation differently between weekdays and weekends. These models account for geographic heterogeneity by scaling variables by metropolitan
area. Figure 6a shows coefficients for all demographic characteristics included in the models, which have the strongest associations with Black-White segregation compared to categories of
businesses regardless of the day of the week. Specifically, among all 41 independent variables, proportions of Black residents have the largest associations with contributions to Black-White
Dissimilarity scores, followed by the population sizes of census tracts, and proportions of white residents, and median income. All demographic variables have significantly positive weekend
effects. The intercept, which represents the average contribution to the metropolitan area’s Black-White Dissimilarity score for census tracts with average levels of all the independent
variables, is higher on weekends than weekdays. Figure 6b shows coefficients for industries for weekdays and weekends net of residential demographics and other businesses and organizations.
Figure 6b showcases two groups of businesses: those that have larger associations with racial segregation over the weekend compared to associations over weekdays, and those that have larger
associations over weekdays. Figure 7 shows coefficients from three-way interaction models among industries, weekends, and categories of census tracts by percentage of Black or White
residents. Each row has different outcome variables, but the independent variables and interaction terms used in the models are identical. In general between 8 AM and 4 PM, while there are
industries that have significantly negative associations with proportions of Black people present, none of the industries have significantly negative associations with proportions of White
people. TEN INDUSTRIES, INCLUDING RETAIL, RECREATION, AND RELIGIOUS ORGANIZATIONS HAVE SIGNIFICANTLY GREATER ASSOCIATIONS WITH BLACK-WHITE SEGREGATION OVER WEEKENDS Although associations are
not as large as that of residential characteristics, there are notable relationships between businesses and Black-White segregation that contribute to elevated segregation levels over
weekends. Retail businesses, which include clothing, electronics, and jewelry stores have the largest association with Black-White segregation across all 35 categories of organizations, and
these numbers become significantly larger on weekends from the afternoon on wards. Other types of retail, including food and home retail, do not share this trend, and their coefficient plots
can be found in Section H of the Appendix. This finding is surprising given prior work that finds retail trade has the largest levels of racial integration among its employees, which
suggests that the higher segregation levels are driven in part by customers. Figure 7 shows that the associations between retail businesses and proportions of Black people are significantly
larger in census tracts with larger proportions of non-White residents. Recreation, including zoos and botanical gardens and casinos; restaurants and bars; religious organizations; and
personal care businesses, which includes beauty salons and laundry services, have significantly larger associations with Black-White segregation compared to that of weekdays. As shown in
Fig. 7, while recreation has a significantly positive association with proportions of White people across all census tract categories, recreation has a significantly negative association
with proportions of Black people in census tracts with the largest proportions of Black residents. Restaurants and bars also have a significantly positive association with proportions of
White people across all census tract categories without preference, yet with proportions of Black people as the outcome, restaurants and bars have significantly higher associations in census
tracts that have larger proportions of non-White residents. While not shown in Fig. 6b, accommodation, which includes hotels; construction; information, which includes radio stations, and
television broadcasting; professional, scientific, and technical services; other services, which include appliance repair and funeral homes, have several hours when segregation levels on
weekends are significantly higher than that of weekdays. TWELVE INDUSTRIES, INCLUDING FINANCE AND INSURANCE, COLLEGES AND UNIVERSITIES, AND HEALTH CARE, HAVE SIGNIFICANTLY GREATER
ASSOCIATIONS WITH BLACK-WHITE SEGREGATION ON WEEKDAYS Finance and insurance businesses have the largest association with Black-White segregation among all categories of institutions on
weekdays between 9 AM and 3 PM. As Fig. 7 shows, finance and insurance businesses are associated with average and below average proportions of Black people in all categories of census
tracts. Surprisingly, the coefficient is most negative for institutions in census tracts with the largest proportions of Black residents. Prior work reports that minority neighborhoods have
less access to banks than White neighborhoods42. In addition to lower supply, the fact that proportions of Black people are lowest even in census tracts in the 25th percentile for
proportions of Black residents suggests less demand for these services. Academic institutions are associated with higher contributions to Black-White segregation on weekdays, and
significantly smaller associations on weekends. After accounting for demographic variables and the presence of other businesses, colleges and universities have larger associations with
Black-White segregation than K-12 schools. This is a surprising finding, given that uncontrolled results from Fig. 2 show that neighborhoods with colleges and universities have the lowest
average contributions to several metropolitan areas’ overall Black-White Dissimilarity scores. Other industries in the educational sector, which includes driving and cosmetology schools,
have significantly negative associations with racial segregation, and do not have significant differences in associations between weekdays and weekends for most hours. Health care and
manufacturing sectors also have notable differences in their associations with segregation during weekdays and weekends. Health care has positive associations with Black-White segregation
that lasts from 7 AM to 5 PM on weekdays, and all three categories of census tracts have an increase in their associations. Meanwhile, manufacturing has positive associations between 8 AM
and 12 PM on weekdays, and census tracts in the top 25th percentile for proportions of White residents are the only category with significantly positive associations. Both sectors have
insignificant associations with racial segregation on weekends. Several other categories have significantly higher associations with Black-White segregation on weekdays compared to that of
weekends, but the difference is not as stark as the aforementioned sectors. They include public administration; social assistance; culture, which includes bookstores, libraries, and museums;
home retail; real estate; residential care; and wholesale trade. Their coefficient plots can be found in Section H of the Appendix. THIRTEEN INDUSTRIES, INCLUDING ACCOMMODATIONS AND
AGRICULTURE, DO NOT HAVE SIGNIFICANT WEEKEND INTERACTION EFFECTS Other accommodation, which include RV campgrounds; agriculture, forestry, fishing, and hunting; management companies; and
transportation and warehousing have significantly positive associations with racial segregation that are consistent between weekdays and weekends. Administrative, support, waste management,
and remediation services; other cultural businesses, which include promoters without facilities; other schools, which include driving and cosmetology schools have consistently and
significantly negative associations with racial segregation during daytime hours throughout the week. Several industries have insignificant associations with Black-White segregation during
daytime hours. They are: civil and social organizations; food retail; mining; other retail, which includes car dealers, and used merchandise stores; other restaurants and bars, which
includes catering and mobile food services; and utilities. DISCUSSION This study shows the pervasiveness of racial segregation, an unrelenting feature of American society that has been
typically studied in the context of residential neighborhoods and schools, and demonstrates its temporality throughout the week. Specifically, this study shows three main findings. First,
this study shows that the distinction between weekdays and weekends is important in terms of racial segregation, with racial segregation levels being higher over weekends than on weekdays
for all metropolitan areas. Hourly trends slightly shift, such that segregation levels are highest between 12 AM and 4 AM on weekdays, and between 4 AM and 8 AM on weekends, and are lowest
at later hours in the afternoon on weekends compared to weekdays. Hourly segregation levels during the daytime are also much higher on weekends compared to weekdays. These findings allude to
variances in racial segregation throughout the day and week, and raise questions on how periodic fluctuations in racial segregation affects racial dynamics. Second, elevated segregation
levels over the weekend can be attributed to larger proportions of people being home during the day, and relatedly, larger associations between Black-White segregation and residential
demographic characteristics over weekends. Proportions of Black residents have the largest associations net of the organizational landscape of census tracts. Moreover, proportions of Black
people are found to increase more notably in non-White neighborhoods, while proportions of White people increase at similar rates across all categories of census tracts. Hence, Black people
seem to travel to places with larger proportions of non-White residents for the majority of organizational resources. Third, most categories of businesses have associations with racial
segregation that differ between weekdays and weekends, and a large proportion has a significantly positive association with racial segregation during weekday, daytime hours. While much
attention has been given to racial segregation among K-12 schools, I find that financial institutions, retail, and colleges and universities have greater associations with Black-White
segregation than that of K-12 schools on weekdays. Additionally, for many categories of businesses, the racial distribution of the people who are present during business hours differs from
that of after business hours and over weekends, which suggests that the demographic makeup of daytime visitors, which include employees and customers, differ from that of residents. While
this study cannot definitively make causal claims due to data limitations, this study shows that race remains salient in the local environments when businesses are most active for a broader
range of sectors than previously understood. The dissimilar associations among organizations and Black-White segregation during daytime hours between weekdays and weekends show a strong
relationship exists. Several mechanisms could explain these trends. A large body of literature finds persistent racial discrimination of Black people as candidates for jobs, which means that
racially segregated employment opportunities could partially explain these associations43,44,45. Many studies also describe poor treatment of racial minorities in retail and consumer
markets in neighborhoods with predominantly White residents, which could deter racial minorities from spending time in spaces with larger proportions of White people46,47. Racial minorities
could also prefer to visit businesses and organizations with larger proportions of co-ethnic customers and members for social solidarity and availability of ethnic products48,49,50.
Alternatively, non-business related visitors, especially for businesses with publicly accessible spaces, could also have a role in promoting racial integration51. Prior studies identify the
benefits of ethnic diversity on innovation, influence, and profit52,53,54,55,56. Future studies can not only distinguish the roles of employees, customers, and passersby in the fluctuating
levels of racial segregation, but can also explore the effects of diversity of the broader spaces in which companies are embedded on company outcomes. Findings from this paper suggest that
racial segregation is not a feature isolated to residential neighborhoods and schools, and that businesses should consider ways to reduce racial segregation within their local surroundings
to collectively diminish the reaches of racial segregation and its role in perpetuating racial inequality. DATA AVAILIBILITY Code materials can be found at
https://github.com/jjc09/rhythms_week. Mobile phone location data from Fysical cannot be shared under a data-sharing agreement. 2018 Historical Business Data cannot be shared publicly, but
can be accessed through Wharton Data Research Services hosted by the University of Pennsylvania. The 2018 American Community Survey and data on national transit stops from the US Department
of Transportation are publicly available. REFERENCES * Pettigrew, T. F. Racial change and social policy. _Ann. Am. Acad. Polit. Soc. Sci._ 441, 114–131 (1979). Article Google Scholar *
Massey, D. S. Still the linchpin: Segregation and stratification in the USA. _Race Soc. Probl._ 12, 1–12. https://doi.org/10.1007/s12552-019-09280-1 (2020). Article Google Scholar *
Massey, D. S. _American Apartheid: Segregation and the Making of the Underclass_ (Harvard University Press, 1993). Google Scholar * Ananat, E. O. The wrong side(s) of the tracks: The causal
effects of racial segregation on urban poverty and inequality. _Am. Econ. J. Appl. Econ._ 3, 34–66. https://doi.org/10.1257/app.3.2.34 (2011). Article Google Scholar * Card, D. &
Rothstein, J. Racial segregation and the black-white test score gap, w12078 (2006-03). https://doi.org/10.3386/w12078. * Chetty, R., Hendren, N., Kline, P. & Saez, E. Where is the land
of opportunity? The geography of intergenerational mobility in the United States*. _Q. J. Econ._ 129, 1553–1623. https://doi.org/10.1093/qje/qju022 (2014). Article Google Scholar *
Trounstine, J. Segregation and inequality in public goods. _Am. J. Polit. Sci._ 60, 709–725. https://doi.org/10.1111/ajps.12227 (2016). Article Google Scholar * Quillian, L. Group threat
and regional change in attitudes toward African–Americans. _Am. J. Sociol._ 102, 816–860. https://doi.org/10.1086/230998 (1996). Article Google Scholar * Sampson, R. J., Morenoff, J. D.
& Raudenbush, S. Social anatomy of racial and ethnic disparities in violence. _Am. J. Public Health_ 95, 224–232. https://doi.org/10.2105/AJPH.2004.037705 (2005). Article PubMed PubMed
Central Google Scholar * Light, M. T. & Thomas, J. T. Segregation and violence reconsidered: Do whites benefit from residential segregation?. _Am. Sociol. Rev._ 84, 690–725.
https://doi.org/10.1177/0003122419858731 (2019). Article Google Scholar * Kramer, M. R. & Hogue, C. R. Is segregation bad for your health?. _Epidemiol. Rev._ 31, 178–194.
https://doi.org/10.1093/epirev/mxp001 (2009). Article PubMed Google Scholar * Torrats-Espinosa, G. Using machine learning to estimate the effect of racial segregation on COVID-19
mortality in the United States. _Proc. Natl. Acad. Sci. USA_ 118, e2015577118. https://doi.org/10.1073/pnas.2015577118 (2021). Article CAS PubMed PubMed Central Google Scholar * Logan,
J. R. The persistence of segregation in the 21st century metropolis. _City Community_https://doi.org/10.1111/cico.12021 (2013). Article PubMed PubMed Central Google Scholar * Elbers, B.
Trends in US residential racial segregation, 1990 to 2020. _Socius_ 7, 23780231211053984. https://doi.org/10.1177/23780231211053982 (2021). Article Google Scholar * Massey, D. S. &
Tannen, J. A research note on trends in black hypersegregation. _Demography_ 52, 1025–1034. https://doi.org/10.1007/s13524-015-0381-6 (2015). Article PubMed Google Scholar * Moro, E.,
Calacci, D., Dong, X. & Pentland, A. Mobility patterns are associated with experienced income segregation in large US cities. _Nat. Commun._ 12, 4633.
https://doi.org/10.1038/s41467-021-24899-8 (2021). Article CAS PubMed PubMed Central ADS Google Scholar * Athey, S., Ferguson, B., Gentzkow, M. & Schmidt, T. Estimating experienced
racial segregation in US cities using large-scale GPS data. _Proc. Natl. Acad. Sci. USA_ 118, e2026160118. https://doi.org/10.1073/pnas.2026160118 (2021). Article CAS PubMed PubMed
Central Google Scholar * Zhang, Y., Cheng, S., Li, Z. & Jiang, W. Human mobility patterns are associated with experienced partisan segregation in US metropolitan areas. _Sci. Rep._ 13,
9768. https://doi.org/10.1038/s41598-023-36946-z (2023). Article CAS PubMed PubMed Central ADS Google Scholar * Jones, M. & Pebley, A. R. Redefining neighborhoods using common
destinations: Social characteristics of activity spaces and home census tracts compared. _Demography_ 51, 727–752. https://doi.org/10.1007/s13524-014-0283-z (2014). Article PubMed Google
Scholar * Davis, D. R., Dingel, J. I., Monras, J. & Morales, E. How segregated is urban consumption?. _J. Polit. Econ._ 55, 25 (2019). Google Scholar * Krivo, L. J. _et al._ Social
isolation of disadvantage and advantage: The reproduction of inequality in urban space. _Soc. Forces_ 92, 141–164. https://doi.org/10.1093/sf/sot043 (2013). Article Google Scholar * Wang,
Q., Phillips, N. E., Small, M. L. & Sampson, R. J. Urban mobility and neighborhood isolation in America’s 50 largest cities. _Proc. Natl. Acad. Sci._ 115, 7735–7740.
https://doi.org/10.1073/pnas.1802537115 (2018). Article CAS PubMed PubMed Central ADS Google Scholar * McMenamin, T. M. A time to work: Recent trends in shift work and flexible
schedules. _Mon. Labor Rev._ 130, 3–15 (2007). Google Scholar * Reardon, S. F. & Owens, A. 60 years after brown: Trends and consequences of school segregation. _Ann. Rev. Sociol._ 40,
199–218. https://doi.org/10.1146/annurev-soc-071913-043152 (2014). Article Google Scholar * Tomaskovic-Devey, D. _et al._ Documenting desegregation: Segregation in American workplaces by
race, ethnicity, and sex, 1966–2003. _Am. Sociol. Rev._ 71, 565–588. https://doi.org/10.1177/000312240607100403 (2006). Article Google Scholar * Hellerstein, J. K. & Neumark, D.
Workplace segregation in the United States: Race, ethnicity, and skill. _Rev. Econ. Stat._ 90, 459–477 (2008). Article Google Scholar * Hall, M., Iceland, J. & Yi, Y. Racial separation
at home and work: Segregation in residential and workplace settings. _Popul. Res. Policy Rev._ 38, 671–694. https://doi.org/10.1007/s11113-019-09510-9 (2019). Article Google Scholar *
Grodsky, E. & Pager, D. The structure of disadvantage: Individual and occupational determinants of the black-white wage gap. _Am. Sociol. Rev._ 66, 542–567.
https://doi.org/10.2307/3088922 (2001). Article Google Scholar * Kimm, S. Y. _et al._ Decline in physical activity in black girls and white girls during adolescence. _N. Engl. J. Med._
347, 709–715. https://doi.org/10.1056/NEJMoa003277 (2002). Article PubMed Google Scholar * Crespo, C. J., Smit, E., Andersen, R. E., Carter-Pokras, O. & Ainsworth, B. E.
Race/ethnicity, social class and their relation to physical inactivity during leisure time: Results from the third national health and nutrition examination survey, 1988–1994. _Am. J. Prev.
Med._ 18, 46–53. https://doi.org/10.1016/S0749-3797(99)00105-1 (2000). Article CAS PubMed Google Scholar * Roscigno, V. J. & Ainsworth-Darnell, J. W. Race, cultural capital, and
educational resources: Persistent inequalities and achievement returns. _Sociol. Educ._ 72, 158–178. https://doi.org/10.2307/2673227 (1999). Article Google Scholar * Kalmijn, M. &
Kraaykamp, G. Race, cultural capital, and schooling: An analysis of trends in the United States. _Sociol. Educ._ 69, 22–34. https://doi.org/10.2307/2112721 (1996). Article Google Scholar *
Peterson, R. A. & Kern, R. M. Changing highbrow taste: From snob to omnivore. _Am. Sociol. Rev._ 61, 900–907. https://doi.org/10.2307/2096460 (1996). Article Google Scholar * Bryson,
B. “Anything but heavy metal’’: Symbolic exclusion and musical dislikes. _Am. Sociol. Rev._ 61, 884–899. https://doi.org/10.2307/2096459 (1996). Article Google Scholar * Goldberg, A.
Mapping shared understandings using relational class analysis: The case of the cultural omnivore reexamined. _Am. J. Sociol._ 116, 1397–1436. https://doi.org/10.1086/657976 (2011). Article
Google Scholar * DiMaggio, P. Are art-museum visitors different from other people? The relationship between attendance and social and political attitudes in the United States. _Poetics_ 24,
161–180. https://doi.org/10.1016/S0304-422X(96)00008-3 (1996). Article Google Scholar * DiMaggio, P. & Mukhtar, T. Arts participation as cultural capital in the united states,
1982–2002: Signs of decline?. _Poetics_ 32, 169–194. https://doi.org/10.1016/j.poetic.2004.02.005 (2004). Article Google Scholar * Dumais, S. A. Cultural capital, gender, and school
success: The role of habitus. _Sociol. Educ._ 75, 44–68. https://doi.org/10.2307/3090253 (2002). Article Google Scholar * Massey, D. S. & Denton, N. A. The dimensions of residential
segregation. _Soc. Forces_ 67, 281–315. https://doi.org/10.2307/2579183 (1988). Article Google Scholar * Bureau, U. C. Glossary. Section: Government. * Rubin, D. B. _Multiple Imputation
for Nonresponse in Surveys_ (Wiley, 2018). Google Scholar * Small, M. L., Akhavan, A., Torres, M. & Wang, Q. Banks, alternative institutions and the spatial-temporal ecology of racial
inequality in US cities. _Nat. Human Behav._ 5, 1622–1628. https://doi.org/10.1038/s41562-021-01153-1 (2021). Article Google Scholar * Pager, D. & Shepherd, H. The sociology of
discrimination: Racial discrimination in employment, housing, credit, and consumer markets. _Ann. Rev. Sociol._ 34, 181–209. https://doi.org/10.1146/annurev.soc.33.040406.131740 (2008).
Article Google Scholar * Wingfield, A. H. & Chavez, K. Getting in, getting hired, getting sideways looks: Organizational hierarchy and perceptions of racial discrimination. _Am.
Sociol. Rev._ 85, 31–57 (2020). Article Google Scholar * Quillian, L., Lee, J. J. & Oliver, M. Evidence from field experiments in hiring shows substantial additional racial
discrimination after the callback. _Soc. Forces_ 99, 732–759 (1996). Article Google Scholar * Lee, J. The salience of race in everyday life: Black customers’ shopping experiences in black
and white neighborhoods. _Work Occup._ 27, 353–376. https://doi.org/10.1177/0730888400027003005 (2000). Article Google Scholar * Pittman, C. “Shopping while black’’: Black consumers’
management of racial stigma and racial profiling in retail settings. _J. Consum. Culture_ 20, 3–22. https://doi.org/10.1177/1469540517717777 (2020). Article Google Scholar * Sanders, J. M.
Ethnic boundaries and identity in plural societies. _Annu. Rev. Sociol._ 28, 327–357 (2002). Article Google Scholar * McPherson, M., Smith-Lovin, L. & Cook, J. M. Birds of a feather:
Homophily in social networks. _Ann. Rev. Sociol._ 27, 415–444. https://doi.org/10.1146/annurev.soc.27.1.415 (2001). Article Google Scholar * Achidi Ndofor, H. & Priem, R. L. Immigrant
entrepreneurs, the ethnic enclave strategy, and venture performance. _J. Manage._ 37, 790–818. https://doi.org/10.1177/0149206309345020 (2011). Article Google Scholar * Gobster, P. H.
Urban parks as green walls or green magnets? Interracial relations in neighborhood boundary parks. _Landsc. Urban Plan._ 41, 43–55. https://doi.org/10.1016/S0169-2046(98)00045-0 (1998).
Article Google Scholar * Ager, P. & Brückner, M. Cultural diversity and economic growth: Evidence from the US during the age of mass migration. _Eur. Econ. Rev._ 64, 76–97.
https://doi.org/10.1016/j.euroecorev.2013.07.011 (2013). Article Google Scholar * AlShebli, B. K., Rahwan, T. & Woon, W. L. The preeminence of ethnic diversity in scientific
collaboration. _Nat. Commun._ 9, 5163. https://doi.org/10.1038/s41467-018-07634-8 (2018). Article CAS PubMed PubMed Central ADS Google Scholar * Gomez, L. E. & Bernet, P. Diversity
improves performance and outcomes. _J. Natl. Med. Assoc._ 111, 383–392. https://doi.org/10.1016/j.jnma.2019.01.006 (2019). Article CAS PubMed Google Scholar * Herring, C. Does diversity
pay?: Race, gender, and the business case for diversity. _Am. Sociol. Rev._ 74, 208–224 (2009). Article Google Scholar * Levine, S. S. _et al._ Ethnic diversity deflates price bubbles.
_Proc. Natl. Acad. Sci._ 111, 18524–18529. https://doi.org/10.1073/pnas.1407301111 (2014). Article CAS PubMed PubMed Central ADS Google Scholar Download references FUNDING Funding was
provided by the Department of Sociology at Columbia University. AUTHOR INFORMATION AUTHORS AND AFFILIATIONS * Columbia University in the City of New York, Sociology, New York, NY, 10027, USA
Joanna Chae Authors * Joanna Chae View author publications You can also search for this author inPubMed Google Scholar CONTRIBUTIONS J.C. designed research, performed research, analyzed
data, and wrote the paper. CORRESPONDING AUTHOR Correspondence to Joanna Chae. ETHICS DECLARATIONS COMPETING INTERESTS The author declares no competing interests. ADDITIONAL INFORMATION
PUBLISHER'S NOTE Springer Nature remains neutral with regard to jurisdictional claims in published maps and institutional affiliations. SUPPLEMENTARY INFORMATION SUPPLEMENTARY
INFORMATION. RIGHTS AND PERMISSIONS OPEN ACCESS This article is licensed under a Creative Commons Attribution 4.0 International License, which permits use, sharing, adaptation, distribution
and reproduction in any medium or format, as long as you give appropriate credit to the original author(s) and the source, provide a link to the Creative Commons licence, and indicate if
changes were made. The images or other third party material in this article are included in the article’s Creative Commons licence, unless indicated otherwise in a credit line to the
material. If material is not included in the article’s Creative Commons licence and your intended use is not permitted by statutory regulation or exceeds the permitted use, you will need to
obtain permission directly from the copyright holder. To view a copy of this licence, visit http://creativecommons.org/licenses/by/4.0/. Reprints and permissions ABOUT THIS ARTICLE CITE THIS
ARTICLE Chae, J. 7-day patterns in Black-White segregation in 49 metropolitan areas. _Sci Rep_ 14, 6740 (2024). https://doi.org/10.1038/s41598-024-56257-1 Download citation * Received: 23
December 2023 * Accepted: 04 March 2024 * Published: 20 March 2024 * DOI: https://doi.org/10.1038/s41598-024-56257-1 SHARE THIS ARTICLE Anyone you share the following link with will be able
to read this content: Get shareable link Sorry, a shareable link is not currently available for this article. Copy to clipboard Provided by the Springer Nature SharedIt content-sharing
initiative