- Select a language for the TTS:
- UK English Female
- UK English Male
- US English Female
- US English Male
- Australian Female
- Australian Male
- Language selected: (auto detect) - EN
Play all audios:
ABSTRACT Although a decrease in stroke admissions during the SARS-CoV-2 pandemic has been observed, detailed analyses of the evolution of stroke metrics during the pandemic are lacking. We
analyzed changes in stroke presentation, in-hospital systems-of-care, and treatment time metrics at two representative Comprehensive Stroke Centers (CSCs) during the first year of
Coronavirus disease 2019 pandemic. From January 2018 to May 2021, data from stroke presentations to two CSCs were obtained. The study duration was split into: period 0 (prepandemic), period
1 (Wave 1), period 2 (Lull), and period 3 (Wave 2). Acute stroke therapies rates and workflow times were compared among pandemic and prepandemic periods. Analyses were adjusted for age, sex,
comorbidities, and pre-morbid care needs. There was a significant decrease in monthly hospital presentations of stroke during Wave 1. Both centers reported declines in reperfusion therapies
during Wave 1, slowly catching up but never to pre pandemic numbers, and dropping again in Wave 2. Both CSCs experienced in-hospital workflow delays during Waves 1 and 2, and even during
the Lull period. Our results highlight the need for proactive strategies to reduce barriers to workflow and hospital avoidance for stroke patients during crisis periods. SIMILAR CONTENT
BEING VIEWED BY OTHERS IMPACT OF THE COVID-19 PANDEMIC ON EMERGENT STROKE CARE IN BEIJING, CHINA Article Open access 17 March 2023 STROKE CARE PATHWAY ENSURES HIGH-QUALITY STROKE MANAGEMENT
IN THE COVID-19 PANDEMIC Article Open access 05 April 2023 IMPACT OF COVID-19 PANDEMIC ON ACUTE STROKE CARE IN A TERTIARY STROKE CENTRE Article Open access 28 December 2024 INTRODUCTION In
response to the Coronavirus disease 2019 (COVID-19) pandemic, most affected countries implemented varying degrees of social-distancing measures intended to decrease viral transmission and
“flatten the curve”1,2. An unintended consequence of social-distancing messaging could be hospital avoidance by patients with medical emergencies, including acute ischemic stroke (AIS), as
observed in Hong Kong during the 2009 H1N1 influenza epidemic3,4. Social distancing policies may also result in a loss of services and support networks for seniors or patients with
disabilities, potentially impairing their ability to seek medical assistance for emergencies5,6,7. Drops in the number of patients presenting to hospital with AIS or acute coronary syndrome
(ACS) occurred8,9,10,11. A longitudinal retrospective study from 275 stroke centers across 6 continents reported a 7% decline in stroke admissions and 6.1% decline in intravenous
thrombolysis, with larger declines observed at high-volume compared to low-volume centers12. Stroke patients who did present to emergency departments did so later than they normally would.
While not fully understood, this may have been a consequence of delayed appreciation of stroke symptoms while socially isolated or reluctance to go to the hospital out of perceived increased
risk of infection13,14,15. The COVID-19 pandemic introduced a unique set of challenges for running “codes” for AIS and ACS, both at the pre-hospital and in-hospital stages16. The risk posed
to healthcare providers by the patient’s unknown COVID status—which increases with the prevalence of community transmission17 and the known existence of asymptomatic carriers18—and the
appropriately heightened focus on personal protective equipment (PPE) are perhaps the biggest impediments. Such concerns have led to directives for “protected code strokes”,
transmission-prevention protocols to facilitate the safety of both healthcare professionals and patients19. An unfortunate and perhaps inevitable consequence of this competing priority was
the slowing of workflow processes20. In the assessment and management of acute stroke, speed is essential to optimizing patient outcomes21,22. Understanding the effects of the recent
COVID-19 pandemic on stroke workflow metrics may help us identify areas of potential delays in acute stroke care during a crisis and to better plan future acute stroke care protocols as part
of crisis response strategies. We aimed to investigate changes in stroke hospitalizations, treatment rates, presentation characteristics, and key time metrics for AIS care during the first
year of the COVID-19 pandemic across two urban Comprehensive Stroke Centers in Calgary, Canada, and Boston, Massachusetts, United States. METHODS SOURCES OF DATA We used linked provincial
administrative and clinical registry data capturing stroke-related data on all patients who were seen at the Comprehensive Stroke Centre (CSC) in Calgary, Alberta (Foothills Medical Centre,
FMC), and in Massachusetts General Hospital (MGH), in Boston, Massachusetts. For the Canadian data, we primarily relied on administrative registries and electronic health records to analyze
data related to stroke patients during the COVID-19 pandemic. Calgary data on all patients hospitalized with AIS during the pre-pandemic and pandemic periods of interest (defined below) were
obtained from the Discharge Abstract Database maintained by the provincial health authority (Alberta Health Services Analytics group via the Alberta Strategy for Patient Oriented Research
Support Unit) which contains demographic and clinical information on hospital discharges, including comorbidities and need for continuing care like assisted living or nursing home care23.
MGH data was obtained from the local registry of all AIS patients admitted throughout the study period. The data was derived from Epic (Epic Systems Corporation), an American privately held
healthcare software company, which contains all clinical, demographic and discharge information of patients who present to MGH. These data are reliable in reporting ischemic stroke and
vascular risk factors24, with International Classification of Diseases 10 (ICD-10) codes for stroke having accuracies of 92–97%20. In this study, we used the following ICD-10 codes to define
AIS: G08, H341, I630, I631, I632, I633, I634, I635, I636, I638, I639, I64, and I676 (Supplemental Material, Table 1). We abstracted patient demographics; stroke severity (National
Institutes of Health Stroke Scale score])25; pre-hospital workflow (times for stroke onset and hospital arrival, “onset-to-door”); and in-hospital workflow [computed tomography (CT),
thrombolysis, endovascular therapy arterial access and reperfusion times]. In Calgary, these metrics were obtained through the Quality Improvement and Clinical Research (QuICR)
registry26,27, using linked provincial health care numbers for the patients. STATISTICAL ANALYSES The study period was divided into four segments for analysis based on local COVID-19
infection trends: Pre-Pandemic (reference), Wave 1, Lull period, and Wave 2. Decisions on the cut-offs were made based on changes in local case numbers and community restrictions in each
center. In Calgary, decisions on the pre-pandemic period were based on data from the start of the year 2018. Alberta’s first COVID-19 case was identified on 28-February-2020, followed soon
by public health restrictions,21 so the (0) “Pre-Pandemic period” was defined as 1-January-2018 to 27-February-2020. We divided the first Pandemic year into three periods based on key
changes in terms of reported COVID-19 case counts, timing of public health restrictions, and impact on health services delivery: (1) “Wave 1” (28-February-2020 to 12-May-2020) was
characterized by a relatively small number of cases (peak in new daily cases on 29-April-2021 with 315 new cases and a 7-day rolling average of 252 new cases) but with public health
restrictions in full force; (2) A relative “Lull” period (13-May-2020 to 20-July-2020) that began with a gradual relaunch strategy and was characterized by a relative flattening of the
curve; (3) and “Wave 2” (21-July-2020 to 15-February-2021). Wave 2 was characterized by a major inflection after Thanksgiving gatherings, with new daily cases peaking at 1,887 on
14-Dec-2020, the contact tracing system becoming overwhelmed, and a return of lockdown-style restrictions. In MGH, the COVID burden started in March, 2020, so the (0) “Pre-Pandemic period”
was defined as 2 years prior to 1-March-2020 and the pandemic period was divided into: (1) “Wave 1” (02-March-2020 to 26-May-2020) where we reached 25.000 COVID-19 cases and during when
there were school closures, state ‘stay at home’ orders, Boston curfew and masks mandate; (2) “Lull” period (27-May-2020 to 21-October-2020) with phases 2 and 3 of reopening; (3) and “Wave
2” (22-October-2020 to 18-May-2021) with the reimplementation of curfew. For the primary analyses, we conducted interrupted time-series analyses to compare the total number of patients
presenting to emergency departments each month with stroke and the monthly rates of IVT and EVT for stroke (as cases over time) in the Pre-Pandemic and each of the three Pandemic periods.
These analyses were adjusted for age, sex, pre-admission continuing care needs, and the presence of any comorbidity. The interrupted time-series analyses were executed using the
"itsa" function in STATA28. To do so, the data on stroke admissions and treatments were first organized in a time series format for the Calgary and MGH stroke programs, with each
row summarizing the stroke admissions, thrombolysis treatments, and endovascular thrombectomies for a single month. Specific time periods of interest for the regression were demarcated using
the relevant months as described above. For adjustments, the distribution of admissions each month by age, sex, comorbidities, and continuing care in each month were also included as
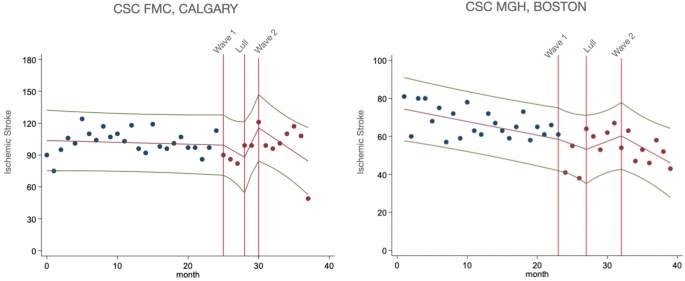
additional variables. For Figs. 1 and 2, we plotted unadjusted data for monthly presentations of ischemic stroke and monthly utilization of thrombolysis and endovascular therapy. Trendlines
were generated from interrupted time-series analyses, with knots (potential slope-changes) specified at the start of each time-period of interest. The rationale behind opting for a slope
change was based on the nature of the intervention we were investigating, which was the comparison of stroke workflow between the pandemic and pre-pandemic periods. Since the distinctions
between each pandemic period were somewhat fluid rather than definitive, we surmised that the impact of the pandemic on stroke workflow was likely to have been gradual, evolving over time as
healthcare systems adapted to the changing circumstances. Thus, a slope change allowed us to model the intervention's effect as a gradual shift in the trend of the outcome variables
over each study period. For secondary analyses, we conducted logistic regressions to compare the proportion of all stroke patients who received IVT and EVT in each Pandemic period versus the
Pre-Pandemic period. These regression analyses were adjusted for age, sex, pre-admission continuing care needs, and the presence of any comorbidity. We tested for seasonality in each
dataset separately for each of the key variables of interest (stroke admissions, IVT, and EVT) using the augmented Dickey–Fuller test to assess whether the variable of interest followed a
unit-root process29,30. As none of the variables showed seasonality (all p < 0.05), further adjustments for seasonality were not performed. Then, similar logistic regression analyses were
performed to compare the proportion of in-hospital mortality and other variables of interest (i.e. age, sex, continuing care needs and comorbidities) in the three Pandemic periods versus
the Pre-Pandemic period. In addition, we compiled any relevant changes in the workflow processes of stroke care that occurred over the first pandemic year at each CSC. We then compared pre-
and in-hospital workflow times, in median minutes, and hospital length-of-stay, in median days, using quantile regressions, as linear models were not appropriate due to the non-normality of
residuals. These quantile regressions were adjusted for age, sex, continuing care needs, and any comorbidities. Lastly, we compared the admission NIHSS, in median IQR, in each Pandemic
period versus the Pre-Pandemic period using quantile regressions. These quantile regressions were adjusted for age, sex, comorbidities, and continuing care needs. Overall, these analyses
aimed to assess the impact of the Pandemic on stroke-related outcomes, pre-hospital factors, in-hospital mortality, workflow processes, and the severity of stroke cases on admission.
Analyses were performed with STATA/MP 16.1 and R Version 4.1.1 (R Foundation for Statistical Computing, Vienna, Austria). Statistical significance was defined as p < 0.05. STANDARD
PROTOCOL APPROVALS, REGISTRATIONS, DATA AVAILABILITY AND PATIENT CONSENTS All methods were carried out in accordance with relevant guidelines and regulations. The need for informed consent
was waived by the University of Calgary Conjoint Health Research Ethics Board (REB20-0769) and by the Partners Human Research Committee Institutional Review Board (IRB00012706). The datasets
used and/or analysed during the current study are available from the corresponding author on reasonable request. Additional data are listed in the Supplemental Material. FMC data was
approved by the University of Calgary Conjoint Health Research Ethics Board (REB20–0769). In MGH, administrative deidentified data was the primary source of information. This decision
allowed us to conduct an observational analysis without directly involving human participants. As a result, the need for evaluation by an ethics committee was waived. RESULTS Baseline
characteristics from both centers are described in Table 1. At FMC in Calgary, 3816 patients were analyzed during the study period: 69.31% (n = 2645) patients with ischemic stroke
pre-pandemic and 30.69% (n = 1171) during the pandemic period. At MGH in Boston, a total of 2400 patients presented with AIS throughout the study period. From those, 66.12% (n = 1587) were
admitted before the pandemic and 33.88% (n = 813) during the pandemic. Importantly, at FMC, 79.9% of all patients who presented with AIS symptoms were hospitalized31. The dataset at FMC
captures not only patients who required hospitalization at the stroke center due to AIS, but also includes those who were seen at the emergency department but were not hospitalized. On the
other hand, in MGH only 1% of patients had the same admit and discharge date, suggesting that the vast majority were either admitted or at least observed overnight. This indicates a high
level of hospitalization among AIS patients in the both datasets. During the pandemic period, patients presenting to the Calgary CSC were less likely to have atrial fibrillation in Wave 2
[adjusted odds ratio (aOR) 0.61, 95%CI 0.46–0.81] but more likely to have coronary artery disease (aOR 1.99, 95%CI 1.10–3.61); otherwise, there were no significant differences compared to
the pre-pandemic period (Supplemental Material, Table 2). In Boston CSC, patients admitted with AIS during the Lull period were less likely to need continuing care even after adjusting for
age and sex (aOR 0.45, 95%CI 0.26–0.74). On the other hand, patients were more likely to have chronic kidney disease during the Lull period (aOR 1.86, 95%CI 1.32–2.59) and Wave 2 (aOR 1.48,
95%CI 1.07–2.03), with no other significant differences in the prevalence of comorbidities compared to the pre-pandemic period (Supplemental Material, Table 3). In Calgary CSC, monthly
hospital presentations of AIS decreased in Wave 1 compared to pre-pandemic period in adjusted analysis for age, sex, comorbidities and continuing care needs (β = −3.14, p < 0.01).
Further, there was a non-significant increase in the Lull period and drop in Wave 2, however to a lesser extent than during Wave 1. In Boston CSC, monthly hospital admissions of AIS
decreased steeply (β = −6.39, p < 0.001) in Wave 1, then increased in the Lull period (β = 9.20, p < 0.001), although not returning to pre-pandemic levels, and further declined in Wave
2 (β = −3.85, p = 0.04), in adjusted analysis for age, sex and comorbidities. After additionally adjusting for continuing care needs, monthly stroke admissions followed a similar trend
during Wave 1 (β = −6.52, p < 0.001) and the Lull (β = 9.12, p < 0.001), however the drop in Wave 2 was no longer significant (β = −3.63, p = 0.07) (Fig. 1). ACUTE TREATMENTS OR
OUTCOMES Both centers reported similar declines in the incidence of thrombolysis and thrombectomy in Wave 1, slowly catching up in the Lull period, though not to pre-pandemic numbers, and
then dropping again in Wave 2. In interrupted time series analysis adjusted for age, sex, comorbidities and continuing care needs, there was a non-significant drop in monthly IVT rates in
the Calgary CSC in Wave 1, recovery in the Lull period (β = 4.86, p = 0.02), and another decline in Wave 2 (β = −4.46, p < 0.001). EVT monthly cases followed similar trend, first reducing
in Wave 1 (β = −2.59, p < 0.01), recovering in the Lull period (β = 5.23, p < 0.001), and dropping again in Wave 2 (β = −3.68, p = 0.001). In Boston CSC, thrombolysis and thrombectomy
presented a similar pattern. IVT monthly rates initially dropped in Wave 1 (β = −0.71, p = 0.04), but then rose in Wave 2 (β = 1.30, p < 0.001); and monthly EVT non-significantly
decreased in Wave 1, followed by an increase in the Lull period (β = 2.08, p < 0.05) (Fig. 2). Among those presenting to the Calgary CSC, IVT was given to 344 (13.0%) of 2645 patients
pre-pandemic and to 168 (14.35%) of 1171 patients during the pandemic; and EVT to 313 (11.8%) patients pre-pandemic and to 148 (12.64%) during pandemic. In adjusted analysis, patients
presenting during Wave 1 were more likely to receive IVT than in the pre-pandemic period (aOR 1.51, 95%CI 1.04–2.19). In Boston CSC, 99 (6.24%) patients received IVT pre-pandemic and 52
(6.40%) during the pandemic, and 181 (11.41%) and 105 (12.92%) received EVT before and during pandemic, respectively. No differences were observed after adjusting for age, sex,
comorbidities, and continuing care needs (Table 2). Median length of stay in-hospital slightly increased in Wave 2 in Calgary CSC (adjusted difference 1.0, 95% CI 0.2–1.9) and in Boston CSC
(adjusted difference 1.0, 95%CI 0.24–1.0). Mortality remained stable in both centers (Table 2). TIME METRICS/STROKE WORKFLOW During the pandemic, both centers incorporated routine PPE
precautions for stroke codes as well as additional cleaning processes. In addition, the Calgary CSC required a geographic change in the location of the angiography suite to meet IP&C
precautions for the first part of the study period (Fig. 3). Regarding prehospital response in Calgary CSC, onset-to-door times were prolonged during the pandemic, however this effect was
attenuated in adjusted analysis. Moreover, there were no significant differences in in-hospital workflow in door-to-needle times when comparing the 3 pandemic periods with the pre-pandemic
period. However, door-to-CT times were a little higher during Wave 1 and Lull period (unadjusted difference 3 min, 95%CI 0.9–5.1). After adjusting for age, sex, comorbidities and continuing
care needs, the difference remained significant in the Lull period (adjusted difference 3.7 min, 95%CI 1.3–6.1) (Table 3). Compared to pre-pandemic, median times for CT-to-arterial access
were prolonged during Lull period (unadjusted difference 9 min, 95%CI 0.1–17.9) and Wave 2 (unadjusted difference 7 min, 95%CI 1.1–12.9), and remained significantly higher in Wave 2 in the
adjusted analysis (adjusted difference 7.3 min, 95%CI 1.2–13.5) (Table 3). Median times for EVT workflow also rose during Wave 2, when door-to-arterial access, arterial access-to-reperfusion
and door-to-reperfusion were 8.5 (95%CI 0.1–16.8), 6.8 (95%CI 0.6–13) and 17.3 min (95%CI 1.8–32.9) slower, respectively. The Lull period experienced a similar trend with differences in the
median times for door-to-arterial access, arterial access-to-reperfusion and door-to-reperfusion of 15.3 (95%CI 2.7–28.0), 24.4 (95%CI 16.2–32.6) and 48.7 min (95%CI 28.2–69.3),
respectively (Table 3). Time metrics reported in Boston CSC also faced significant changes during the pandemic periods compared to pre-pandemic. Although prehospital response (onset-to-door
time) did not significantly change, in-hospital workflow experienced some delays. During Wave 1 there were significantly prolonged times for thrombolysis and thrombectomy workflows, such as
door-to-needle (adjusted difference 16 min, 95%CI 1.0–34.3) and CT-to-arterial access times (adjusted difference 8.9 min, 95%CI 3.2–16.1) (Table 4). The CSC in Boston also experienced delays
in the Lull period and Wave 2 compared to the pre-pandemic period. Door-to-CT time during the Lull period increased (adjusted difference 24.3 min, 95%CI 3.4–43). Door-to-needle times were
also prolonged in the Lull period in the unadjusted analysis in 11 min (95% CI 9.9–49) and Wave 2 in the adjusted analysis in 13 min (95% CI 1.9–36.4) (Table 4). Moreover, EVT workflow in
Boston CSC such as arterial access-to-reperfusion times were also prolonged in the Lull period in 11.9 min (95%CI 3.5–17.6). Significant delays occurred during Wave 2, when arterial
access-to-reperfusion times significantly increased (adjusted difference 24.1 min, 95%CI 12.9–30.99) (Table 4). STROKE SEVERITY Baseline NIHSS remained stable with no overall differences
were found between pandemic and pre-pandemic, except in Wave 1. During this period in Calgary CSC, all patients treated with acute therapies and also EVT only recipients had significantly
lower NIHSS scores, of 4.5 and 6.1 points, in the adjusted analyses, respectively. As for the CSC in Boston, only patients treated with IVT had significantly lower NIHSS (adjusted difference
−4.64 points, 95%CI −8.82, −1.69) (Supplemental Material, Table 4). DISCUSSION In two different stroke comprehensive centers in two countries during the first year of the COVID-19 pandemic,
there was a similar pattern of decreasing admissions and prolonged workflow times during the beginning of the pandemic then modestly improving during the Lull period, but never to
pre-pandemic numbers. The steep decrease may be related to lockdown measures and fear of presenting to emergency departments. Other articles reporting decreases in AIS presentations have
generally studied presentation trends or have focused on in-hospital stroke treatment rates31,32,33, but our study adds to the literature by linking institutional stroke workflow changes
with a parallel comparison of high-quality complete data from two leading CSCs in different countries. Our research corroborates previous studies31,33 on the evolution of acute stroke care
during the COVID-19 pandemic. However, it also offers a unique perspective by analyzing two large CSCs located in different countries, yet exhibiting similar trends. In the context of the
existing literature, our study aligns with prior research indicating a decline in the volume of stroke hospitalizations and IVT during the initial phase of the COVID-19 pandemic33.
Additionally, Nogueira et al. observed a recovery in stroke hospitalizations, but not IVT volume, in the later phase of the pandemic, similar to our findings at MGH CSC33. Going further, our
results can also be compared to previous epidemics, and we can identify several potential reasons for the observed delays during the COVID-19 pandemic. Notably, Lau et al. reported that in
the H1N1 outbreak a great proportion of the population demonstrated avoidance behaviours3, and Chang et al. suggested that during the SARS epidemic the fear of going to the hospital due to
the risk of infection significantly affected accessibility to quality care8. Moreover, public health measures including quarantine may have contributed to the increase in the levels of
concern among citizens curing the COVID-19 pandemic. These factors collectively may have contributed to the impact on our CSCs, leading to the changes noted in stroke metrics. It is also
worth considering the influence of safety measures that were implemented during the pandemic, such as the protected code stroke and the use of PPE. These strategies aimed to ensure safety
not only for patients, but also for healthcare workers19, resulting in structural changes within the CSCs that could further influence stroke metrics. A main aspect of this study to note is
the similarity between cohorts despite different geographic location, as well as the similarity of workflow patterns. These results raise concern for a broader decline in stroke
presentations and treatment trends. The decline in the rate of patients presenting with AIS also led to delays in workflow times and prolonged length of stay. However, neither CSC
experienced significantly higher odds of in-hospital mortality. We also showed that this decline continued to a lesser extent after the early COVID-19 pandemic, which could reflect greater
hospital avoidance early on rather than a true decline in stroke rates. Further support for this hospital avoidance hypothesis came from a recent population study in Alberta, Canada which
“found” some of the missing strokes during the pandemic in the form of increased out-of-hospital stroke deaths31. The observed delays in stroke workflow times were likely impacted by
in-hospital procedural changes in response to the pandemic. While the Canadian center noticed geographic change in the angiography room, in Boston CSC most adjustments were related to
sanitation procedures in care settings, which could have contributed to the changes observed. This article has some limitations. First, workflow data are only available from patients who
received acute therapy, which may underestimate resulting times. Also, we do not have information on individual patients’ COVID infection status which may also influence stroke metrics and
severity. In addition, the observed workflow delays may also relate to additional challenges in information gathering and treatment decision-making that occurred during the pandemic, which
cannot to be completely captured in this type of analysis32. Moreover, in our study, we did not observe any significant changes in in-hospital mortality rates among stroke patients. However,
an individual patient meta-analysis, which included data from 83 published and unpublished studies, along with authors' data from the first pandemic wave, reported an increase in
in-hospital stroke mortality31. Their recruitment period ranged from February to July 202034. Similar results were reported in another systematic review and meta-analysis that enrolled
patients from December 2019 to September 202035. We hypothesize that the decrease of in-hospital mortality might be at least partly attributed to an increase of out of hospital mortality.
Supporting this, Ganesh et al. reported that the proportion of all stroke deaths in Alberta that occurred out of hospital increased significantly during the first year of the pandemic except
from July 21, 2020 to Oct. 11, 202031. In light of the conflicting results and the ongoing nature of the pandemic, we acknowledge the need for further research to delve deeper into the
reasons behind the varying mortality outcomes observed in different studies. In conclusion, both comprehensive stroke centers had fewer stroke presentations and acute treatments
administered, with an increase of length of stay during the study period. However, no changes of in-hospital mortality were observed. Strategies must be taken to continue to motivate
patients to seek care even during pandemic and stroke protocols should accommodate measures to mitigate inefficiencies. DATA AVAILABILITY All data used for this study have been stored in a
deidentified database, and the programming code is stored. Requests for access to the data or code, when accompanied by a proposal of appropriate rigor, will be considered by the
corresponding author and pending approval from the local REB and IRB. REFERENCES * Anderson, R. M., Heesterbeek, H., Klinkenberg, D. & Hollingsworth, T. D. How will country-based
mitigation measures influence the course of the COVID-19 epidemic?. _Lancet_ 395, 931–934. https://doi.org/10.1016/S0140-6736(20)30567-5 (2020). Article CAS PubMed PubMed Central Google
Scholar * Kmietowicz, Z. Covid-19: Highest risk patients are asked to stay at home for 12 weeks. _BMJ_ 368, m1170. https://doi.org/10.1136/bmj.m1170 (2020). Article PubMed Google Scholar
* Lau, J. T., Griffiths, S., Choi, K. C. & Tsui, H. Y. Avoidance behaviors and negative psychological responses in the general population in the initial stage of the H1N1 pandemic in
Hong Kong. _BMC Infect. Dis._ 10, 139. https://doi.org/10.1186/1471-2334-10-139 (2010). Article PubMed PubMed Central Google Scholar * Armitage, R. & Nellums, L. B. COVID-19 and the
consequences of isolating the elderly. _Lancet Public Health._ 5, e256. https://doi.org/10.1016/S2468-2667(20)30061-X (2020). Article PubMed PubMed Central Google Scholar * Armitage, R.
& Nellums, L. B. The COVID-19 response must be disability inclusive. _Lancet Public Health._ 5, e257. https://doi.org/10.1016/S2468-2667(20)30076-1 (2020). Article PubMed PubMed
Central Google Scholar * Baracchini, C. _et al._ Acute stroke management pathway during Coronavirus-19 pandemic. _Neurol. Sci._ 41, 1003–1005. https://doi.org/10.1007/s10072-020-04375-9
(2020). Article PubMed PubMed Central Google Scholar * Baum, A. & Schwartz, M. D. Admissions to Veterans Affairs Hospitals for emergency conditions during the COVID-19 pandemic.
_JAMA._ 324, 96–99. https://doi.org/10.1001/jama.2020.9972 (2020). Article CAS PubMed PubMed Central Google Scholar * Chang, H. J. _et al._ The impact of the SARS epidemic on the
utilization of medical services: SARS and the fear of SARS. _Am. J. Public Health._ 94, 562–564. https://doi.org/10.2105/ajph.94.4.562 (2004). Article PubMed PubMed Central Google Scholar
* Goyal, M. _et al._ Analysis of workflow and time to treatment and the effects on outcome in endovascular treatment of acute ischemic stroke: Results from the SWIFT PRIME randomized
controlled trial. _Radiology._ 279, 888–897. https://doi.org/10.1148/radiol.2016160204 (2016). Article PubMed Google Scholar * Dhand, A. _et al._ Social networks and risk of delayed
hospital arrival after acute stroke. _Nat. Commun._ 10, 1206. https://doi.org/10.1038/s41467-019-09073-5 (2019). Article CAS PubMed PubMed Central ADS Google Scholar * Gluckman, T. J.
_et al._ Case rates, treatment approaches, and outcomes in acute myocardial infarction during the coronavirus disease 2019 pandemic. _JAMA Cardiol._ 5, 1419–1424.
https://doi.org/10.1001/jamacardio.2020.3629 (2020). Article PubMed Google Scholar * Nguyen, T. N. _et al._ Global impact of the COVID-19 pandemic on cerebral venous thrombosis and
mortality. _J. Stroke_ 24, 256–265. https://doi.org/10.5853/jos.2022.00752 (2022). Article PubMed PubMed Central Google Scholar * Menon, B. K. _et al._ Optimal workflow and process-based
performance measures for endovascular therapy in acute ischemic stroke: Analysis of the Solitaire FR thrombectomy for acute revascularization study. _Stroke_ 45, 2024–2029.
https://doi.org/10.1161/STROKEAHA.114.005050 (2014). Article PubMed Google Scholar * Hoyer, C. _et al._ Acute stroke in times of the COVID-19 pandemic: A multicenter study. _Stroke_ 51,
2224–2227. https://doi.org/10.1161/STROKEAHA.120.030395 (2020). Article CAS PubMed Google Scholar * Markus, H. S. & Brainin, M. COVID-19 and stroke—A global World Stroke Organization
perspective. _Int. J. Stroke_ 15, 361–364. https://doi.org/10.1177/1747493020923472 (2020). Article PubMed Google Scholar * Teo, K. C. _et al._ Delays in stroke onset to hospital arrival
time during COVID-19. _Stroke._ 51, 2228–2231. https://doi.org/10.1161/STROKEAHA.120.030105 (2020). Article CAS PubMed Google Scholar * Wolters, F. J., Li, L., Gutnikov, S. A., Mehta,
Z. & Rothwell, P. M. Medical attention seeking after transient ischemic attack and minor stroke before and after the UK Face, Arm, Speech, Time (FAST) public education campaign: Results
from the Oxford Vascular Study. _JAMA Neurol._ 75, 1225–1233. https://doi.org/10.1001/jamaneurol.2018.1603 (2018). Article PubMed PubMed Central Google Scholar * Garcia-Basteiro, A. L.
_et al._ Monitoring the COVID-19 epidemic in the context of widespread local transmission. _Lancet Respir. Med._ 8, 440–442. https://doi.org/10.1016/S2213-2600(20)30162-4 (2020). Article
CAS PubMed PubMed Central Google Scholar * Khosravani, H., Rajendram, P. & Menon, B. K. Response by Khosravani et al to letter regarding article, “Protected code stroke: hyperacute
stroke management during the coronavirus disease 2019 (COVID-19) pandemic”. _Stroke._ 51, e156–e157. https://doi.org/10.1161/STROKEAHA.120.030243 (2020). Article CAS PubMed Google Scholar
* Kokotailo, R. A. & Hill, M. D. Coding of stroke and stroke risk factors using international classification of diseases, revisions 9 and 10. _Stroke_ 36, 1776–1781.
https://doi.org/10.1161/01.STR.0000174293.17959.a1 (2005). Article PubMed Google Scholar * Alberta Go. _COVID-19 Alberta Statistics_.
https://www.alberta.ca/stats/covid-19-alberta-statistics.htm. Accessed 25 Nov 2020 (2020). * Zerna, C. _et al._ Comparative effectiveness of endovascular treatment for acute ischemic stroke:
A population-based analysis. _J. Am. Heart Assoc._ 9, e014541. https://doi.org/10.1161/JAHA.119.014541 (2020). Article PubMed PubMed Central Google Scholar * Leppert, M. H., Campbell,
J. D., Simpson, J. R. & Burke, J. F. Cost-effectiveness of intra-arterial treatment as an adjunct to intravenous tissue-type plasminogen activator for acute ischemic stroke. _Stroke_ 46,
1870–1876. https://doi.org/10.1161/STROKEAHA.115.009779 (2015). Article CAS PubMed PubMed Central Google Scholar * Porter, J., Mondor, L., Kapral, M. K., Fang, J. & Hall, R. E. How
reliable are administrative data for capturing stroke patients and their care. _Cerebrovasc. Dis. Extra_ 6, 96–106. https://doi.org/10.1159/000449288 (2016). Article PubMed PubMed Central
Google Scholar * Brott, T. _et al._ Measurements of acute cerebral infarction: A clinical examination scale. _Stroke_ 20, 864–870. https://doi.org/10.1161/01.str.20.7.864 (1989). Article
CAS PubMed Google Scholar * Kamal, N. _et al._ Improving door-to-needle times in the treatment of acute ischemic stroke across a Canadian province: Methodology. _Crit. Pathw. Cardiol._
18, 51–56. https://doi.org/10.1097/HPC.0000000000000173 (2019). Article PubMed Google Scholar * Kamal, N. _et al._ Provincial door-to-needle improvement initiative results in improved
patient outcomes across an entire population. _Stroke._ 51, 2339–2346. https://doi.org/10.1161/STROKEAHA.120.029734 (2020). Article PubMed Google Scholar * Linden, A. Conducting
interrupted time-series analysis for single- and multiple-group comparisons. _Stata J._ 15(2), 480–500 (2021). Article Google Scholar * Dickey, D. A. & Fuller, W. A. Distribution of
the estimators for autoregressive time series with a unit root. _J. Am. Stat. Assoc._ 74, 427–431. https://doi.org/10.2307/2286348 (1979). Article MathSciNet MATH Google Scholar *
MacKinnon, J. G. Approximate asymptotic distribution functions for unit-root and cointegration tests. _J. Bus. Econ. Stat._ 12, 167–176. https://doi.org/10.2307/1391481 (1994). Article
MathSciNet Google Scholar * Ganesh, A. _et al._ Changes in ischemic stroke presentations, management and outcomes during the first year of the COVID-19 pandemic in Alberta: A population
study. _CMAJ._ 194, E444–E455. https://doi.org/10.1503/cmaj.211003 (2022). Article CAS PubMed PubMed Central Google Scholar * Ganesh, A., Ospel, J. M., Kromm, J. & Goyal, M.
Ignorance is not bliss: Managing uncertainty in acute stroke treatment in the COVID-19 era. _Neuroradiology._ 63, 3–6. https://doi.org/10.1007/s00234-020-02592-9 (2021). Article PubMed
Google Scholar * Nogueira, R. G. _et al._ Global impact of COVID-19 on stroke care and IV thrombolysis. _Neurology._ 96(23), e2824–e2838. https://doi.org/10.1212/WNL.0000000000011885
(2021). Article CAS PubMed PubMed Central Google Scholar * Singh, B. _et al._ Prognostic indicators and outcomes of hospitalised COVID-19 patients with neurological disease: An
individual patient data meta-analysis. _PLoS One_ 17(6), e0263595. https://doi.org/10.1371/journal.pone.0263595 (2022). Article CAS PubMed PubMed Central Google Scholar * Nannoni, S.,
de Groot, R., Bell, S. & Markus, H. S. Stroke in COVID-19: A systematic review and meta-analysis. _Int. J. Stroke_ 16(2), 137–149. https://doi.org/10.1177/1747493020972922 (2021).
Article PubMed Google Scholar Download references FUNDING This study was funded by the Canadian Cardiovascular Society through the COVID-19 Challenge for Canada Initiative (C3I). The
design and data collection were performed by the local investigators. The study sponsors were not involved in the study design, study conduct, protocol review, or article preparation or
review. AUTHOR INFORMATION Author notes * These authors contributed equally: Lara Carvalho de Oliveira, Ana Ponciano and Nima Kashani. AUTHORS AND AFFILIATIONS * Department of Neurology, J
Philip Kistler Stroke Research Center, Massachusetts General Hospital, Harvard Medical School, Boston, MA, USA Ana Ponciano, Suzete N. F. Guarda, Anand Viswanathan & Ashby C. Turner *
Saskatchewan Stroke Program, Department of Neurosurgery, Royal University Hospital, University of Saskatchewan, Saskatoon, SK, Canada Nima Kashani * Calgary Stroke Program, Department of
Clinical Neurosciences, Cumming School of Medicine, University of Calgary, Calgary, AB, Canada Michael D. Hill, Eric E. Smith, Jillian M. Stang & Aravind Ganesh * Department of
Neurology, J Philip Kistler Stroke Research Center, Massachusetts General Hospital, Harvard Medical School, Suite 300, 175 Cambridge Street, Boston, MA, 02114, USA Lara Carvalho de Oliveira
Authors * Lara Carvalho de Oliveira View author publications You can also search for this author inPubMed Google Scholar * Ana Ponciano View author publications You can also search for this
author inPubMed Google Scholar * Nima Kashani View author publications You can also search for this author inPubMed Google Scholar * Suzete N. F. Guarda View author publications You can also
search for this author inPubMed Google Scholar * Michael D. Hill View author publications You can also search for this author inPubMed Google Scholar * Eric E. Smith View author
publications You can also search for this author inPubMed Google Scholar * Jillian M. Stang View author publications You can also search for this author inPubMed Google Scholar * Anand
Viswanathan View author publications You can also search for this author inPubMed Google Scholar * Ashby C. Turner View author publications You can also search for this author inPubMed
Google Scholar * Aravind Ganesh View author publications You can also search for this author inPubMed Google Scholar CONTRIBUTIONS L.C.O., A.P., S.N.F.G., A.C.T. and A.G. wrote the main
manuscript text. A.G. and A.C.T. conceived the idea behind the manuscript. L.C.O. and A.G. did the statistical analysis. N.K. prepared Fig. 1. L.C.O. and A.G. prepared Figs. 2 and 3. All
authors reviewed the manuscript and made significant edits and suggestions. CORRESPONDING AUTHOR Correspondence to Lara Carvalho de Oliveira. ETHICS DECLARATIONS COMPETING INTERESTS L.C.
Oliveira, A. Ponciano, N. Kashani and S.N. Farias da Guarda report no disclosures relevant to the manuscript. M.D. Hill reports a patent to US Patent office Number: 62/086077 issued and
licensed; owns stock in Pure Web Incorporated, a company that makes, among other products, medical imaging software; is a director of the Canadian Federation of Neurological Sciences, the
Canadian Stroke Consortium (not-for-profit groups), and Circle Neurovascular Inc., and has received grant support from Alberta Innovates Health Solutions, Canadian Institutes of Health
Research (CIHR), Heart & Stroke Foundation of Canada, and National Institutes of Neurological Disorders and Stroke. E.E. Smith reports grant funding from CIHR, Brain Canada, and the
Weston Brain Institute; consulting fees from Bayer, Biogen, and Javelin; royalties from UpToDate; and payment from the American Heart Association for work as Associate Editor of Stroke. J.M.
Stang reports no disclosures relevant to the manuscript. A. Viswanathan is supported in part by NIH-NINDS R01AG047975, R01NS104130, and P50AG005134. A.C. Turner reports no disclosures
relevant to the manuscript. A. Ganesh reports membership in the editorial boards of _Neurology_, _Stroke_, and _Neurology: Clinical Practice_; consulting fees from Atheneum, MD Analytics,
Fig. 3, Alexion, Biogen, MyMedicalPanel, and CTC Communications Corp; research support from the Canadian Cardiovascular Society, Alberta Innovates, CIHR, Campus Alberta Neuroscience, the
Heart and Stroke Foundation of Canada, the Government of Canada INOVAIT program and New Frontiers in Research Fund; stock/stock options from SnapDx, TheRounds.com, and Collavidence Inc.; and
has a patent application (US 17/317771) for a system for pre-hospital patient monitoring/assessment and delivery of remote ischemic conditioning or other cuff-based therapies. ADDITIONAL
INFORMATION PUBLISHER'S NOTE Springer Nature remains neutral with regard to jurisdictional claims in published maps and institutional affiliations. SUPPLEMENTARY INFORMATION
SUPPLEMENTARY TABLE 1. SUPPLEMENTARY TABLE 2. SUPPLEMENTARY TABLE 3. SUPPLEMENTARY TABLE 4. RIGHTS AND PERMISSIONS OPEN ACCESS This article is licensed under a Creative Commons Attribution
4.0 International License, which permits use, sharing, adaptation, distribution and reproduction in any medium or format, as long as you give appropriate credit to the original author(s) and
the source, provide a link to the Creative Commons licence, and indicate if changes were made. The images or other third party material in this article are included in the article's
Creative Commons licence, unless indicated otherwise in a credit line to the material. If material is not included in the article's Creative Commons licence and your intended use is not
permitted by statutory regulation or exceeds the permitted use, you will need to obtain permission directly from the copyright holder. To view a copy of this licence, visit
http://creativecommons.org/licenses/by/4.0/. Reprints and permissions ABOUT THIS ARTICLE CITE THIS ARTICLE de Oliveira, L.C., Ponciano, A., Kashani, N. _et al._ Stroke metrics during the
first year of the COVID-19 pandemic, a tale of two comprehensive stroke centers. _Sci Rep_ 13, 17171 (2023). https://doi.org/10.1038/s41598-023-44277-2 Download citation * Received: 15
February 2023 * Accepted: 05 October 2023 * Published: 11 October 2023 * DOI: https://doi.org/10.1038/s41598-023-44277-2 SHARE THIS ARTICLE Anyone you share the following link with will be
able to read this content: Get shareable link Sorry, a shareable link is not currently available for this article. Copy to clipboard Provided by the Springer Nature SharedIt content-sharing
initiative