- Select a language for the TTS:
- UK English Female
- UK English Male
- US English Female
- US English Male
- Australian Female
- Australian Male
- Language selected: (auto detect) - EN
Play all audios:
Download PDF Article Open access Published: 12 August 2023 Both cell autonomous and non-autonomous processes modulate the association between replication timing and mutation rate Oriya
Vardi-Yaacov1 na1, Adar Yaacov1,2,3 na1, Shai Rosenberg2,3 & …Itamar Simon1 Show authors Scientific Reports volume 13, Article number: 13143 (2023) Cite this article
1815 Accesses
Metrics details
Subjects BioinformaticsCancer genomicsData processingGene expression analysisTumour immunology AbstractCancer somatic mutations are the product of multiple mutational and repair processes, some of which are tightly associated with DNA replication. Mutation rates (MR) are known to be higher in
late replication timing (RT) regions, but different processes can affect this association. Systematic analysis of the mutational landscape of 2787 tumors from 32 tumor types revealed that
approximately one third of the tumor samples show weak association between replication timing and mutation rate. Further analyses revealed that those samples have unique mutational
signatures and are enriched with mutations in genes involved in DNA replication, DNA repair and chromatin structure. Surprisingly, analysis of differentially expressed genes between weak and
strong RT-MR association groups revealed that tumors with weak association are enriched with genes associated with cell–cell communication and the immune system, suggesting a non-autonomous
response to DNA damage.
Similar content being viewed by others Replication timing alterations are associated with mutation acquisition during breast and lung cancer evolution ArticleOpen access 18 July 2024 Mutational signature SBS8 predominantly arises due to late replication errors in cancer Article Open access 03 August 2020 Cell cycle gene alterations associate with
a redistribution of mutation risk across chromosomal domains in human cancers Article 10 January 2024 Introduction
The process of DNA replication plays an important role in mutagenesis1, with failures leading to the introduction of mismatches and/or to the conversion of DNA damages into mutations. It is
therefore not surprising that replication timing (RT), defined as the time in S phase each region is replicated, is strongly associated with mutation rate (MR) in both germline and somatic
cells2,3. In general, there are many more mutations in regions that replicate in late S phase than in those which replicate in early S phase (reviewed in4), suggesting that either
mutagenesis, repair, or both occur at different rates in early and late replicating regions.
Mutational signatures are unique combinations of mutations characteristic of various mutagenesis processes5. We and others have recently found that the association between replication timing
and mutational signatures differs for different cancer mutational processes6,7,8.
A possible approach for finding the mechanisms that distinguish between mutagenesis in early and late replicating regions (ERR and LRR) is to explore mutation rates in cells harboring a
mutation in key genes that are components of the DNA replication or repair mechanisms. Indeed, such an approach was successfully carried out by two groups who found that tumors with defects
in either mismatch repair (MMR) or global genome nucleotide excision repair (GG-NER) mechanisms9,10 do not show higher mutation rates in LRR, suggesting that differences in the efficiency of
DNA repair mechanisms are the basis for the difference in mutation rates between ERR and LRR. This conclusion is further supported by analysis of the association of mutation rate and
replication timing in xeroderma pigmentosum patients. Patients with severe impairment of the NER lost the association11. Interestingly, a recent analysis of the association of replication
timing with mutation signatures across 5120 whole-genome sequenced tumors from 40 cancer types did not support this conclusion. Many signatures associated with MMR deficiency (such as SBS6,
14, 15, 20, 21, 26, and 44) show inconsistent association with replication timing12.
Replication stress is a hallmark of cancer cells that is associated with increased genomic instability. Replication stress is a double-edged sword for cancer cells. While it promotes
tumorigenesis by increasing genomic instability, it also hinders their potential to proliferate by destabilizing replication forks13, sensitizes them to chemotherapy and generates
neoantigens that expose them to immunotherapy14,15,16. This vulnerability is classically exploited in cancer treatment to increase replication stress to unsustainable levels14,17, but new
strategies are emerging, exploiting recently identified specificities of the replication stress response. Combination approaches integrating replication stress–inducing agents, such as
carboplatin or gemcitabine, with immunotherapies like the immune checkpoint inhibitor nivolumab, have advanced to clinical trials (NCT02944396, NCT03662074, NCT03061188, NCT02734004,
NCT02849496, NCT02657889 and NCT02571725).
In addition to cell autonomous effects of DNA damage, it was recently shown that DNA damage and especially replication stress can recruit the immune system to the damaged cell18. It has been
proposed that DNA damage and replication stress elicit the activation of inflammatory responses that contribute to tumorigenesis in some contexts and to senescence/aging in others19,20.
Recent studies have found that the two systems can have mutual effects on each other. On the one hand, defects in processing DNA replication stalled forks lead to accumulation of cytosolic
DNA and to activation of the cGAS–STING pathway, resulting in the activation of the type I IFN pathway with consequent expression of ISG15 (interferon-stimulated gene 1515)21. On the other
hand, inflammation itself can cause replication stress. A recent study found that high levels of ISG15, intrinsic or induced by interferon-β, accelerates DNA replication fork progression,
resulting in extensive DNA damage and chromosomal aberrations22. Despite the growing evidence of association between replication stress and the immune system, a direct link between
mutagenesis and the immune system in tumor samples has not yet been shown.
Here we readdressed the question of the contribution of RT to mutational distribution by identifying tumors in which this association is weaker. A systematic analysis of the association
between RT and mutation rates using 2787 whole-genome sequenced (WGS) tumors, which are available from the Pan-Cancer Analysis of Whole Genomes (PCAWG23), reveals that the association of
approximately a third of the samples is much weaker than that of the majority of samples. We hypothesized that analyses of the two groups of tumors, which differ in association between RT
and MR, will help us to understand the molecular basis for this association. We show that, as expected, mutational signatures can partially explain the differences between the samples—tumors
that contain a large number of mutations associated with mutational signatures that are prevalent in early replication regions have weaker association with RT. Similarly, we found that
deleterious mutations in several pathways are enriched in samples showing weak association between RT and MR. Interestingly, analysis of genes differentially expressed between these two
groups of tumors revealed involvement of cell–cell communication and of the interaction with immune cells in modulating the effect of RT on mutation rates. These findings go along with
recent observations about a link between replication stress and immune response and, as far as we know, this is the first such relationship reported in vivo. Taken together, our
comprehensive approach reveals the involvement of both known and novel processes in controlling the genomic distribution of cancer somatic mutations.
ResultsUsing the degree ofassociation between mutation rates and replication timing to characterize tumor samples
Mutation rates (MR) are associated with replication timing (RT). As a rule, MR are higher in LRR (late replication regions) and lower in ERR (early replication regions)4,6. However, analysis
of individual tumors revealed that this association varies considerably, and that there are many tumors with weaker association between MR and RT. In order to systematically investigate
this phenomenon, we divided the genome into four equal bins of RT (limiting the analysis to genomic regions with constitutive RT, see “Methods”), and checked the mutation rate in these RT
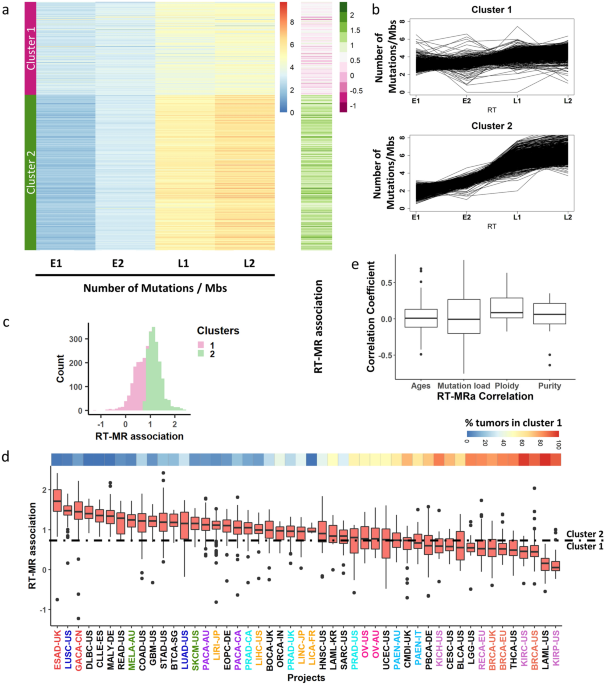
regions for each tumor. Then, we clustered the 2787 WGS tumors into two clusters according to the MR in each bin (“Methods”). Cluster 1 contains 1042 samples in which the association between
MR and RT is weak, while cluster 2 contains the remaining 1745 samples in which the association is stronger (Fig. 1a, b). For simplicity of further analyses, we defined the RT-MRa (“RT-MR
association”) metric as the log2 of the ratio between the MR in the late and the early bins \(\left( {{\text{RT}} - {\text{MRa}} = \log_{2} \frac{{{\text{normalized
}}\;{\text{mutation}}\;{\text{ count }}\left( {{\text{L}}1 + {\text{L}}2} \right)}}{{{\text{normalized }}\;{\text{mutation}}\;{\text{ count }}\left( {{\text{E}}1 + {\text{E}}2} \right){ }}}}
\right)\). This RT-MRa metric ranges from − 1 to 2.5, and most of the samples with RT-MRa score < 0.8 were found in cluster 1 (Fig. 1a (the rightmost column) and c).
Figure 1Uneven association between replication timing and mutation rates. (a) Heatmap capturing the mutation rate in each sample for four RT bins (E1−L2). The samples were clustered into two
distinct clusters (using K-means, see “Methods”) with distinct association between RT and mutation rates. The right heatmap column captures the ratio of the mutation rates between late (L1 +
L2) and early (E1 + E2) regions. Similar results were obtained for indel analysis (Supplementary Fig. S1). (b) For each cluster, each line shows the mutation rate of a tumor sample at each
RT region. (c) Histogram of the RT-MRa metric of all tumors is shown. The division into clusters is shown by colors (pink—cluster 1, green—cluster 2). (d) Box plot capturing the distribution
of the RT-MRa metric in each cancer project. The projects are sorted by the medians of the distributions. Similar cancer types are labeled with the same color. The number of samples in each
project is—BLCA-US:23, BOCA-UK:61, BRCA-EU:76, BRCA-UK:44, BRCA-US:92, BTCA-SG:12, CESC-US:20, CLLE-ES:90, CMDI-UK:62, COAD-US:46, DLBC-US:7, EOPC-DE:68, ESAD-UK:97, GACA-CN:32, GBM-US:41,
HNSC-US:44, KICH-US:49, KIRC-US:40, KIRP-US:34, LAML-KR:8, LAML-US:33, LGG-US:19, LICA-FR:5, LIHC-US:54, LINC-JP:28, LIRI-JP:260, LUAD-US:42, LUSC-US:48, MALY-DE:100, MELA-AU:70, ORCA-IN:13,
OV-AU:69, OV-US:45, PACA-AU:91, PACA-CA:143, PAEN-AU:47, PAEN-IT:34, PBCA-DE:230, PRAD-CA:110, PRAD-UK:78, PRAD-US:20, READ-US:16, RECA-EU:74, SARC-US:34, SKCM-US:38, STAD-US:39,
THCA-US:50, UCEC-US:51. The top panel represents the percent of the tumors in cluster 1 in each project. (e) Box plot capturing the Pearson correlation coefficient between RT-MRa and age,
mutation load, ploidy and purity (see “Methods”).
Full size imageNext, we examined the possibility of an association of the RT-MRa metric with tumor type (Fig. 1d). There are cancer types (i.e., different projects) that contain almost only tumors with
weak RT-MRa (cluster 1), such as kidney renal papillary cell carcinoma (KIRP) and breast cancer (BRCA), while others are heavily biased toward strong RT-MRa (cluster 2), such as esophageal
adenocarcinoma (ESAD) and lung squamous cell carcinoma (LUSC). Furthermore, projects of similar cancer types showed similar behavior in this tendency (Fig. 1d—different projects of similar
tumor types were given the same color).
The two clusters may be a consequence of confounding factors such as mutation load or age at diagnosis. In order to explore this possibility, we calculated the correlation between RT-MRa and
those features in each project. Both correlations were distributed normally with a mean of 0 (Fig. 1e), suggesting that RT-MRa levels are not associated with mutation rate or age at
diagnosis. Interestingly, we did find a small but significant correlation with tumor ploidy level, suggesting that tumors with higher level of duplication tend to have more somatic mutations
in late replicating regions (Fig. 1e) Similarly, there is a very small correlation with tumor purity, suggesting that tumors infiltrated by other tissues show lower RT-MRa score (see
“Discussion”).
Mutational signatures association with the RT-MRa metricIn order to explore the factors that influence RT-MRa, we next analyzed the contribution of mutational signatures. The mutational signatures found in each tumor reflect the mutational
processes that the tumor underwent. We have shown that mutational signatures differ in their association with RT6, and thus they may explain RT-MR association (RT-MRa). We would hypothesize,
therefore, that a tumor that mostly underwent mutational processes that are ERR-biased will end up with more mutations in ERR, resulting in a weaker RT-MRa metric as seen in cluster 1.
To explore this relationship between mutational processes and RT, we checked the correlation between the RT-MRa metric and the relative contribution of different mutational signatures. We
found mutational signatures that display positive correlation with the RT-MRa metric (i.e., samples with larger contribution of these signatures have stronger RT-MRa or belong to cluster 2),
and mutational signatures that display negative correlation (i.e., samples with larger contributions of these signatures have weaker RT-MRa or belong to cluster 1) (Fig. 2a). In some cases,
the reason for the associations is clear: signatures that are associated with ERR (such as SBS2 and SBS1324) are associated with cluster 1 tumors, whereas signatures associated with LRR
(such as SBS17a&b and SBS7a24) are associated with cluster 2 tumors. In addition, it is known that defects in DNA repair pathways can cause a different association between RT and MR9.
Indeed, signatures associated with defects in DNA repair mechanisms (APOBEC, base excision repair, mismatch repair and homologous recombination; Fig. 2a—the bold SBS) display negative
correlation with RT-MRa, (i.e., contribute more to cluster 1 tumors). Similar association with signatures associated with DNA repair defects was found using the Kruskal–Wallis rank test (see
“Methods” and Supplementary Fig. S2).
Figure 2Association between RT-MRa metric and Mutational signatures. (a) Pan-cancer analysis of the correlation between RT-MRa metric and signature contributions. Bar chart capturing the correlation
coefficient (R) between the RT-MRa score and the relative contribution of each signature. The highlighted signatures indicate signatures with an association with DNA repair defects. Color
of bars indicate the statistical significance of the correlation test (adjusted P value < 0.1, FDR-corrected correlation test). Small scatter plots display correlation of RT-MRa metric and
signatures contribution for three signatures. (b) Project-specific analysis of the correlation between RT-MRa metric and signature contributions. Heatmap capturing the correlation
coefficient (R) between the RT-MRa score and the relative contribution of each signature for each project. Only statistically significant associations (adjusted P value < 0.1) are shown. A
few examples of signatures with positive or negative correlation between their contribution and RT-MRa are shown in Supplementary Fig. S3. (c) Scatter plot of the mean correlation
coefficient vs. the mean percentage in cluster 1, taken from Fig. 1D (left panel), and the mean of delta ERR-LRR, taken from6 (right panel). Only projects with significant correlation (those
shown in b) were included in the analysis. (d) PCA plots of colon adenocarcinoma (COAD-US) samples separated into three groups based on their mutational signatures’ contribution data. Each
dot (representing a tumor sample) is colored according to its RT-MRa score (left panel). Box plots of the RT-MRa distribution of the three different groups. All P values derived from
FDR-corrected Wilcoxon rank–sum test. *, P < 0.1; ***, P < 0.001 (right panel).
Full size imageNext, we analyzed the association of the RT-MRa metric with mutational signatures for each project separately. This allowed us to identify signatures that are cancer-type specific and thus
are less prominent in a pan-cancer analysis. This analysis revealed many signatures that are either positively or negatively associated with the RT-MRa metric in specific projects (Fig. 2b).
As expected, signatures with a low mean correlation coefficient value are associated with cluster 1, whereas signatures with a high correlation are associated with cluster 2, which is
graphically captured in Fig. 2c (left panel). The association between RT-MRa and mutational signatures is partially explained by the RT bias of each signature6. Indeed, plotting the average
correlation coefficient as a function of the RT bias (delta ERR-LRR) of each signature, demonstrates this association (Fig. 2c right panel). It should be noted that there are signatures,
such as SBS7b and SBS16, that show a strong bias toward ERR6, yet are not associated with low RT-MRa (absent in Fig. 2b–d). This is because those signatures have a relatively small
contribution to the mutation load of the tumor, and thus their contribution to ERR is eclipsed by other signatures that contribute more mutations to LRR. For example, the UV related
signature SBS7b is associated with ERR, yet we do not find it in samples with low RT-MRa, since it is always accompanied by the LRR associated signature SBS7a, which has an average higher
contribution (47%) than SBS7b (16%).
After examining each signature separately, we checked whether combinations of signatures contribute to the RT-MRa. To this end, we represented each tumor by a vector containing the relative
contribution of each signature, and used principal component analysis (PCA) followed by K-means clustering to define subgroups of tumors within each project (see “Methods”). Our approach
revealed that there are distinct subgroups in many projects, and we examined whether these subgroups are associated with the RT-MRa metric using Wilcoxon rank sum test. In many projects,
such as COAD-US, a strong association was found (Fig. 2d, Supplementary Fig. S4 and Supplementary Table S1). This finding illustrates the importance and impact of the contribution of
signatures to the association between RT and mutation rates.
Taken together, as expected, mutational processes appear to have a strong association with the RT-MRa in many tumors. Yet in many cancer types we found variation in RT-MRa that cannot be
explained by signatures (Supplementary Fig. S4 and Table S1).
Identification of pathways significantly mutated in tumors with weak RT-MR associationNext, we explored the possibility that the differences in the RT-MRa scores stem from non-functional genes. To this end, we looked at the abundance of deleterious mutations in tumors with
weak and strong RT-MRa (the top 35% and the bottom 35% of scores, respectively). Since deleterious mutations are rare, we performed this analysis at a pathway level, meaning that instead of
asking whether a mutation in a particular gene is enriched, we asked if mutations in any gene belonging to a particular pathway are enriched. For the same reason, this analysis was performed
in a pan-cancer manner, pooling together samples from all projects. We counted the number of genes with deleterious mutations in all Reactome major pathways25and calculated the enrichment
in the low RT-MRa group using a binomial test (see “Methods”). As was previously suggested9,10,11, we found that the DNA repair pathway was enriched in the low RT-MRa group (adjusted P value
= 3 × 10⁻⁴; binomial test), suggesting that the difference between the MR in early and late replicating regions is due to differential repair efficiencies. Such differential repair is
probably due to differential chromatin structure and indeed mutations in genes associated with chromatin organization were highly enriched as well (adjusted P val = 5 × 10⁻⁶; binomial test).
In addition, we found enrichment of the DNA replication and cell cycle pathways (adjusted P values = 1 × 10⁻³ and 1 × 10⁻⁸, respectively; binomial test), as well as additional pathways for
which their influence on mutation distribution is less clear(Fig. 3a). This conclusion was independent of the definition of the deleterious mutations since similar results were observed
using a different definition of effective mutations (Supplementary Fig. S5). Interestingly, dividing the DNA repair pathway into sub-pathways revealed that many of them were enriched (Fig.
3b), suggesting that the association between RT and MR is affected by multiple DNA repair mechanisms and not confined to MMR and GG-NER, as has been previously suggested9,10,11. The ten most
enriched genes in DNA repair, DNA replication and chromatin organization pathways are shown (Fig. 3c).
Figure 3Mutated pathway analysis. (a) Testing the different pathways for enrichment of deleterious mutations in the weak RT-MRa group. Binomial tests were performed to test which pathways are
enriched. The statistically significant enrichment pathways are those that pass the threshold of adjusted P-value < 0.1 (i.e. − log10(adjusted P-value) > 1, the vertical dashed line). (b)
The DNA repair and chromatin organization pathways were further divided into sub pathways (using Reactome definition) and the enrichment analyses were repeated. The vertical dashed line
designates a threshold of adjusted P-val < 0.1. (c) Normalized mutation count for the two groups. For the designated pathways the ten genes with the lowest P-value are shown (see “Methods”;
a complete list of enriched genes can be found in Supplementary Table S2).
Full size imageIdentification of differentially expressed genes in tumors with weak RT-MR associationIn parallel to analyzing the mutated pathways, we performed differential expression analysis to identify correlation of gene expression and pathways with the RT-MRa metric. This analysis was
performed on samples for which RNA-seq data exists in addition to the WGS mutation information in ICGC23. We analyzed each project separately, since different tissues differ in their
expression profiles. As we have shown (Fig. 1d), the RT-MRa metric varies in most projects and thus can be used to define within each project a set of samples with stronger and weaker
association between RT and MR. To this end, we divided the samples in each project into three equally sized groups according to the RT-MRa values and used DESeq2 to identify differential
expressed genes between the strong RT-MRa and weak RT-MRa groups (Fig. 4a and Supplementary Fig. S6). We found numerous genes in most projects that passed the FDR < 0.1 criterion. In order
to control for inflated FDR in DEseq2 analyses26, we calculated an experimental FDR by randomizing the tumors in each project, performed differential expression analysis and counted the
number of genes that passed the FDR < 0.1 threshold in the randomized data. Only projects in which the number of differentially expressed genes in the randomized data that passed the
threshold was less than 10% of the number of genes identified by DESeq2 in the original data were considered valid and were kept for further analyses. Following this analysis, we were left
with 10 projects of interest. 9 of these had genes expressed higher in the weak RT-MRa group, and 6 had genes expressed higher in the strong RT-MRa group (5 projects contained genes in both
groups). We performed GO annotation analysis on these genes using the Metascape tool27, and identified several categories enriched in the weak RT-MRa group. Interestingly, very similar GO
terms were enriched in multiple projects (Fig. 4b, Supplementary Tables S3 and S4), suggesting common mechanisms, despite the wide range of tissues and phenotypes. Surprisingly, the
reoccurring enriched categories were associated with communications between cells and with the immune system, suggesting that tumors with weak RT-MRa contain a higher degree of infiltration
of immune cells (which most probably cause the enrichment of immunological categories). These results were confirmed using a more stringent differential expression identification approach
(based on a Wilcoxon test (following26)) (Supplementary Fig. S7, Supplementary Tables S5 and S6). In order to confirm this surprising finding, we tried to confirm the generality of the
association with the immune system. To this end, we looked at the group of genes that were enriched in several projects. Counting the number of projects each gene was enriched in revealed a
large number of genes enriched in multiple projects (Fig. 4c). The 421 differential genes that are enriched in at least 3 projects are also enriched for immunity-associated processes
(Supplement
ary Fig. S8). Furthermore, we were able to show that immune-related genes are expressed higher in the weak RT-MRa group in multiple cancer types (Fig. 4c and Supplementary Fig. S9). By
contrast, analyzing genes with higher expression in samples with strong RT-MRa did not reveal any association with cell–cell communication or immunology (Supplementary Fig. S10,
Supplementary Tables S7 and S8).
Figure 4Expression profile analysis. (a) Volcano-plots of three different projects. The red points are genes that are differentially expressed significantly between the groups (genes with higher
expression in the weak RT-MRa group have log2FC > 0). These points pass the thresholds of p.adjusted < 0.1 and |log2FC|> 1. (b) Heatmap capturing the significant enrichment of GO categories
in the nine selected projects. Non-significant enrichments (p.adjusted < 0.1) are colored grey. (c) Histograms capturing the bias in the expression of immune related genes to the weak RT-MRa
group in multiple cancer types. For each gene we counted the percentage of projects it was enriched (logFC > 0) in the weak RT-MRa group (orange bars). The distribution is strongly skewed
to the right in comparison to a random group of tumors (gray bars) (P val < 10–16, effect size = 0.76; paired t-test). Note that this is not the case for a random set of genes (right
histograms; P val < 0.007, effect size = 0.13; paired t-test).
Full size imageThe association between RT-MRa and immune genes expression could be either causative or affected by a common confounding factor. It is generally hard to infer causality from associations and
thus the only thing that can be done is to look for association between the RT-MRa and other potential confounding factors. Although there was no general association of the RT-MRa metric
with either age or mutation load (Fig. 1e), we re-examined those associations in the nine tumor types with genes expressed higher in the weak RT-MRa group. We found that in colon cancer
(COAD-US) the weak RT-MRa group is associated with high mutation load and also with neoantigens (see “Methods”). Moreover, for the 26 colon cancer samples, for which we have information
about the status of microsatellite instability (MSI)23, the weak RT-MRa group is associated with MSI positive tumors (P val = 0.015; Chi square) (Fig. 5a). This suggests that for colon
cancer, the association with the immune genes may be a consequence of high mutation load. On the other hand, in all other cases such associations were not found (Fig. 5b, c), suggesting that
the involvement of the immune genes may be associated directly with mutation distribution. The associations with age at diagnosis were weak (Supplementary Fig. S11).
Figure 5Confounding factors. (a) Confounding factors in COAD-US project: Statistic of MSI positive and negative tumors counts in the Strong/Weak groups (left panel), boxplots of the mutation load
distribution of the strong and weak groups (middle panel) and of the neoantigen mutations count distribution of the strong and weak groups (right panel). (b) Boxplot of the mutation load
distribution of the strong and weak groups in the different projects. All adjusted P values derived from one-tailed t-test and Benjamini & Hochberg correction (FDR). (c) Boxplot of the
neoantigen mutations count distribution of the strong and weak groups in the different projects (see “Methods” for the neoantigen mutations definition). All adjusted P values derived from
one-tailed t-test and Benjamini & Hochberg correction (FDR).
Full size imageDiscussionReplication timing is strongly associated with mutation rates, with more mutations occurring at LRR (reviewed in4). Previous studies suggested that this association stems from more efficient
DNA repair in the early replicating, more accessible parts of the genome. Indeed, defects in either mismatch repair (MMR) or global genome nucleotide excision repair (GG-NER) mechanisms
abolish the RT-MRa9,10,11. Here we expanded this approach and systematically analyzed the association between RT and MR using 2787 whole-genome sequenced (WGS) tumors (PCAWG;23). We found
variability in RT-MRa between tumors. In approximately 30% of the tumors the association is weak, with almost the same number of mutations in early and late replicating regions. We grouped
the samples according to the degree of their RT-MRa in order to identify the molecular processes that modulate the association.
We found a similar type of variability in RT-MRa for SNVs and for indels (Supplementary Fig. S1), however, when we compared individual samples we found many instances in which the extent of
the association was different for SNVs and for indels. This supports the notion that such associations are a result of many factors, explaining why they show variability between individual
samples. While the current work concentrates on SNVs, further research is needed for deciphering the factors that contribute to indels and also to CNVs.
Throughout this work we analyzed the association between RT and MR. Yet, we are not excluding the possibility that the actual association is between chromatin accessibility (for which RT is
a proxy) and MR. Indeed, calculating a parallel metric, based on data about chromatin accessibility (CA-MRa = chromatin accessibility-MR association metric) gave almost identical results
(Supplementary Fig. S12), suggesting that RT and chromatin accessibility are tightly associated and it is very hard to distinguish between them in the genomic context.
We have previously shown that different mutational processes have distinct associations with RT6. Thus, we expected that the combination of signatures characterizing each tumor sample would
affect the RT-MRa. Indeed, tumors that underwent mutational processes more abundant in ERR show weaker RT-MRa (Fig. 2), reflecting the fact that they have a lot of mutations in ERR. This
simple explanation for the variability in RT-MRa explains much of the difference in the RT-MRa score between different tumor types (Figs. 1d and 2c). We also found that mutational signatures
related to DNA repair have a greater contribution in tumors with the weaker association, supporting previous observations that defects in DNA repair pathways can affect the association
between RT and MR9,10,11. These results differ from the results of a recent pre-print that analyzed the association of cancer mutational signatures with chromatin topographical features
including replication timing12. They found that signatures associated with MMR deficiency vary in their association with RT between cancer types, whereas our pan cancer analysis revealed
much stronger association (bold signatures in Fig. 2a). These differences are probably a consequence of the analysis method. We have analyzed the data in a pan cancer manner while Otlu et
al., analyzed each cancer type separately. In addition, we have restricted our analysis to the parts of the genome that replicate at the same time in all examined tissues, whereas Otlu et
al., used the entire genome. While each methodology has advantages, we prefer using only the RT constitutive parts of the genome in order to avoid noise introduced by the differences in RT
between tissues.
Clustering the samples based on the mutational signatures results in subgroups that differ in their RT-MRa metric (Fig. 2d). Yet, in many cases the signatures are not associated with RT-MRa,
suggesting that other processes are modulating the genome-wide distribution of mutations.
Next, we were able to show that deleterious mutations in several pathways are enriched for tumor with weaker RT-MRa. Moreover, this enrichment is not limited to the MMR and GG-NER pathways
but extends to additional types of DNA repair mechanisms (Fig. 3b), as well as replication and chromatin structure pathways, suggesting that multiple cellular processes contribute to the
uneven distribution of mutations. Interestingly, performing the same analysis on all the Reactome pathways revealed additional pathways which are significantly enriched in deleterious
mutation in the low RT-MRa group (Fig. 3a). This suggests that many other processes, including metabolism of RNA and cellular response to stimuli, are somehow involved in the association
between RT and MR. Further research is needed in order to decipher the underlying mechanisms for it.
It has been shown that mutations in replication-associated genes (e.g. polymerase proofreading errors) generate more mutations in late replicating regions28, nevertheless we found enrichment
for mutations in DNA repair genes in the weak RT-MRa group of tumors. This does not exclude the presence of tumors with DNA repair mutations in the high RT-MRa samples which may be the case
of mutations in the replicating polymerases. Nevertheless, our analysis only partially supports those previous observations, since only SBS9 (associated with Pol Etta mutations) is
positively correlated with the RT-MRa metrric, whereas SBS10a and b (associated with Polymerase epsilon proofreading defects) show no or slightly negative correlation with the RT-MRa metric,
respectively (Fig. 2a).
Interestingly, a larger fraction of tumors with high RT-MRa association contain deleterious mutations in DNA repair genes (50%) than in the low RT-MRa group (33%). This finding apparently
contradicts the enrichment in DNA repair associated signatures in the low RT-MRa group (Fig. 2a) and the enrichment in the number of deleteriously mutated DNA repair genes in the low RT-MRa
group (Fig. 3a). This contradiction together with the recent finding that signatures associated with MMR deficiency vary in their association with RT between cancer types12 suggests that
mutations in DNA repair genes contribute to perturbation in the RT-MRa but are not always sufficient.
Differential expression analyses revealed that genes highly expressed in the weak RT-MRa samples were enriched in cellular processes involved with interactions between cells and especially
with the immune system. Due to the unexpected nature of these results, we took additional measures of precautions. First, we ruled out the possibility of artefacts in the differential
expression analysis, by calculating an experimental FDR (based on randomization of the group assignments) and by using a different, more conservative differential expression algorithm (based
on a non-parametric test). Secondly, we considered only GO terms that were enriched in several projects (Fig. 4b). Thirdly, we found the same pathways enriched for genes that are
differentially expressed in several projects (Supplementary Fig. S8). Finally, we showed that the immune-related categories are enriched in many additional projects (Fig. 4c and
Supplementary Fig. S9). We also addressed the possibility that the identified association is due to other confounding factors, by looking at the contribution of mutation load, age at
diagnosis and tumor sub-type (Fig. 5 and Supplementary Fig. S11). Finding immune genes highly expressed in samples with weak RT-MRa suggests that these samples have higher degrees of immune
cells infiltration. This explanation cannot be valid for the acute myeloid leukemia project (LAML-US) since it is not a solid tumor in which it seems that the immune genes are from the tumor
itself. It is important to clarify that that the mutations found in the samples that were used to calculate the RT-MRa score are from the tumor and not from any infiltrating cells, since
somatic mutation calling requires multiple occurrences of the same mutation, which is achieved in tumors due to their clonally but not in infiltrating normal cells. This explains why we
found immunology genes in the expression profile analysis (Fig. 4) and did not find it in the mutation analysis (Fig. 3).
Interestingly, the finding of immune genes in samples with weak RT-MRa was not associated with the overall RT-MRa level, and it can therefore be found both in colon cancer in which most of
the samples have relatively high RT-MRa levels (cluster 2; Fig. 1d) and in thyroid cancer in which most of the samples have relatively low RT-MRa levels (cluster 1; Fig. 1d). This would
suggest that the overall level is affected by other factors, including the mutational signatures characteristic of each tumor type, and the immune cells infiltration affects the level of
RT-MRa within the general range which is characteristic for each tumor type.
Our findings of a correlation between immune cell infiltration with weak RT-MRa is supported also by the analysis of tumor purity (Fig. 1e), that suggests that tumors that are mixed with
other tissues (low purity) are associated with low RT-MRa. It could be explained by two opposite explanations. It is possible that cells with weak RT-MRa recruit the immune system with
higher efficiency than those with strong RT-MRa; alternatively, it may be that cell–cell interactions, and particularly interactions of the cancer cells with immune cells, affect the
genome-wide distribution of mutations. Indeed, tumors with high mutation loads and especially higher neoantigens load, tend to be more immunogenic29,30. This is the case in colon cancer
(COAD-US), where we found that the weak RT-MRa group is associated with higher mutation load and with MSI positive tumors (Fig. 5a) suggesting that in this case immune cells infiltration is
a consequence of the higher mutation load that is associated with the weak RT-MRa group. On the other hand, we did not find such associations with the other tumor types (Fig. 5b and c),
suggesting that either the non-conventional distribution of mutations recruits the immune system, or the involvement of the immune system somehow modulates mutation distribution. Expression
profiling reports on the current situation of the sample, while mutation analysis reports on the mutational history of the sample since mutations accumulate over time. Thus, according to the
first possibility we interpret the results that the current situation of non-conventional mutation distribution recruits the immune system, whereas according to the latter explanation we
ought to assume that the infiltrating immune cells exist also in previous stages of the development of the cancer. Both explanations are consistent with recent findings regarding the
association of the immune system with replication stress13,18,19,20. Accumulating evidence indicates that replication stress–inducing agents such as topoisomerase inhibitors and cells
deficient in replication stress response genes induce the expression of type I IFNs and pro-inflammatory cytokines21,31,32,33. On the other hand, inflammation causes replication stress, by
the influence of ISG1522. The fact that there is enrichment of immune genes in the weak RT-MRa samples, raises the question of why is it confined to those samples. This can be explained by
the assumption that collision between replication and transcription machineries is the main cause of the immune-related replication stress34,35. Such collisions are expected to be found
especially in early replicating regions, due to the prevalence of highly expressed genes in these areas36,37,38,39. This, in turn, leads to weak RT-MRa40. Indeed, a higher percentage of
mutations fell within genes in the samples with weak RT-MRa, in most (7/9) of the relevant projects (Supplementary Fig. S13).
An association between replication stress and inflammation (by IFI16/STING pathway) has been shown in hidradenitis suppurativa (HS) patients41. Yet in the context of cancer, this was
demonstrated only in tissue culture systems13,21,22,31,33. To the best of our knowledge, this is the first demonstration of the association between mutation distribution and the immune
system in patients' tumor samples.
Which parts of the immune system are involved in the identified process? Our results suggest that both the innate and acquired parts of the immune response are involved (Figs. 4b, c and S9),
however a more detailed analysis trying to deconvolve the immune cell signal is needed for deeper understanding of the particular contribution of the immune system.
Are infiltrating immune cells always associated with a change in cancer somatic mutation distribution? Although our analysis hints at such a connection, it is not sufficient to support such
a strong statement due to the following reasons. First, we were only able to identify reliably differentially expressed genes in 10 cancer types. Secondly, even within this limited group we
found enrichment of immune genes only in several projects. Finally, although we ruled out the involvement of neo-antigens in recruiting the immune system in most projects (Fig. 5), it is
very hard to rule out the involvement of other confounding factors. Thus, further research is needed in order to confirm and to understand the molecular mechanisms underlying this intriguing
finding.
What is the evolutionary advantage of the uneven distribution of mutations along the genome? The regular trend of fewer mutations in the early replicating regions can be understood as a way
to guard genes (which are concentrated in the early replicating regions) from mutations and thus its evolutionary advantage is clear. Our finding that in many cancer samples the distribution
of mutations is almost even between early and late replicating regions raises a question about its advantages. It may be that it does not give advantage and is merely consequence of factors
that affect mutation distribution. Yet, it is plausible to speculate that it may be advantageous in recruiting the immune systems to those cells. Thus it may be that actually, the low
RT-MRa pattern is more abundant but cells with higher mutation rate in ERR specifically recruit the immune system and get eliminated before developing into a mature cancer. This intriguing
speculation should be tested by performing a similar analysis in normal cells for somatic mutations42.
MethodsData sourcesWe downloaded somatic mutation calls (VCF files) from the PCAWG consortium release of 2,787 whole-cancer genomes across 38 tumor types23. The data consists of two sources—The International
Cancer Genome Consortium (ICGC; 1902 samples) and The Cancer Genome Atlas (TCGA; 885 samples). Each source utilized its standard variant call pipeline (Consensus calls for ICGC, and the
Broad Institute variant calling pipeline for TCGA). The somatic mutation profile of the two consortiums were very similar both in terms of 96 trinucleotide context, and in terms of
mutational signatures6. Accordingly, we combined the mutation calls data for all analyses.
In addition, we downloaded expression data available for 1401 of the WGS samples in ICGC. We only included data from primary tumors for the differential expression analysis.
Clusterdivision
To minimize the effect of variation in RT between cell types, we only used the constitutive RT regions for our analyses, which constitute approximately 40% of the human genome that have the
same RT in 26 tissues examined43 and are also similar in cancer6. Constitutive RT regions were divided into 4 equal bins each spanning the same range of RT: earliest, intermediate early,
intermediate late, latest (E1, E2, L1, L2 respectively). Among the constitutive RT regions—498.6 Mb are defined as E1; 227.6 Mb are defined as E2; 238.4 Mb are defined as L1; and 324.6 Mb as
L2. For each tumor, the number of mutations in each of the four regions was counted. These counts were normalized for the regions' sizes and the number of mutations per 1 Mb were kept.
Thus, each tumor is characterized by a vector of length four, which we used for k-means clustering (Spearman rank correlation method) that divided the data into two different clusters. The
RT-MRa (“RT-MR association”) metric is \(RT - MRa = \log_{2} \frac{{{\text{normalized mutation count }}\left( {{\text{L}}1 + {\text{L}}2} \right)}}{{{\text{normalized mutation count }}\left(
{{\text{E}}1 + {\text{E}}2} \right)}}\).
The association between the confounding factors and RT-MRaTo analyze the effect of some confounding factors on the RT-MRa measurement we downloaded data of ages, ploidy and purity of the tumors from the PCAWG consortium23 and calculated the
mutation load for each tumor. For each cancer type we calculated the correlation coefficient between the RT-MRa of the tumors and the specific factor. We show the distribution of the
correlation coefficient measurements in all cancer types in Fig. 1e.
The association between the signature contribution and clusters tumorsThe data of the mutational signatures and their association to RT were taken from Yaacov et al.6. For each mutational signature we performed correlation test (by the cor.test function in R)
with the RT-MRa metric. This was done both for a pool of all tumors (pan-cancer analyses) and for individual projects separately. In the pan-cancer analysis, the test was performed on the
tumors in which the signature contribution was above zero. In the cancer-specific analysis, the test was performed on the condition that the mean signature contribution in the project's
tumors was above 5%. The FDR correction was done by the p.adjust (Benjamini–Hochberg Procedure) function in R.
Pan-cancer analyses were also done using ranking statistics. For each mutational signature the tumors were sorted according to the relative contribution of the signature to the overall
mutation load. We excluded tumors for which the contribution of the specific signature was below 5%. The association of the rank versus the cluster annotation was assessed using the
Kruskal–Wallis rank test. Only statistically significant signatures were shown in Supplementary Fig. S2.
For examining the contribution of combinations of signatures to the RT-MRa we represented each tumor sample by the vector of the contribution of each mutational signature to it and used
principal components analysis (PCA) to identify groups of similar samples. The resulting groups were further separated by K-means clustering (using the kmeans function in R) to determine the
number of clusters by the maximum number of average silhouette widths of the clusters (using the factoextra::fviz_nbclust R function). We examined the association between our RT-MRa metric
and the different groups by Wilcoxon rank-sum test for each pair of clusters. Finally, we computed and plotted the PCA using the stats::prcomp and ggplot2::autoplot functions, using the
clusters we found.
Mutational analysisWe focused on all the Reactome pathways25. As an additional control we also performed the analysis three times with 500 random chosen genes.. For the DNA repair and chromatin organization
pathways we also analyzed sub pathways (defined by the Reactome).
To focus only on mutations that have a deleterious effect on the protein we used vcf2maf software44, which provide three different predictions based on Ensembl Variant Effect Predictor
(VEP)45, the Sorting Intolerant from Tolerant (SIFT) algorithm46 and PolyPhen (Polymorphism Phenotyping)47.
In order to analyze the most different tumors from the two clusters we only focused on the top and bottom 35% RT-MRa score tumors.
For each pathway, deleterious mutated genes in each group were counted, and then we performed a one-sided binomial test to examine which mutated pathway is enriched in the weak RT-MRa group.
The null hypothesis is that a similar ratio of deleterious mutations between the groups should be found in all pathways. Thus, we used the ratio in the total deleterious mutations in the
strong and weak groups as the P in the binomial test. In all cases we corrected for multiple hypotheses testing by FDR. Sub pathway analyses were performed in the same way.
We performed the same statistical test for all individual genes (Supplementary Table S2). The 10 genes with the lowest P value are shown in Fig. 3C. The mutations in each gene in each group
were counted and normalized to 100 K mutations.
For counting the neoantigen mutations in the tumors (Fig. 5) we included only mutations in genes that follow these definitions in the vcf2maf results: Splice Site, Nonsense Mutation, Frame
Shift Del, Frame Shift Ins, Nonstop Mutation, Translation Start Site, In Frame Ins, In Frame Del, Missense Mutation, Splice Region.
Differential expression analysisThe differential expression analysis was performed for each cancer project separately. Each project is divided into 3 equal groups according to the RT-MRa score. Then, we used the available
expression data from the ICGC to examine which genes are expressed differently between the two extreme groups either by DEseq248 or by Wilcoxon rank-sum test26. The Wilcoxon test was
performed on a preprocessed count matrix using the edgeR package49. The obtained P values of both methods were corrected for multiple hypotheses using FDR. In addition, for the DEseq2
results, we calculated an experimental FDR by randomizing the tumors in each group in each project, re-identifying differentially expressed genes and counting the number of genes that passed
the FDR < 0.1 criteria in the randomized data.
To examine the bias in the expression of immune-related genes in the weak RT-MRa group in multiple cancer types (Fig. 4C) we calculated the average expression of genes from immune-related GO
terms (and from control GO terms) in the weak and strong RT-MRa groups. Then we calculated the percentage of projects with higher expression (logFC > 0) in the weak RT-MRa group. We
performed the same analysis on the results of DESeq2 run on 2 random groups of tumors and performed a paired t-test on both lists. From this result we calculated the effect size using this
formula: \(d = t\sqrt {\frac{{n_{1} + n_{2} }}{{n_{1} \cdot n_{2} }}}\)
GO annotation analysisFor each project we took the genes that were differentially expressed in one of the groups (strong or weak) separately and analyzed it for GO pathways enrichment using Metascape27. Using all
human genes as the background. We limited our analyses to “GO Biological Processes (1148)”. We used the “Heatmap of enriched terms across input gene lists” from the result page. The
identification of genes differentially expressed in multiple projects was done using the “Evidence.csv” file (Supplementary Tables S3, S5 and S7). The genes enriched in multiple projects
were rerun in Metascape and used the “Heatmap of selected GO”. In addition, we provided the “FINAL_GO.csv” file (Supplementary Tables S4, S6 and S8).
Chromatin annotationsWe downloaded chromatin annotation data from a recent publication50. Regions annotated as either “active” or “active2” were defined as active chromatin whereas the “inactive” regions were
defined as inactive chromatin. For each tumor, the number of mutations in each of the two regions was counted. These counts were normalized for the region's sizes and the number of mutations
per 1 Mb were kept. The Chromatin accessibility—MRa (“CA-MR association”) metric is
$$CA - MRa = \log_{2} \frac{{{\text{normalized mutation count }}\left( {{\mathbf{Inactive}}{\text{regions}}} \right)}}{{{\text{normalized mutation count }}\left( {{\mathbf{Active}}{\text{ regions}}} \right){ }}}.$$
Finally, we calculated the correlation between RT-MRa and Chromatin-MRa across the tumors.
StatisticsStatistical analyses were performed using R version 4.1.2. For multiple comparisons, P values were corrected by FDR using the p.adjust(method = “BH"”) function in R. Plots were generated
using ggplot2, ggpubr, and pheatmap R packages.
Data availabilityThe datasets analyzed during the current study are available in the PCAWG consortium repository [https://dcc.icgc.org/].
References Tomasetti, C. & Vogelstein, B. Cancer etiology. Variation in cancer risk among tissues can be explained by the number of stem cell divisions. Science 347(6217), 78–81 (2015).
ADS CAS PubMed PubMed Central Google Scholar
Stamatoyannopoulos, J. A. et al. Human mutation rate associated with DNA replication timing. Nat. Genet. 41(4), 393–395 (2009).
CAS PubMed PubMed Central Google Scholar
Woo, Y. H. & Li, W. H. DNA replication timing and selection shape the landscape of nucleotide variation in cancer genomes. Nat. Commun. 3, 1004 (2012).
ADS PubMed Google Scholar
Blumenfeld, B., Ben-Zimra, M. & Simon, I. Perturbations in the replication program contribute to genomic instability in cancer. Int. J. Mol. Sci. 18, 6 (2017).
Google Scholar
Pleasance, E. D. et al. A comprehensive catalogue of somatic mutations from a human cancer genome. Nature 463(7278), 191–196 (2010).
ADS CAS PubMed Google Scholar
Yaacov, A. et al. Cancer mutational processes vary in their association with replication timing and chromatin accessibility. Cancer Res. 81(24), 6106–6116 (2021).
CAS PubMed Google Scholar
Tomkova, M. et al. Mutational signature distribution varies with DNA replication timing and strand asymmetry. Genome Biol. 19(1), 129 (2018).
PubMed PubMed Central Google Scholar
Morganella, S. et al. The topography of mutational processes in breast cancer genomes. Nat. Commun. 7, 11383 (2016).
ADS CAS PubMed PubMed Central Google Scholar
Supek, F. & Lehner, B. Differential DNA mismatch repair underlies mutation rate variation across the human genome. Nature 521(7550), 81–84 (2015).
ADS CAS PubMed PubMed Central Google Scholar
Zheng, C. L. et al. Transcription restores DNA repair to heterochromatin, determining regional mutation rates in cancer genomes. Cell Rep. 9(4), 1228–1234 (2014).
CAS PubMed PubMed Central Google Scholar
Yurchenko, A. A. et al. Genomic mutation landscape of skin cancers from DNA repair-deficient xeroderma pigmentosum patients. Nat. Commun. 14(1), 2561 (2023).
ADS CAS PubMed PubMed Central Google Scholar
Otlu, B. et al. Topography of mutational signatures in human cancer. bioRxiv 2023, 29 (2023).
Google Scholar
Bianco, J. N. et al. Overexpression of Claspin and Timeless protects cancer cells from replication stress in a checkpoint-independent manner. Nat. Commun. 10(1), 910 (2019).
ADS PubMed PubMed Central Google Scholar
Ubhi, T. & Brown, G. W. Exploiting DNA replication stress for cancer treatment. Cancer Res. 79(8), 1730–1739 (2019).
CAS PubMed Google Scholar
Riaz, N. et al. The role of neoantigens in response to immune checkpoint blockade. Int. Immunol. 28(8), 411–419 (2016).
CAS PubMed PubMed Central Google Scholar
Matsushita, H. et al. Cancer exome analysis reveals a T-cell-dependent mechanism of cancer immunoediting. Nature 482(7385), 400–404 (2012).
ADS CAS PubMed PubMed Central Google Scholar
Thomas, A. et al. Therapeutic targeting of ATR yields durable regressions in small cell lung cancers with high replication stress. Cancer Cell 39(4), 566–579 (2021).
CAS PubMed PubMed Central Google Scholar
Techer, H. & Pasero, P. The replication stress response on a narrow path between genomic instability and inflammation. Front. Cell Dev. Biol. 9, 702584 (2021).
PubMed PubMed Central Google Scholar
Bronner, C. E. et al. Mutation in the DNA mismatch repair gene homologue hMLH1 is associated with hereditary non-polyposis colon cancer. Nature 368(6468), 258–261 (1994).
ADS CAS PubMed Google Scholar
Yu, Q. et al. DNA-damage-induced type I interferon promotes senescence and inhibits stem cell function. Cell Rep. 11(5), 785–797 (2015).
MathSciNet CAS PubMed PubMed Central Google Scholar
Coquel, F. et al. SAMHD1 acts at stalled replication forks to prevent interferon induction. Nature 557(7703), 57–61 (2018).
ADS CAS PubMed Google Scholar
Raso, M. C. et al. Interferon-stimulated gene 15 accelerates replication fork progression inducing chromosomal breakage. J. Cell Biol. 219, 8 (2020).
Google Scholar
Consortium, I.T.P.-C. Pan-cancer analysis of whole genomes. Nature 578(7793), 82–93 (2020).
ADS Google Scholar
Mas-Ponte, D. & Supek, F. DNA mismatch repair promotes APOBEC3-mediated diffuse hypermutation in human cancers. Nat. Genet. 52(9), 958–968 (2020).
CAS PubMed PubMed Central Google Scholar
Gillespie, M. et al. The reactome pathway knowledgebase 2022. Nucleic Acids Res. 50(D1), D687–D692 (2022).
CAS PubMed Google Scholar
Li, Y. et al. Exaggerated false positives by popular differential expression methods when analyzing human population samples. Genome Biol. 23(1), 79 (2022).
CAS PubMed PubMed Central Google Scholar
Zhou, Y. et al. Metascape provides a biologist-oriented resource for the analysis of systems-level datasets. Nat. Commun. 10(1), 1523 (2019).
ADS PubMed PubMed Central Google Scholar
Haradhvala, N. J. et al. Mutational strand asymmetries in cancer genomes reveal mechanisms of DNA damage and repair. Cell 164(3), 538–549 (2016).
CAS PubMed PubMed Central Google Scholar
Wu, Z. et al. Identification of gene expression profiles and immune cell infiltration signatures between low and high tumor mutation burden groups in bladder cancer. Int. J. Med. Sci. 17(1),
89–96 (2020).
MathSciNet CAS PubMed PubMed Central Google Scholar
Zou, X. L. et al. Prognostic value of neoantigen load in immune checkpoint inhibitor therapy for cancer. Front. Immunol. 12, 689076 (2021).
CAS PubMed PubMed Central Google Scholar
Luthra, P. et al. Topoisomerase II inhibitors induce DNA damage-dependent interferon responses circumventing ebola virus immune evasion. MBio 8, 2 (2017).
Google Scholar
Dunphy, G. et al. Non-canonical activation of the DNA sensing adaptor STING by ATM and IFI16 mediates NF-kappaB signaling after nuclear DNA damage. Mol. Cell 71(5), 745–760 (2018).
CAS PubMed PubMed Central Google Scholar
Shen, J. et al. PARPi triggers the STING-dependent immune response and enhances the therapeutic efficacy of immune checkpoint blockade independent of BRCAness. Cancer Res. 79(2), 311–319
(2019).
CAS PubMed Google Scholar
Deshpande, A. M. & Newlon, C. S. DNA replication fork pause sites dependent on transcription. Science 272(5264), 1030–1033 (1996).
ADS CAS PubMed Google Scholar
Liu, Y. et al. Topoisomerase I prevents transcription-replication conflicts at transcription termination sites. Mol. Cell Oncol. 8(1), 1843951 (2020).
PubMed PubMed Central Google Scholar
Lalonde, M. et al. Consequences and resolution of transcription-replication conflicts. Life (Basel) 11, 7 (2021).
Google Scholar
Marchal, C., Sima, J. & Gilbert, D. M. Control of DNA replication timing in the 3D genome. Nat. Rev. Mol. Cell Biol. 20(12), 721–737 (2019).
CAS PubMed Google Scholar
Garcia-Muse, T. & Aguilera, A. Transcription-replication conflicts: How they occur and how they are resolved. Nat. Rev. Mol. Cell Biol. 17(9), 553–563 (2016).
CAS PubMed Google Scholar
Hamperl, S. et al. Transcription-replication conflict orientation modulates r-loop levels and activates distinct DNA damage responses. Cell 170(4), 774–786 (2017).
CAS PubMed PubMed Central Google Scholar
Sankar, T. S. et al. The nature of mutations induced by replication-transcription collisions. Nature 535(7610), 178–181 (2016).
ADS CAS PubMed PubMed Central Google Scholar
Orvain, C. et al. Hair follicle stem cell replication stress drives IFI16/STING-dependent inflammation in hidradenitis suppurativa. J. Clin. Invest. 130(7), 3777–3790 (2020).
CAS PubMed PubMed Central Google Scholar
Yaacov, A., Rosenberg, S. & Simon, I. Mutational signatures association with replication timing in normal cells reveals similarities and differences with matched cancer tissues. Sci. Rep.
13(1), 7833 (2023).
ADS CAS PubMed PubMed Central Google Scholar
Rivera-Mulia, J. C. et al. Dynamic changes in replication timing and gene expression during lineage specification of human pluripotent stem cells. Genome Res. 25(8), 1091–1103 (2015).
CAS PubMed PubMed Central Google Scholar
Kandoth, C. mskcc/vcf2maf: vcf2maf. https://github.com/mskcc/vcf2maf/releases (2020).
McLaren, W. et al. The ensembl variant effect predictor. Genome Biol. 17(1), 122 (2016).
PubMed PubMed Central Google Scholar
Sim, N. L. et al. SIFT web server: Predicting effects of amino acid substitutions on proteins. Nucleic Acids Res. 40, W452-7 (2012).
PubMed Google Scholar
Adzhubei, I., Jordan, D. M. & Sunyaev, S. R. Predicting functional effect of human missense mutations using PolyPhen-2. Curr. Protoc. Hum. Genet. 7, 20 (2013).
Google Scholar
Love, M. I., Huber, W. & Anders, S. Moderated estimation of fold change and dispersion for RNA-seq data with DESeq2. Genome Biol. 15(12), 550 (2014).
PubMed PubMed Central Google Scholar
Robinson, M. D., McCarthy, D. J. & Smyth, G. K. edgeR: A Bioconductor package for differential expression analysis of digital gene expression data. Bioinformatics 26(1), 139–140 (2010).
CAS PubMed Google Scholar
Akdemir, K. C. et al. Somatic mutation distributions in cancer genomes vary with three-dimensional chromatin structure. Nat. Genet. 52(11), 1178–1188 (2020).
CAS PubMed PubMed Central Google Scholar
Download references
AcknowledgementsThis research was funded by the Israel Academy of Sciences (grant No. 1283/21), the Binational Science Foundation (grants No. 2019688 and 2021085) and the joint fund for the Hebrew
University and its affiliated hospitals. The authors thank Dr. Sheera Adar and May Merav for assistance in data analysis and for critical reading of the manuscript, and Avraham Greenberg for
assistance in editing and writing.
Author informationAuthor notesThese authors contributed equally: Oriya Vardi-Yaacov and Adar Yaacov.
Authors and Affiliations Department of Microbiology and Molecular Genetics, IMRIC, Faculty of Medicine, Hebrew University of Jerusalem, Jerusalem, Israel
Oriya Vardi-Yaacov, Adar Yaacov & Itamar Simon
Sharett Institute for Oncology, The Gaffin Center for Neuro-Oncology, Hebrew University-Hadassah Medical Center, Jerusalem, Israel
Adar Yaacov & Shai Rosenberg
The Wohl Institute for Translational Medicine, Hadassah-Hebrew University Medical Center, Jerusalem, Israel
Adar Yaacov & Shai Rosenberg
AuthorsOriya Vardi-YaacovView author publications You can also search for this author inPubMed Google Scholar
Adar YaacovView author publications You can also search for this author inPubMed Google Scholar
Shai RosenbergView author publications You can also search for this author inPubMed Google Scholar
Itamar SimonView author publications You can also search for this author inPubMed Google Scholar
ContributionsContributed equally: O.V.-Y. and A.Y. Correspondence authors: I.S. and S.R. were part of writing the main manuscript text. All authors reviewed the manuscript.
Corresponding author Correspondence to Itamar Simon.
Ethics declarations Competing interestsThe authors declare no competing interests.
Additional informationPublisher's noteSpringer Nature remains neutral with regard to jurisdictional claims in published maps and institutional affiliations.
Supplementary InformationSupplementary Legends.SupplementaryFigures.Supplementary Table S1.Supplementary Table S2.Supplementary Table S3.Supplementary Table S4.Supplementary Table S5.Supplementary Table S6.Supplementary Table S7.Supplementary Table
S8.Rights and permissions
Open Access This article is licensed under a Creative Commons Attribution 4.0 International License, which permits use, sharing, adaptation, distribution and reproduction in any medium or
format, as long as you give appropriate credit to the original author(s) and the source, provide a link to the Creative Commons licence, and indicate if changes were made. The images or
other third party material in this article are included in the article's Creative Commons licence, unless indicated otherwise in a credit line to the material. If material is not included in
the article's Creative Commons licence and your intended use is not permitted by statutory regulation or exceeds the permitted use, you will need to obtain permission directly from the
copyright holder. To view a copy of this licence, visit http://creativecommons.org/licenses/by/4.0/.
Reprints and permissions
About this articleCite this article Vardi-Yaacov, O., Yaacov, A., Rosenberg, S. et al. Both cell autonomous and non-autonomous processes modulate the association between replication timing
and mutation rate. Sci Rep 13, 13143 (2023). https://doi.org/10.1038/s41598-023-39463-1
Download citation
Received: 27 February 2023
Accepted: 26 July 2023
Published: 12 August 2023
DOI: https://doi.org/10.1038/s41598-023-39463-1
Share this article Anyone you share the following link with will be able to read this content:
Get shareable link Sorry, a shareable link is not currently available for this article.
Copy to clipboard Provided by the Springer Nature SharedIt content-sharing initiative